Solana Price Eyes $70 as RSI Hints at Bullish Momentum
· Crypto · QuoteReporter
Solana Price Eyes $70 as RSI Hints at Bullish Momentum
Solana (SOL/USD) | June 25, 2026 $69.0200 +1.53%
🔍 Technical Analysis
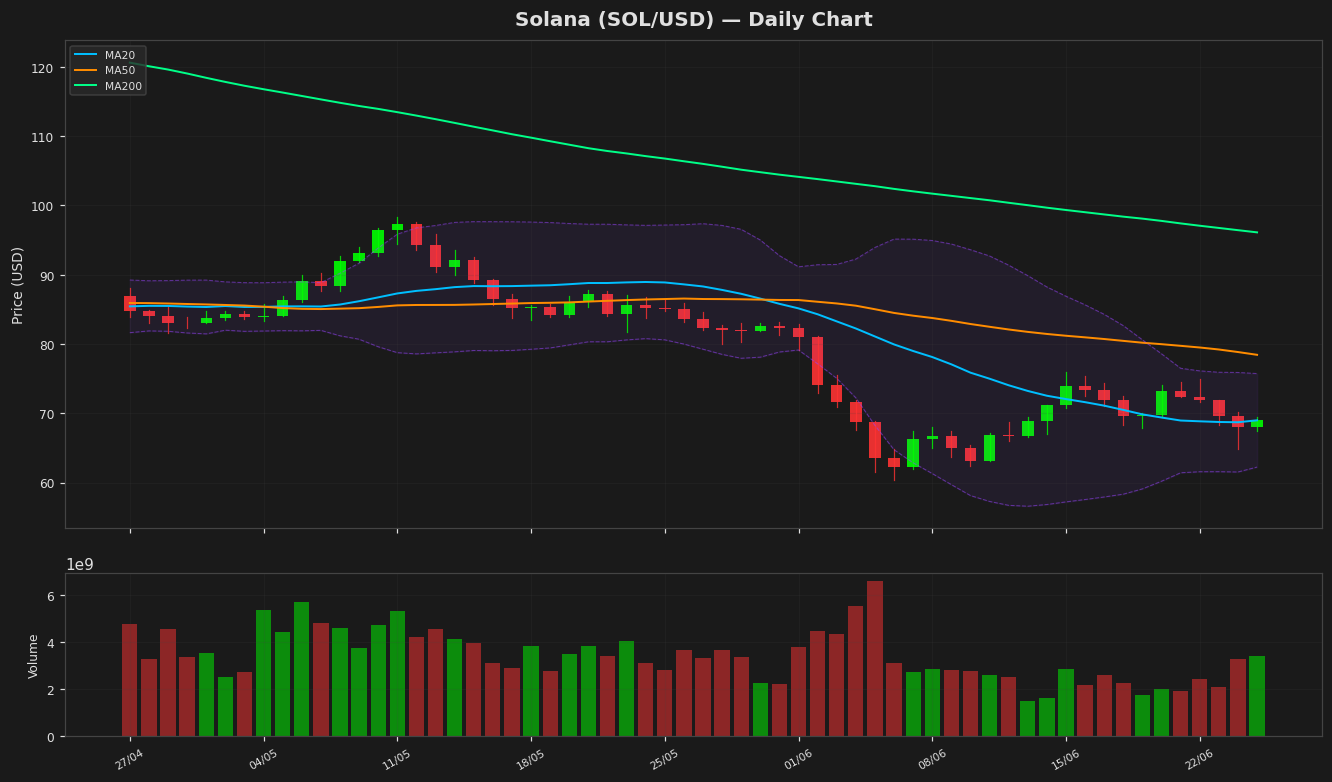
Solana (SOL) is currently trading at $69.01, showing a modest daily gain of 1.53%. The price action remains confined within a tight range, hovering near the 20-day moving average (MA20) at $68.99, indicating a neutral short-term trend. The MA50 at $78.44 and MA200 at $96.11 suggest a bearish medium to long-term outlook, as the price remains below these key levels. Bollinger Bands reveal a narrowing range, with the upper band at $75.73 and the lower band at $62.24, signaling reduced volatility. The price is currently near the middle band, reflecting a lack of strong directional bias. The RSI(14) at 55.13 is neutral, neither overbought nor oversold, while the MACD histogram at -1.81 remains below the signal line (-2.30), indicating lingering bearish momentum. Key support lies at the recent low of $60.41 (52-week low), with immediate resistance at the MA50 ($78.44). A breakout above the MA50 could target the upper Bollinger Band ($75.73), while a breakdown below $62.24 may test the yearly low. The ATR(14) at 3.46 suggests subdued price movement, reinforcing the consolidation phase. Overall, Solana remains in a cautious equilibrium, awaiting a decisive catalyst for directional momentum.
Technical Metrics
| Metric | Value |
|---|---|
| Current Price | $69.0200 |
| Daily Change | +1.53% |
| MA 20 | $68.9923 |
| % from MA20 | +0.04% |
| MA 50 | $78.4449 |
| % from MA50 | -12.01% |
| MA 200 | $96.1166 |
| % from MA200 | -28.19% |
| BB Upper | $75.7383 |
| % from BB Upper | -8.87% |
| BB Lower | $62.2462 |
| % from BB Lower | +10.88% |
| RSI (14) | 55.13 |
| MACD | -1.819992 |
| MACD Signal | -2.308487 |
| ATR (14) | 3.466164 |
| 3-Day High | $71.9220 |
| 3-Day Low | $64.8310 |
| 52-Week High | $205.0201 |
| % from 52W High | -66.34% |
| 52-Week Low | $60.4147 |
| % from 52W Low | +14.24% |
| YTD High | $148.2160 |
| % from YTD High | -53.43% |
| YTD Low | $60.4147 |
| % from YTD Low | +14.24% |
📊 Market Commentary
**Solana (SOL) Market Commentary**
Solana (SOL) is trading at $69.02, up 1.53% today, showing mild bullish momentum amid mixed market sentiment. The Relative Strength Index (RSI) at 55.1 suggests SOL is neither overbought nor oversold, indicating balanced short-term trading conditions. Over the past 52 weeks, SOL has ranged between $60.41 and $205.02, reflecting significant volatility but currently holding above the lower end of that range.
Market sentiment around Solana remains cautiously optimistic, supported by its strong ecosystem growth, particularly in decentralized applications (dApps) and decentralized finance (DeFi). However, traders are closely monitoring network performance and broader macroeconomic factors, including Bitcoin’s price action, which often influences altcoin trends.
Key resistance levels to watch include $75, a psychological and technical barrier, followed by $80, where previous rejections have occurred. On the downside, immediate support lies near $65, with stronger demand expected around $60, the yearly low. A break below $60 could trigger further bearish pressure, while sustained trading above $70 may signal renewed bullish interest.
Traders are also observing Solana’s on-chain metrics, including transaction volume and active addresses, for signs of network strength or weakness. Given the current RSI neutrality, SOL may consolidate in the near term unless a clear catalyst drives momentum. Risk management remains crucial as volatility persists in the broader crypto market.
Disclaimer
The content on MarketsFN.com is provided for educational and informational purposes only. It does not constitute financial advice or investment recommendations. All investments involve risk. Cryptocurrency markets are highly volatile. Past performance does not guarantee future results.