S&P 500 Bull & Bear Radar — July 02, 2026
· Stocks · QuoteReporter
S&P 500 Bull & Bear Radar — July 02, 2026
A daily technical sweep of 495 S&P 500 constituents ranked by session performance, enriched with RSI, MA20/MA50/MA200 trend signals, Bloomberg-style charts, and recent news.
Index-Wide Breadth
| Constituents tracked | 495 |
| Advancing | 357 (72.1%) |
| Declining | 136 (27.5%) |
| Average daily change | +0.67% |
| Above MA200 | 9 (1.8%) |
Top 10 Gainers
Today's strongest S&P 500 performers. Sector leadership: Healthcare (5), Technology (3), Financial (1), Industrials (1).
| Ticker | Company | Sector | Price | Day % | 1W % | 1M % | RSI | vs MA200 | Trend |
|---|---|---|---|---|---|---|---|---|---|
| MRNA | Moderna Inc | Healthcare | $80.44 | +10.95% | +34.54% | +76.14% | 81.0 | +95.6% | Above MA20, MA50, MA200 |
| COIN | Coinbase Global Inc | Financial | $170.94 | +7.35% | +19.87% | -1.81% | 53.7 | -26.0% | Above MA20 · Below MA50, MA200 |
| UHS | Universal Health Services, Inc | Healthcare | $157.77 | +4.77% | +9.21% | +10.68% | 62.8 | -19.5% | Above MA20, MA50 · Below MA200 |
| PLTR | Palantir Technologies Inc | Technology | $131.33 | +4.45% | +22.18% | -13.87% | 53.0 | -16.8% | Above MA20 · Below MA50, MA200 |
| NOC | Northrop Grumman Corp | Industrials | $541.81 | +4.20% | +8.41% | +0.88% | 53.5 | -11.6% | Above MA20 · Below MA50, MA200 |
| XYZ | Block Inc | Technology | $80.36 | +4.19% | +8.42% | +8.31% | 63.4 | +19.3% | Above MA20, MA50, MA200 |
| SMCI | Super Micro Computer Inc | Technology | $28.78 | +4.10% | -9.09% | -42.60% | 42.8 | -17.8% | Below MA20, MA50, MA200 |
| HCA | HCA Healthcare Inc | Healthcare | $409.12 | +4.04% | +5.70% | +11.34% | 60.8 | -11.0% | Above MA20, MA50 · Below MA200 |
| INCY | Incyte Corp | Healthcare | $118.11 | +3.78% | +9.81% | +28.01% | 71.6 | +20.6% | Above MA20, MA50, MA200 |
| BAX | Baxter International Inc | Healthcare | $22.49 | +3.69% | +4.34% | +20.37% | 68.5 | +15.0% | Above MA20, MA50, MA200 |
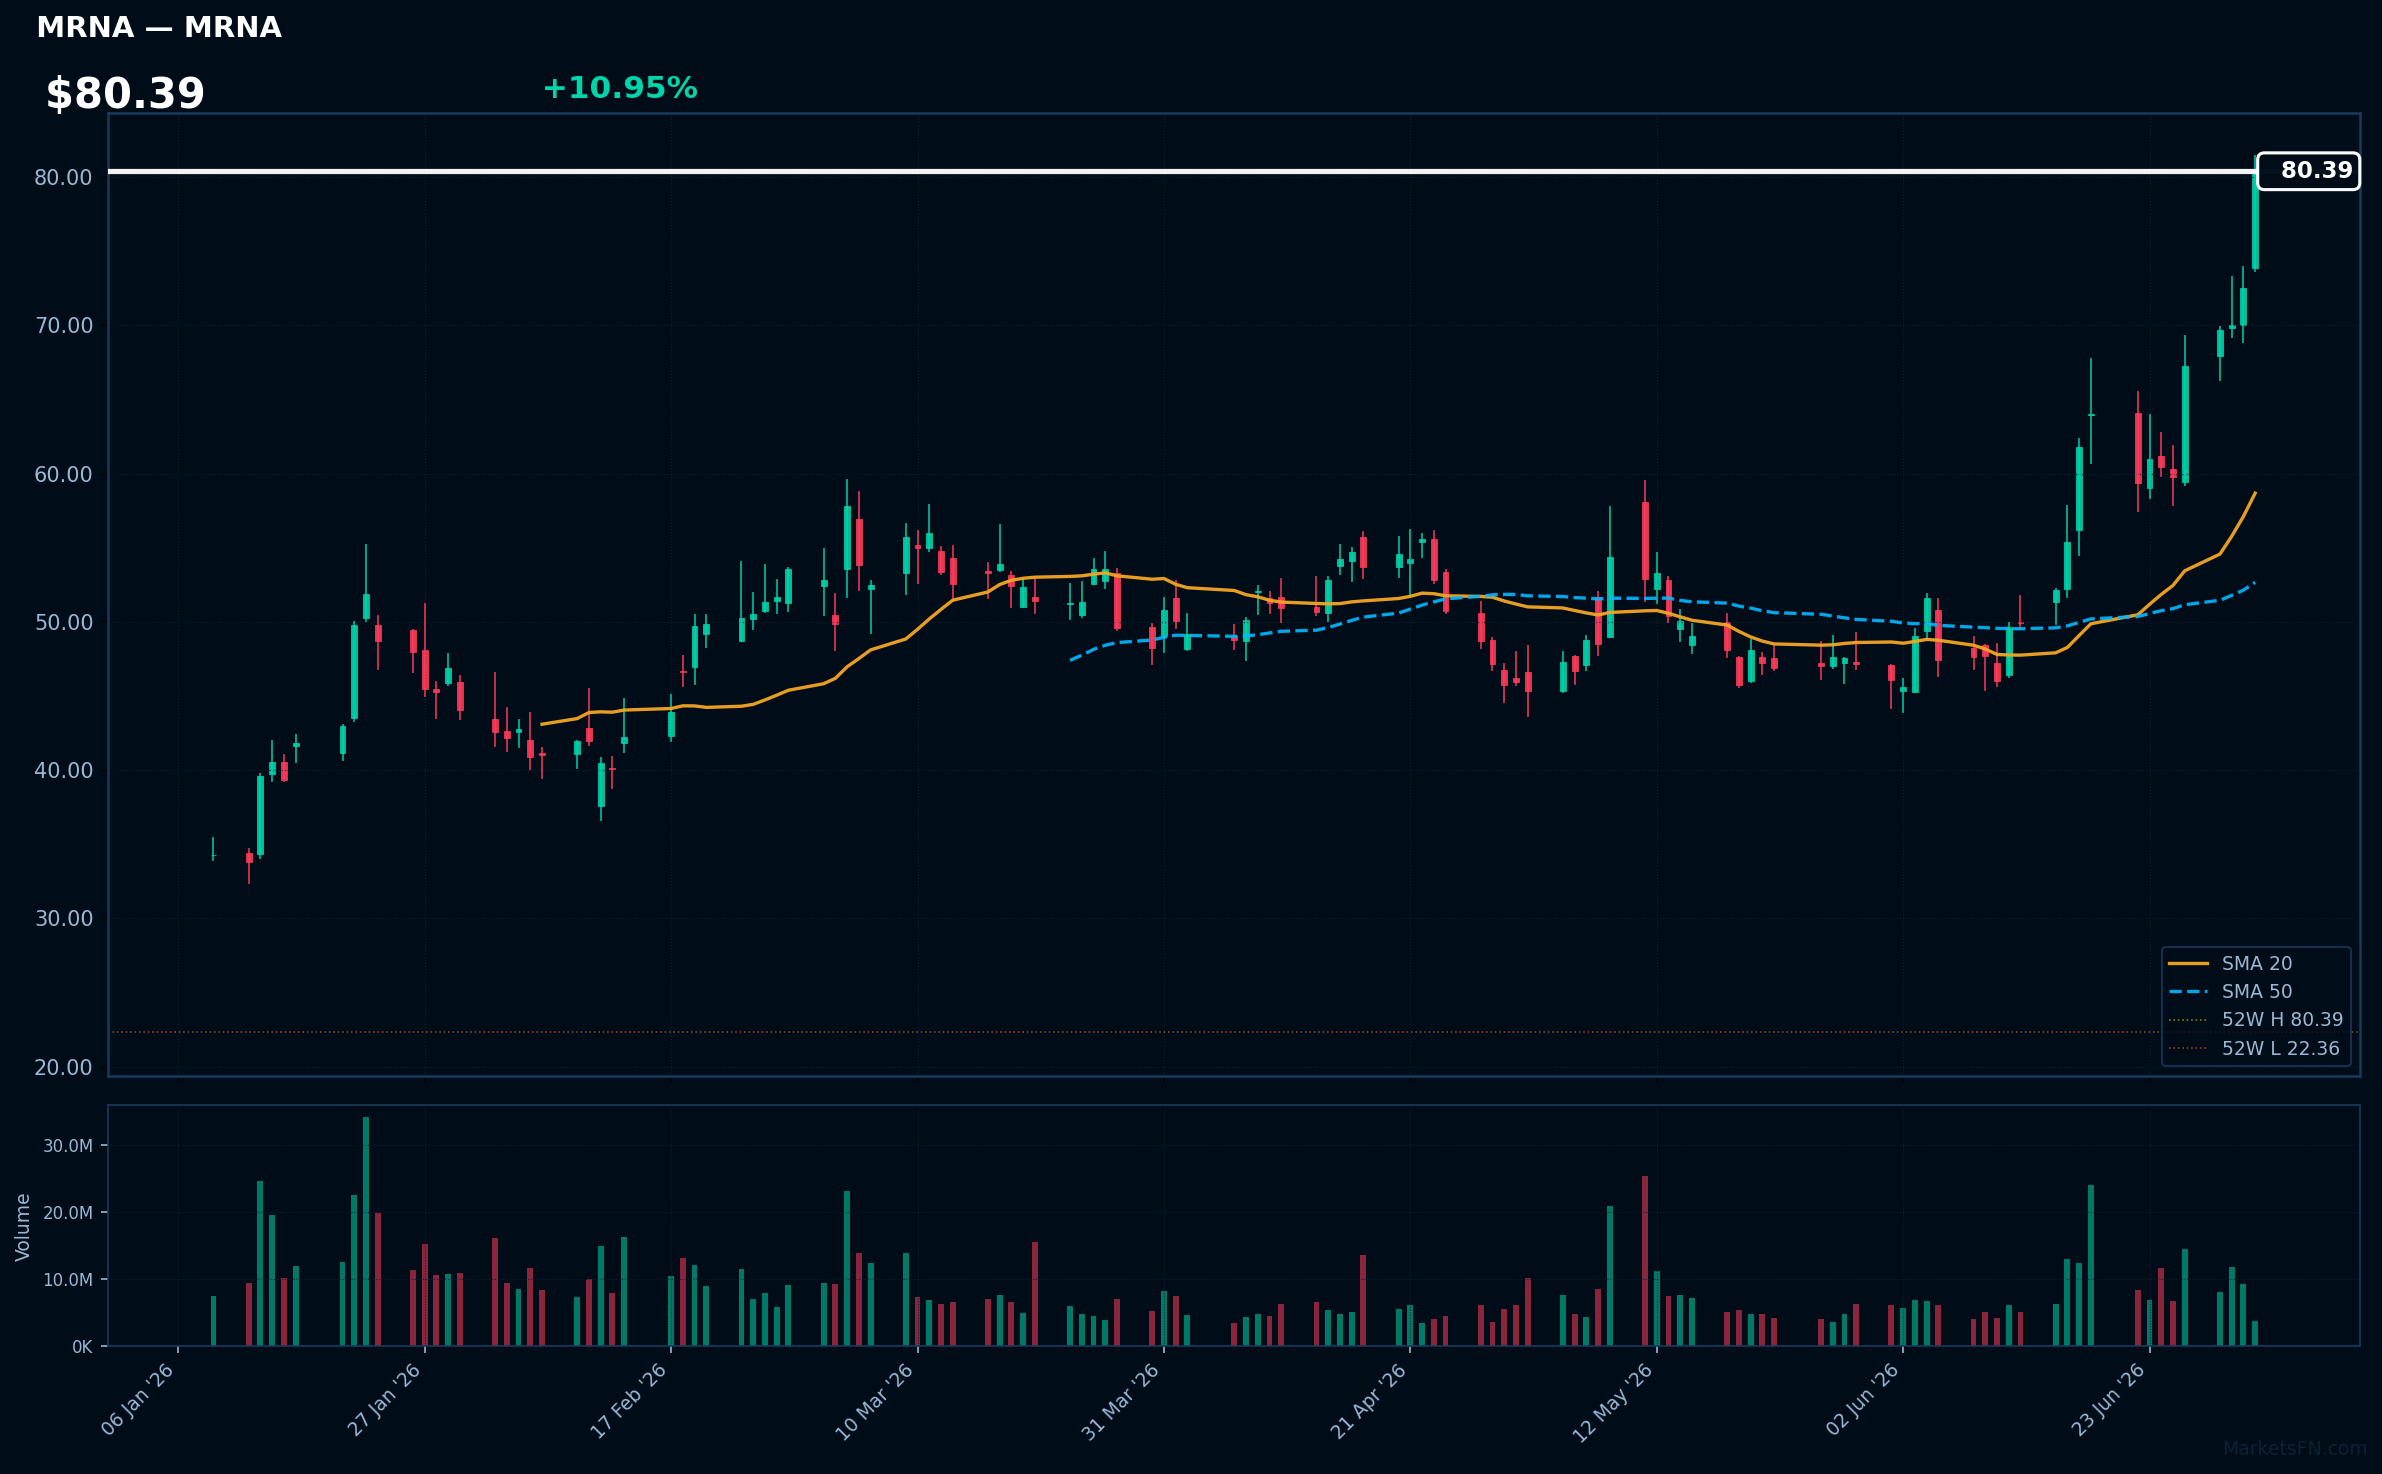
MRNA | Moderna Inc | Healthcare | Price: $80.44 | Day: +10.95% | 1W: +34.54% | 1M: +76.14% | RSI: 81.0 | vs MA200: +95.6% | Trend: Above MA20, MA50, MA200
Recent headlines (last 12h)
- Why Did PANW, AAL, MRNA Surge To 52-Week Highs?
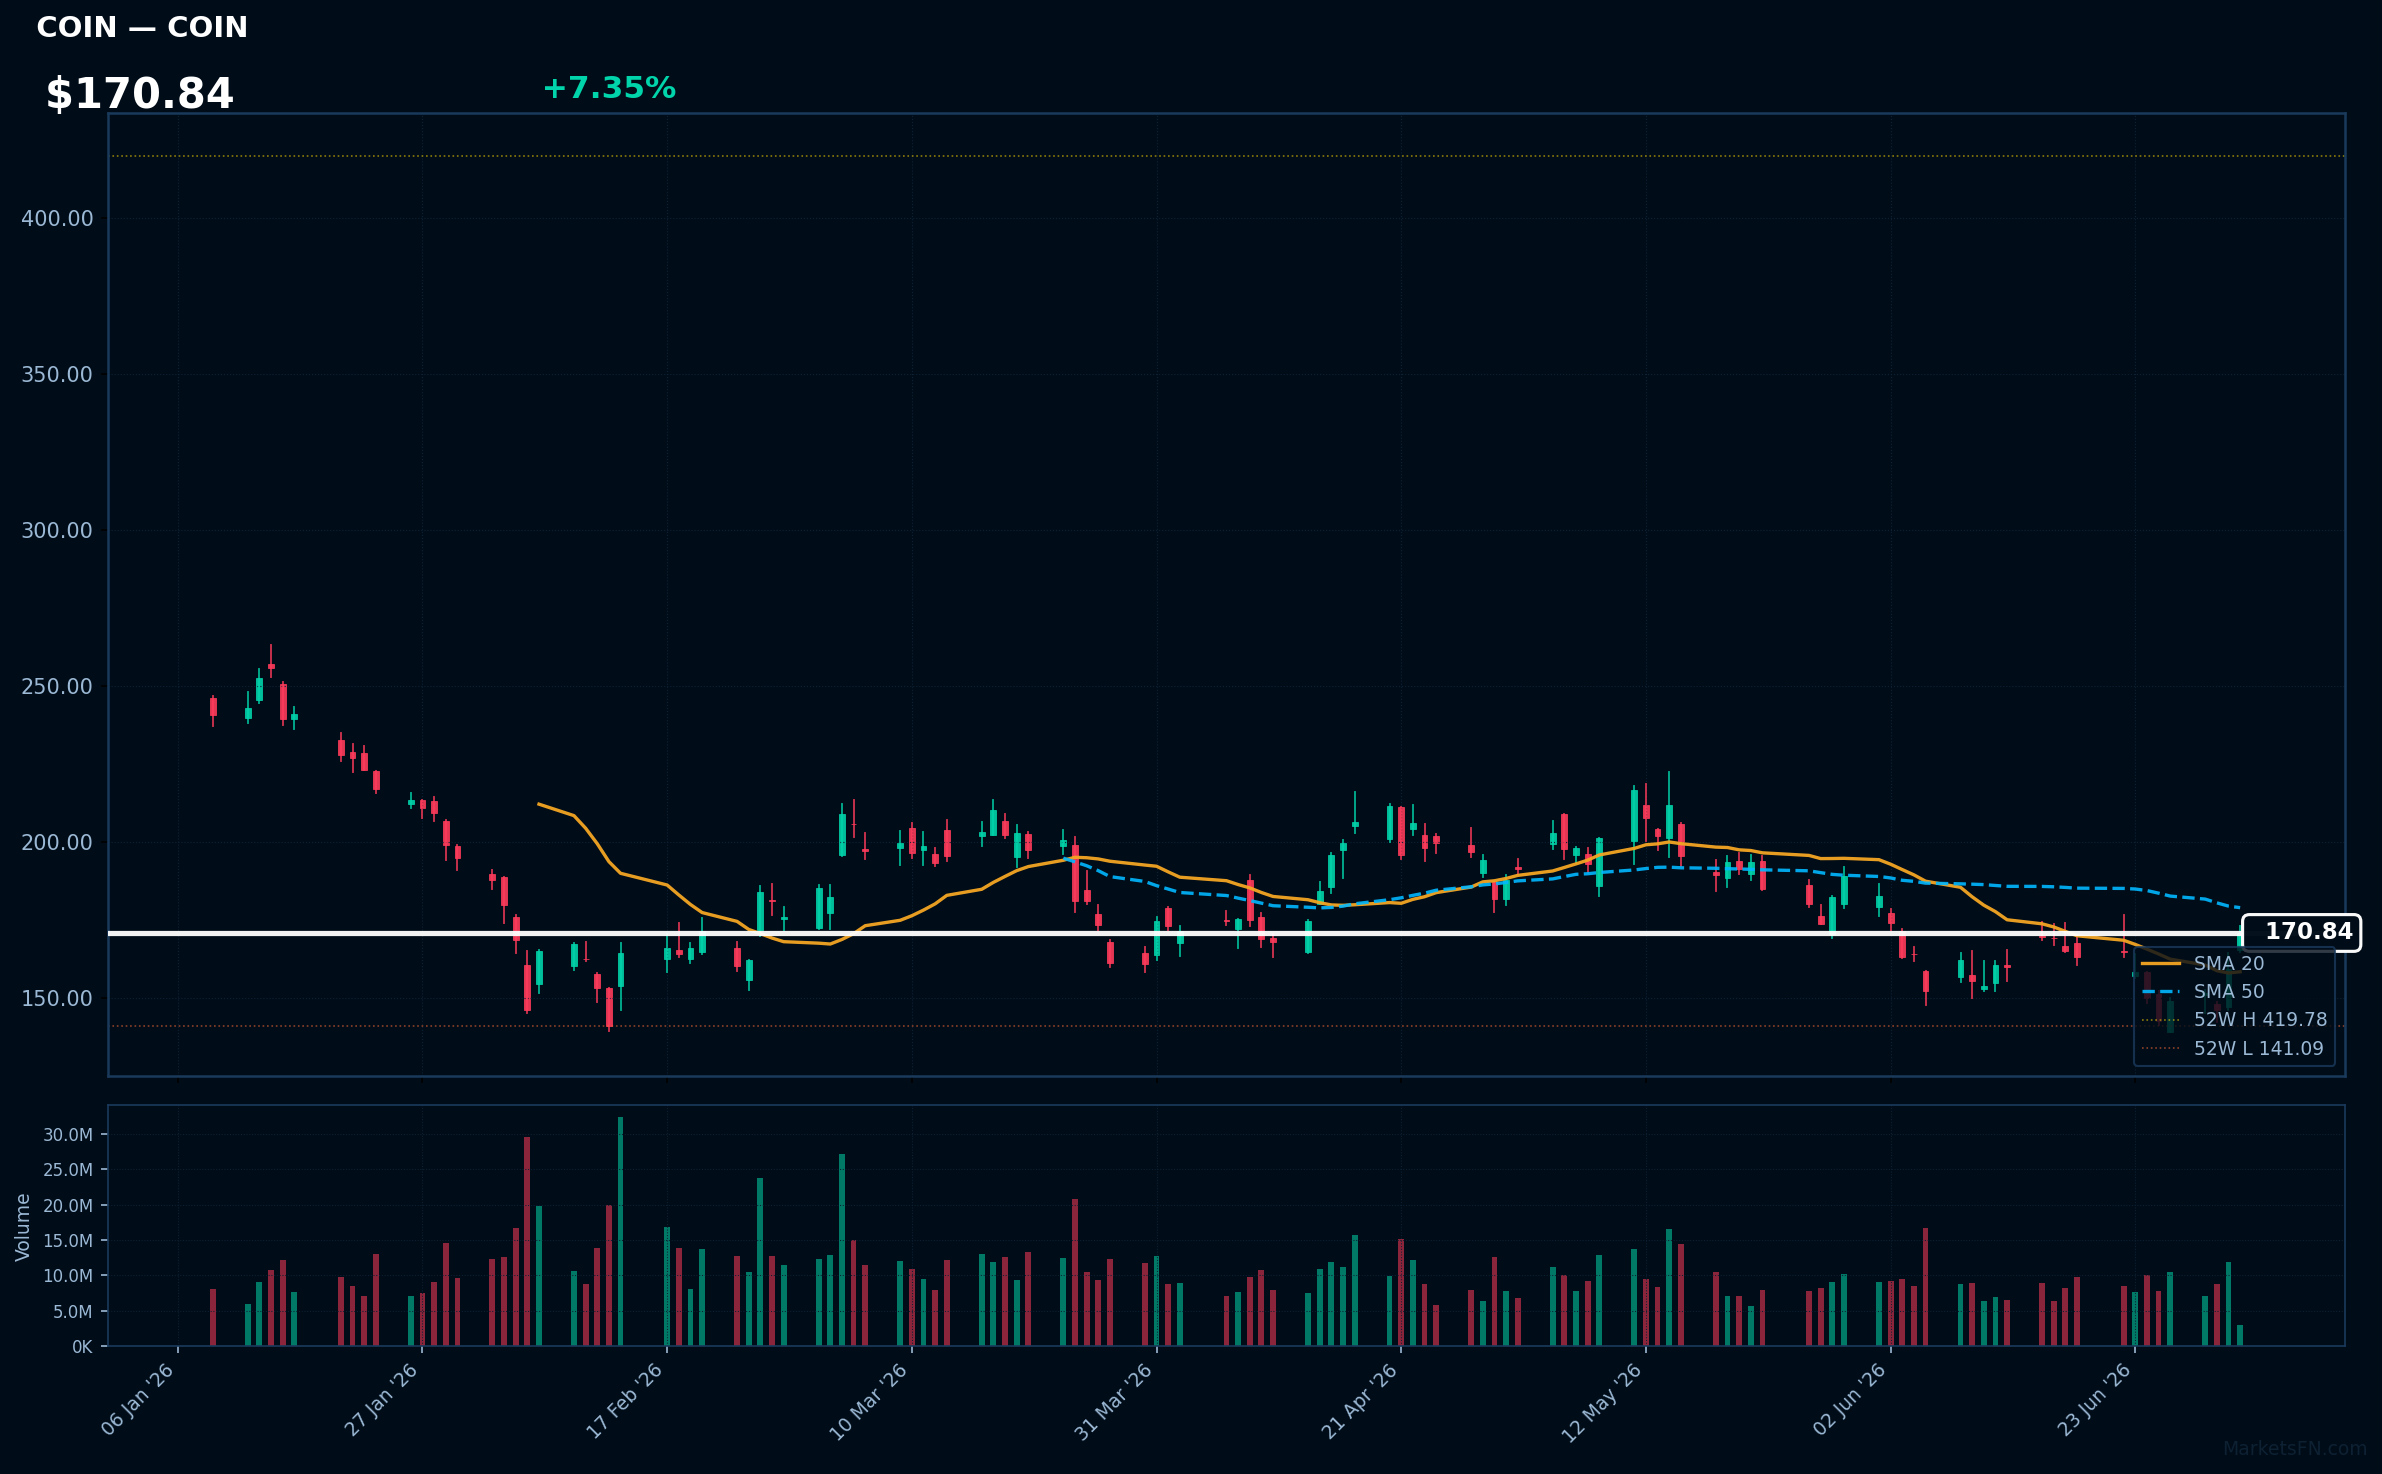
COIN | Coinbase Global Inc | Financial | Price: $170.94 | Day: +7.35% | 1W: +19.87% | 1M: -1.81% | RSI: 53.7 | vs MA200: -26.0% | Trend: Above MA20 · Below MA50, MA200
Recent headlines (last 12h)
- Karp unleashes on frontier AI labs
- Everything You Need to Know About Perps-the Asset Class, Not the Offenders
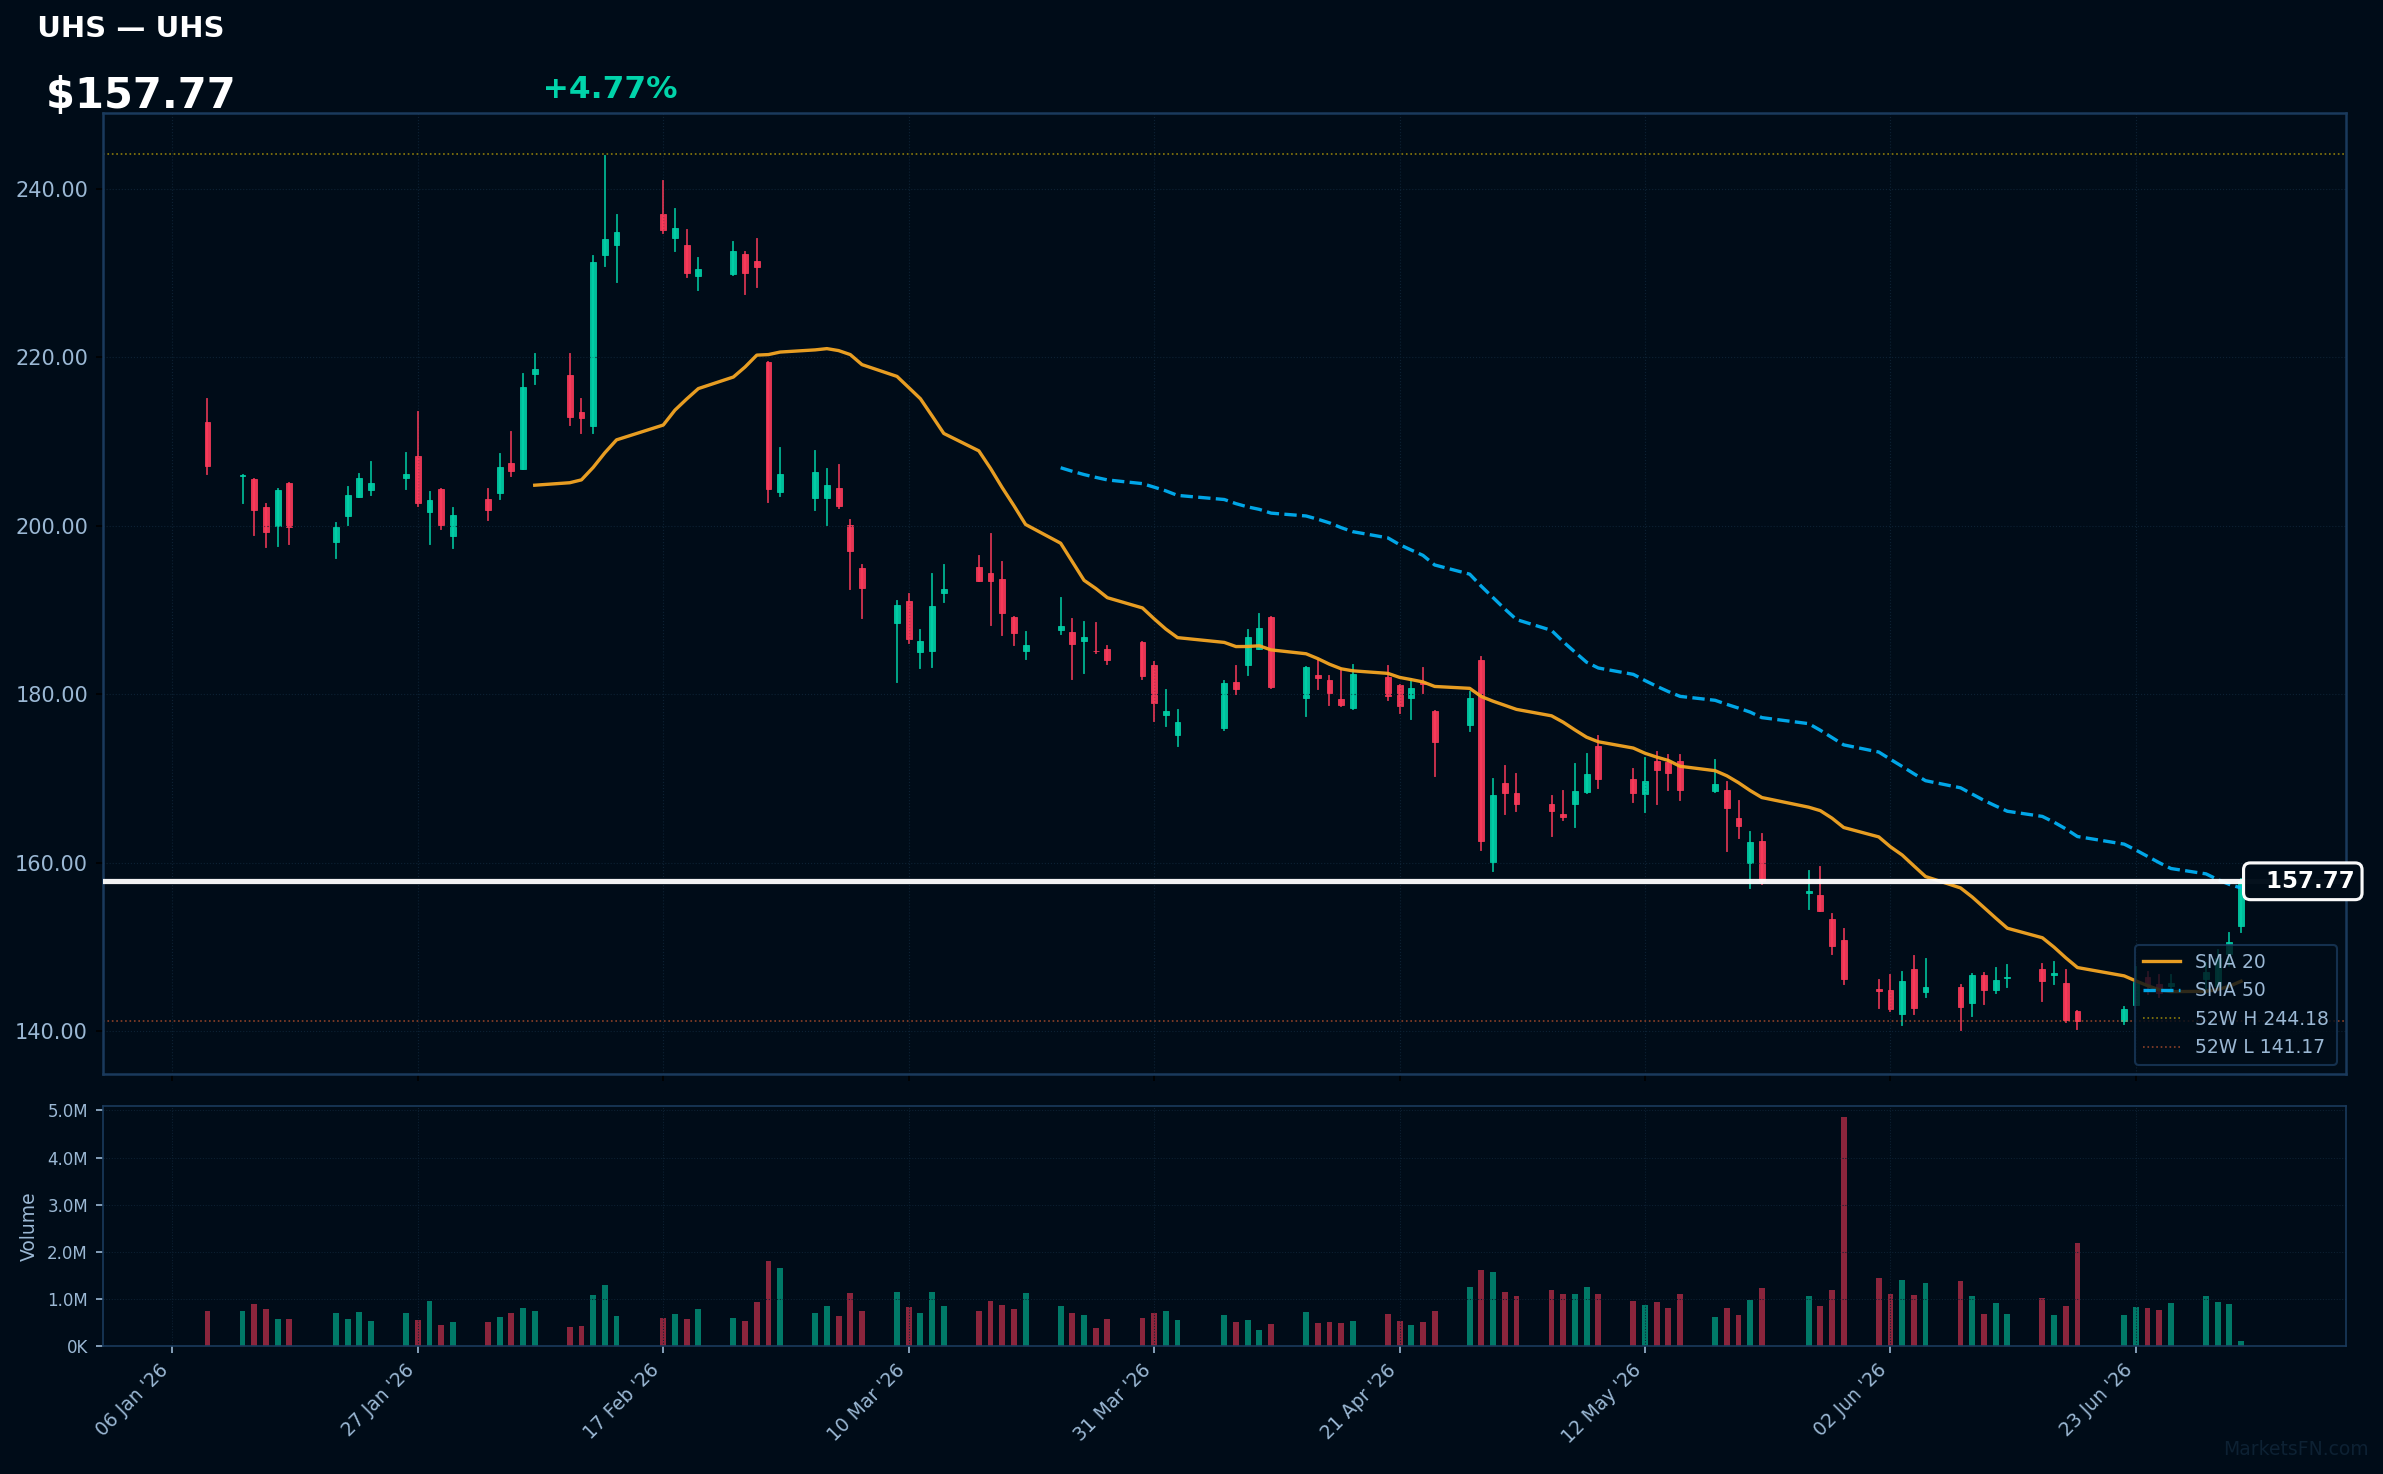
UHS | Universal Health Services, Inc | Healthcare | Price: $157.77 | Day: +4.77% | 1W: +9.21% | 1M: +10.68% | RSI: 62.8 | vs MA200: -19.5% | Trend: Above MA20, MA50 · Below MA200
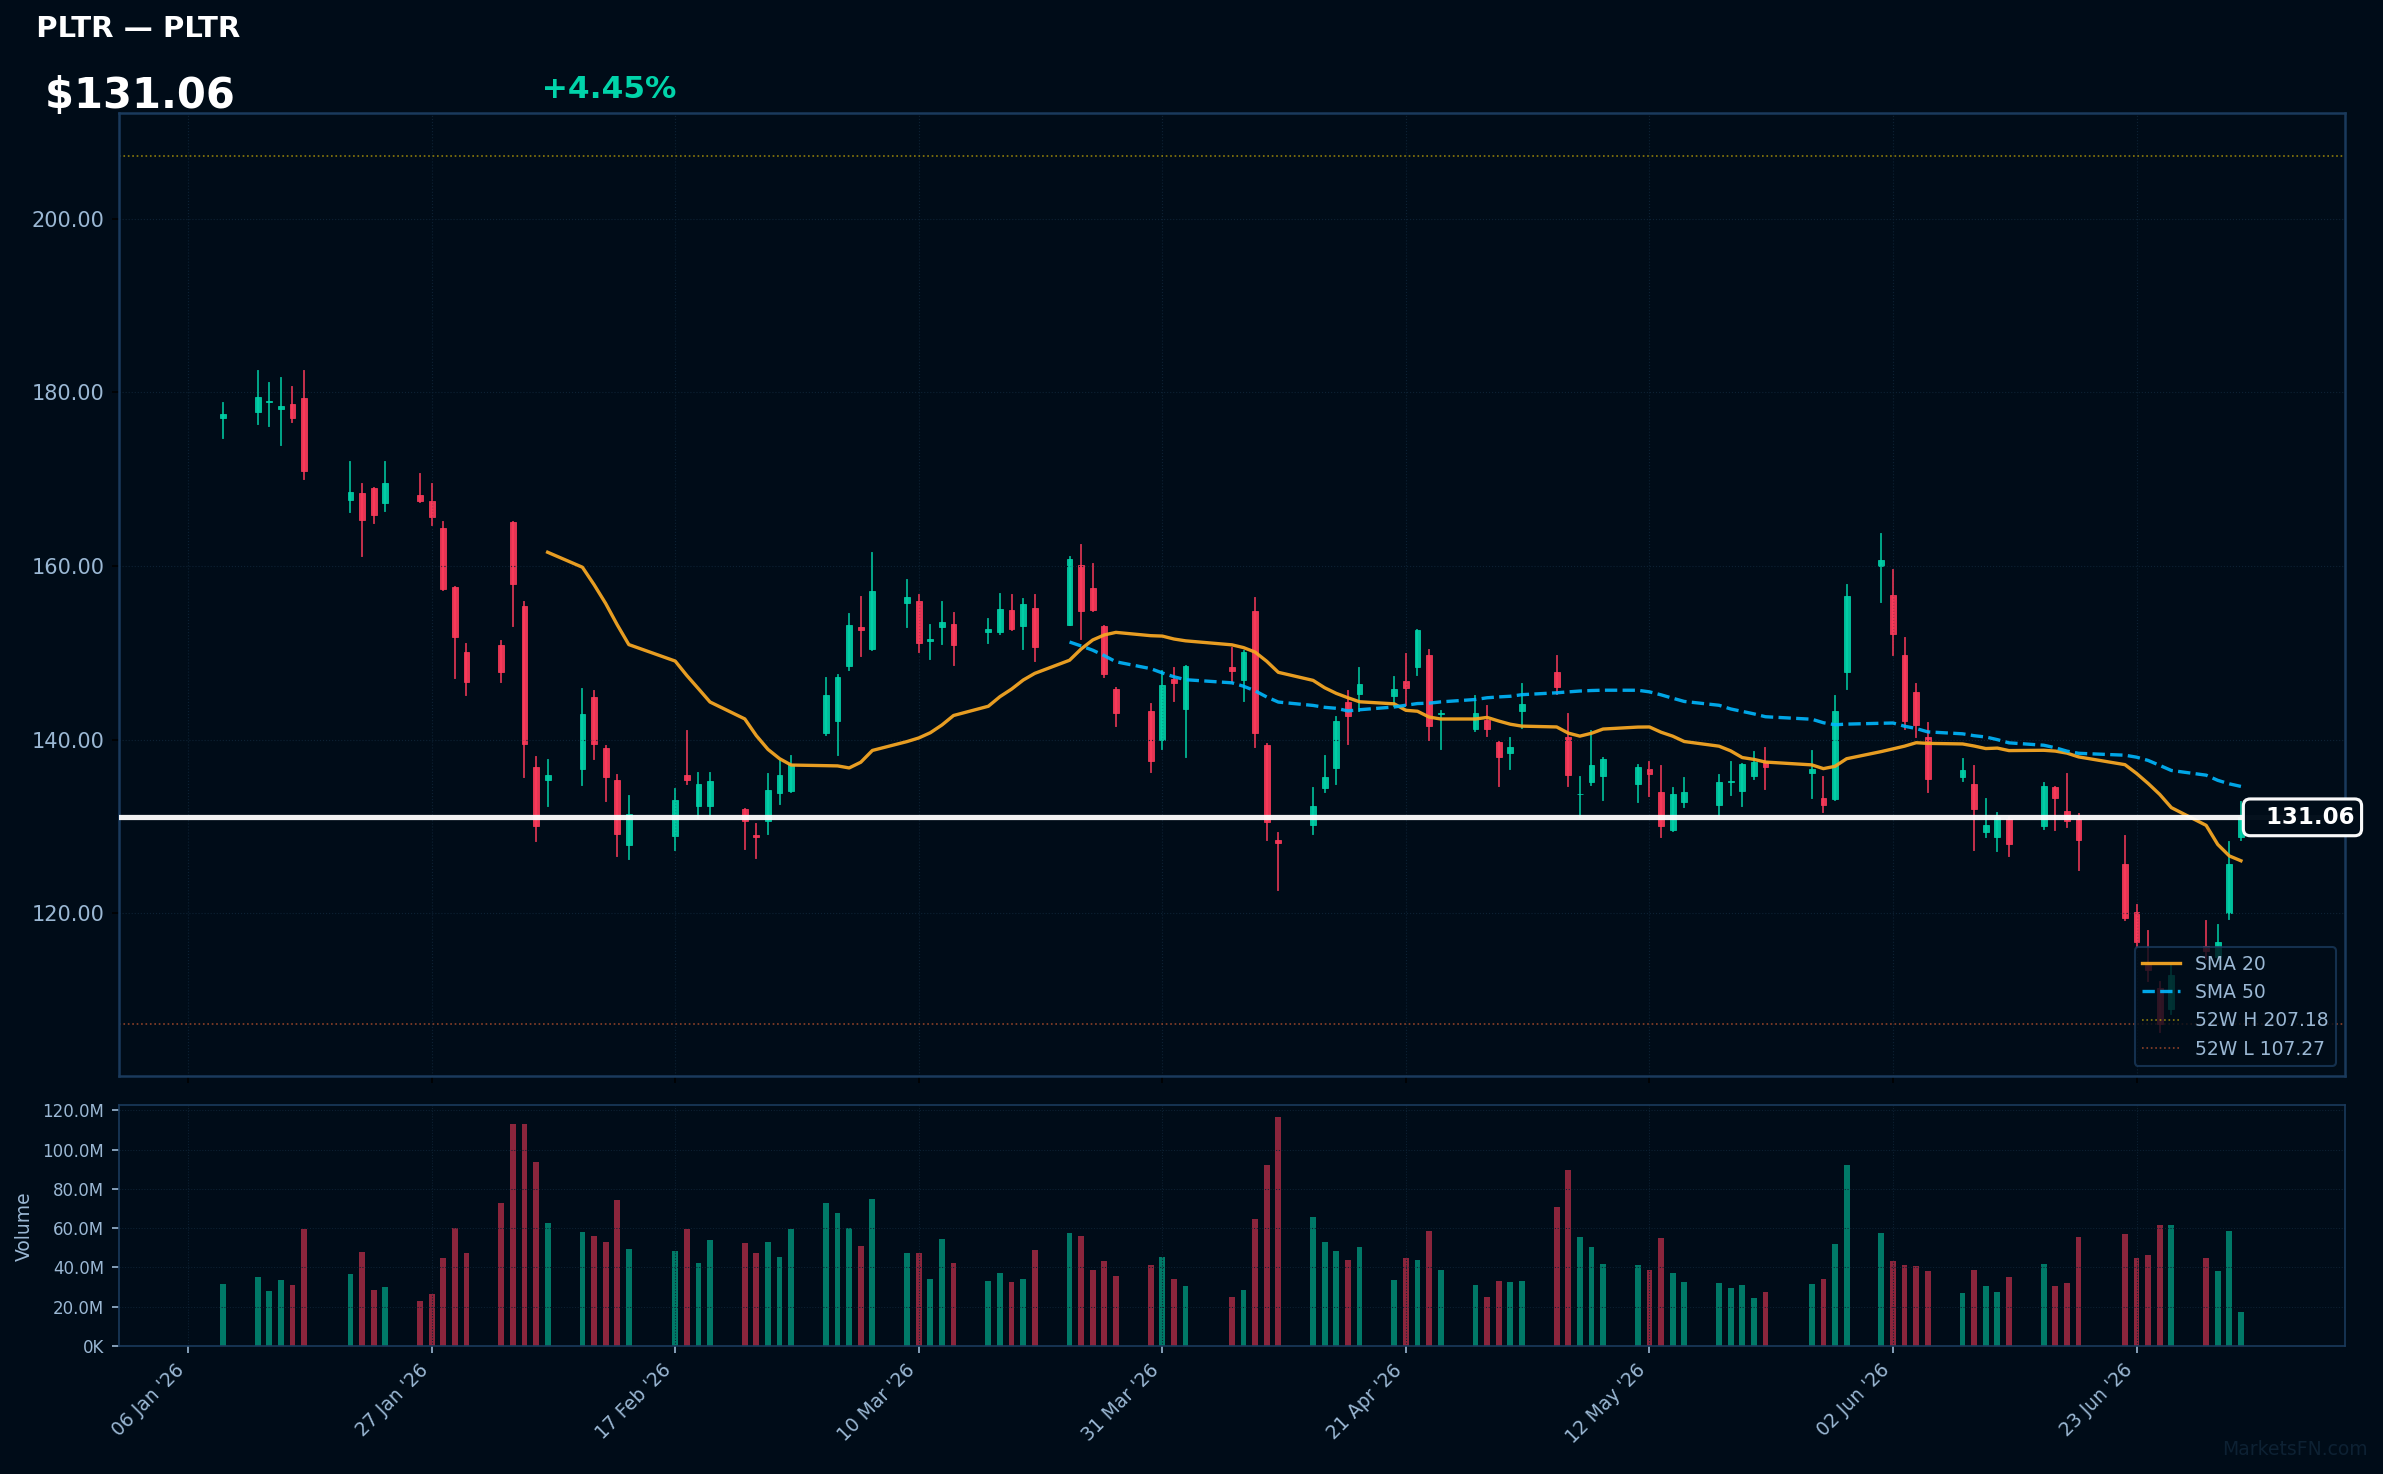
PLTR | Palantir Technologies Inc | Technology | Price: $131.33 | Day: +4.45% | 1W: +22.18% | 1M: -13.87% | RSI: 53.0 | vs MA200: -16.8% | Trend: Above MA20 · Below MA50, MA200
Recent headlines (last 12h)
- Palantir Stock Is Surging Again. A Bullish Upgrade Adds to the Nvidia Momentum.
- Palantir, Chevron upgraded: Wall Street's top analyst calls
- Palantir Stock Upgraded to Buy. Other Software Companies Can't Compete in This AI Era, Say Analysts.
- Three Years of War Changed What Governments Buy. One Player is Already Winning Contracts (NASDAQ: MDWD)
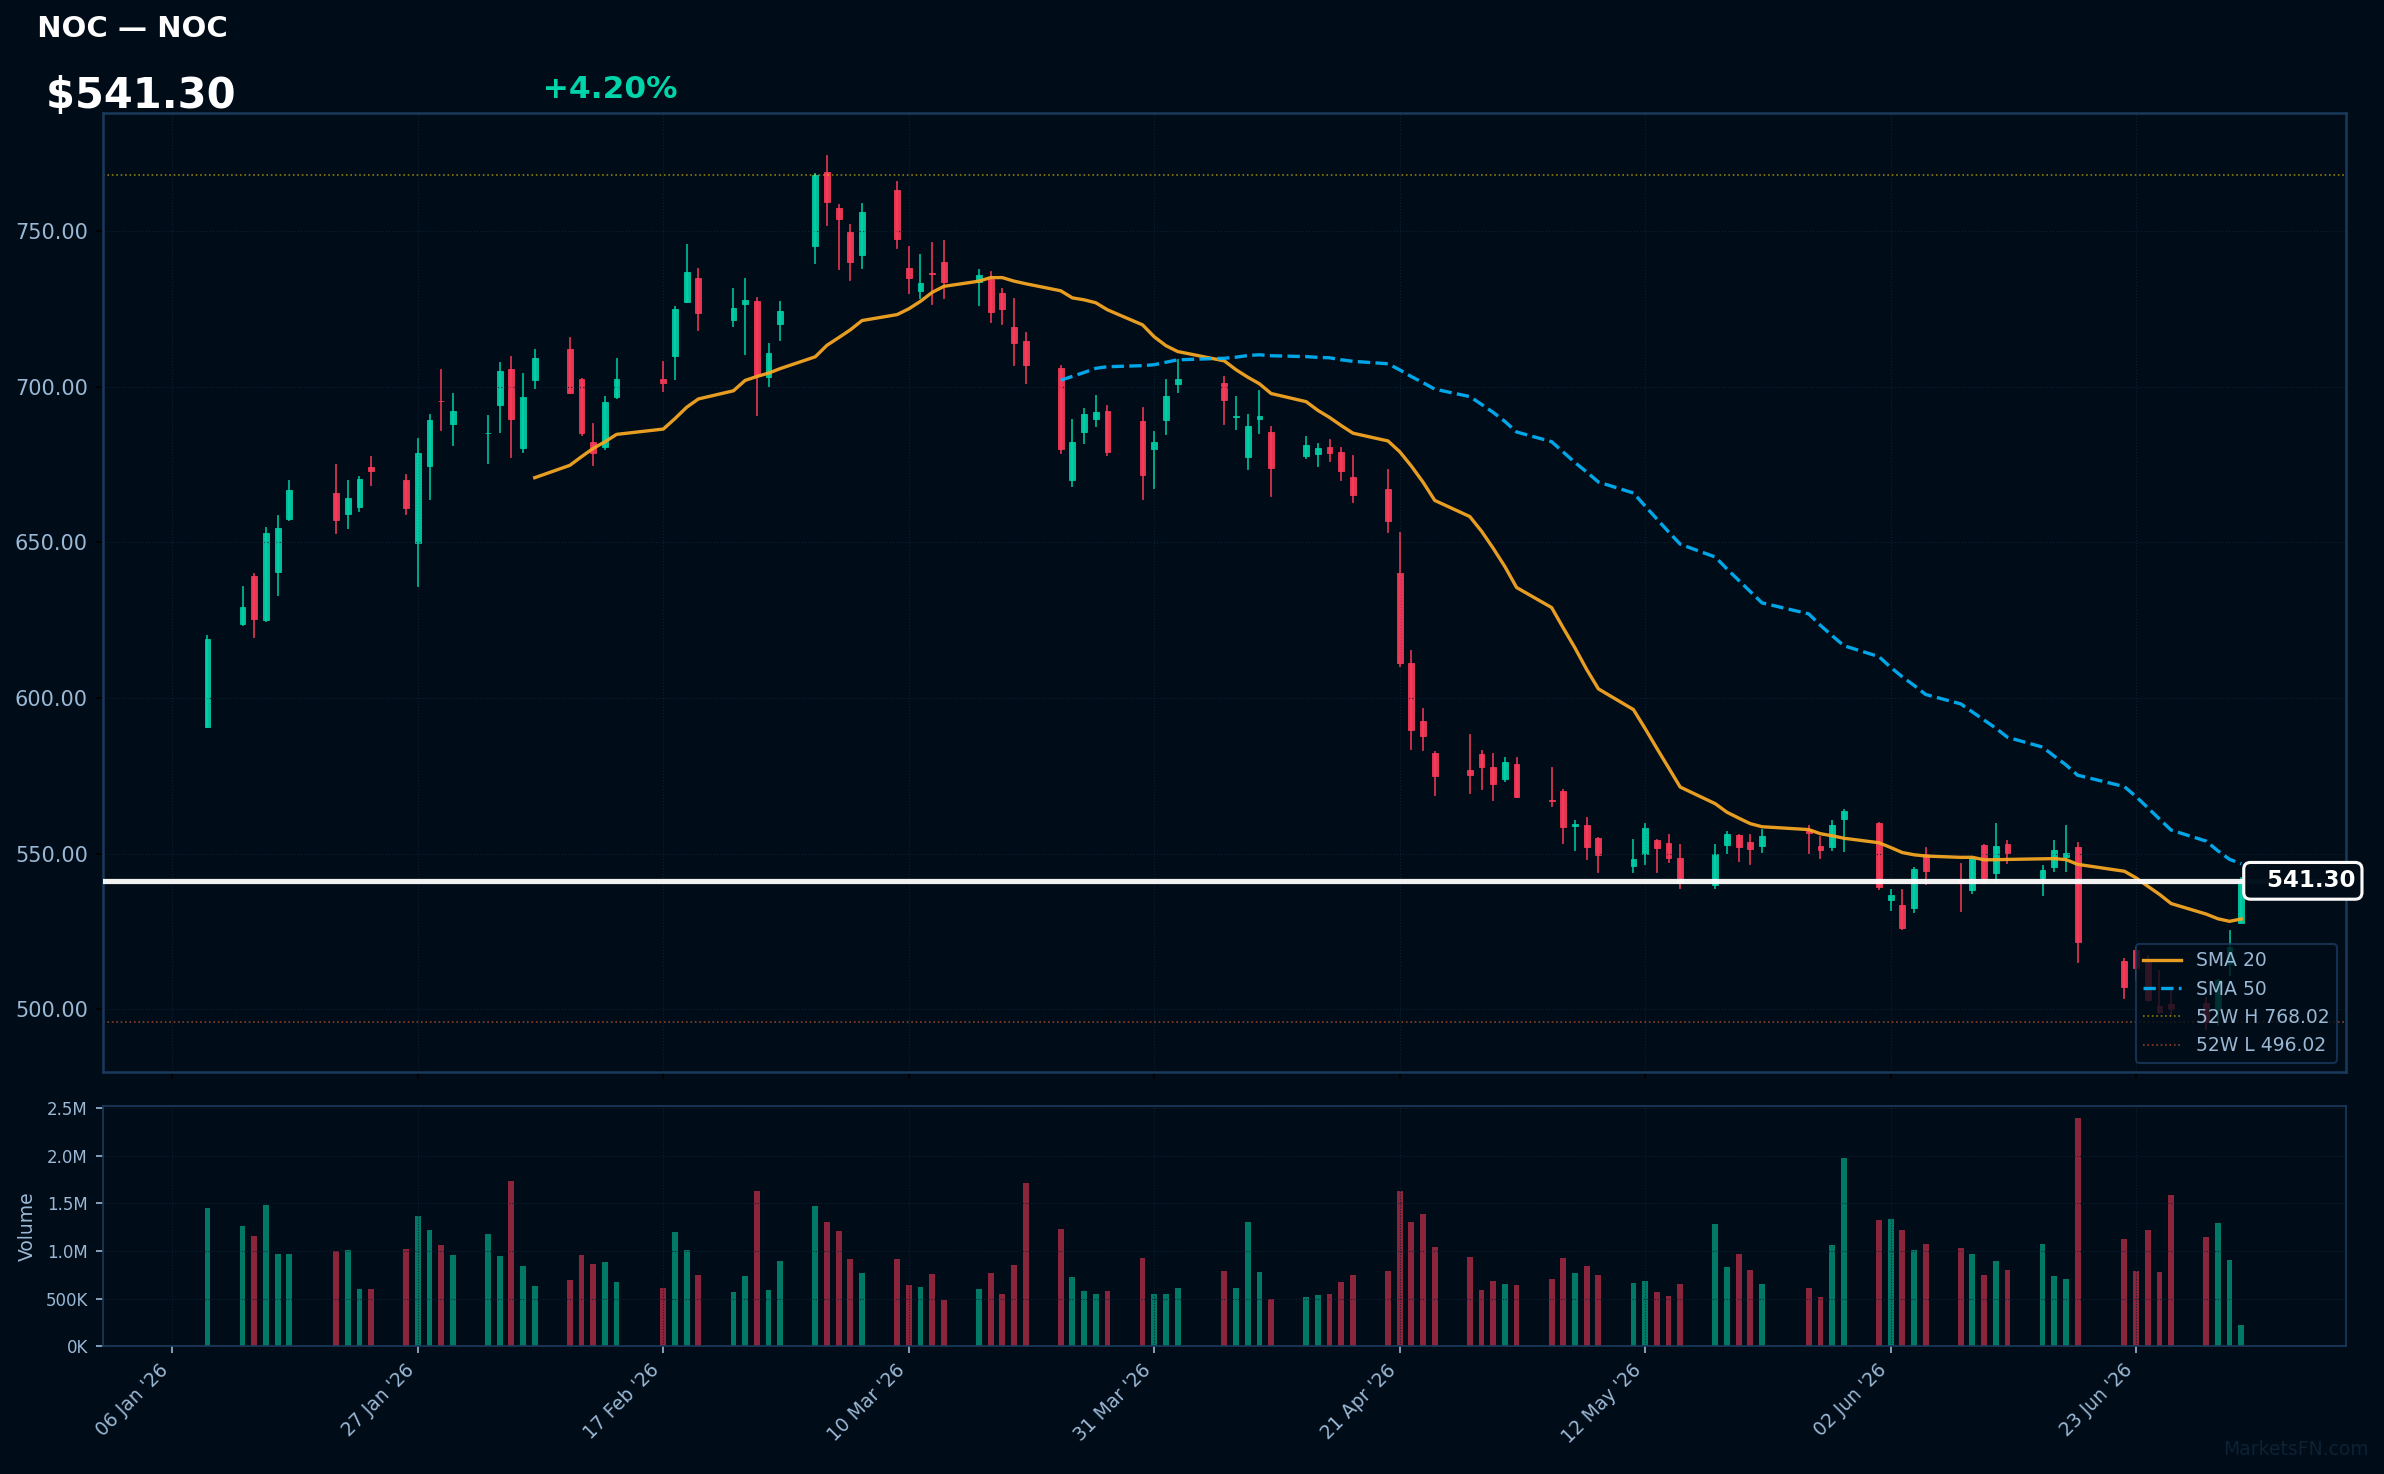
NOC | Northrop Grumman Corp | Industrials | Price: $541.81 | Day: +4.20% | 1W: +8.41% | 1M: +0.88% | RSI: 53.5 | vs MA200: -11.6% | Trend: Above MA20 · Below MA50, MA200
Recent headlines (last 12h)
- Rocket Lab Stock Offers A Different Orbit
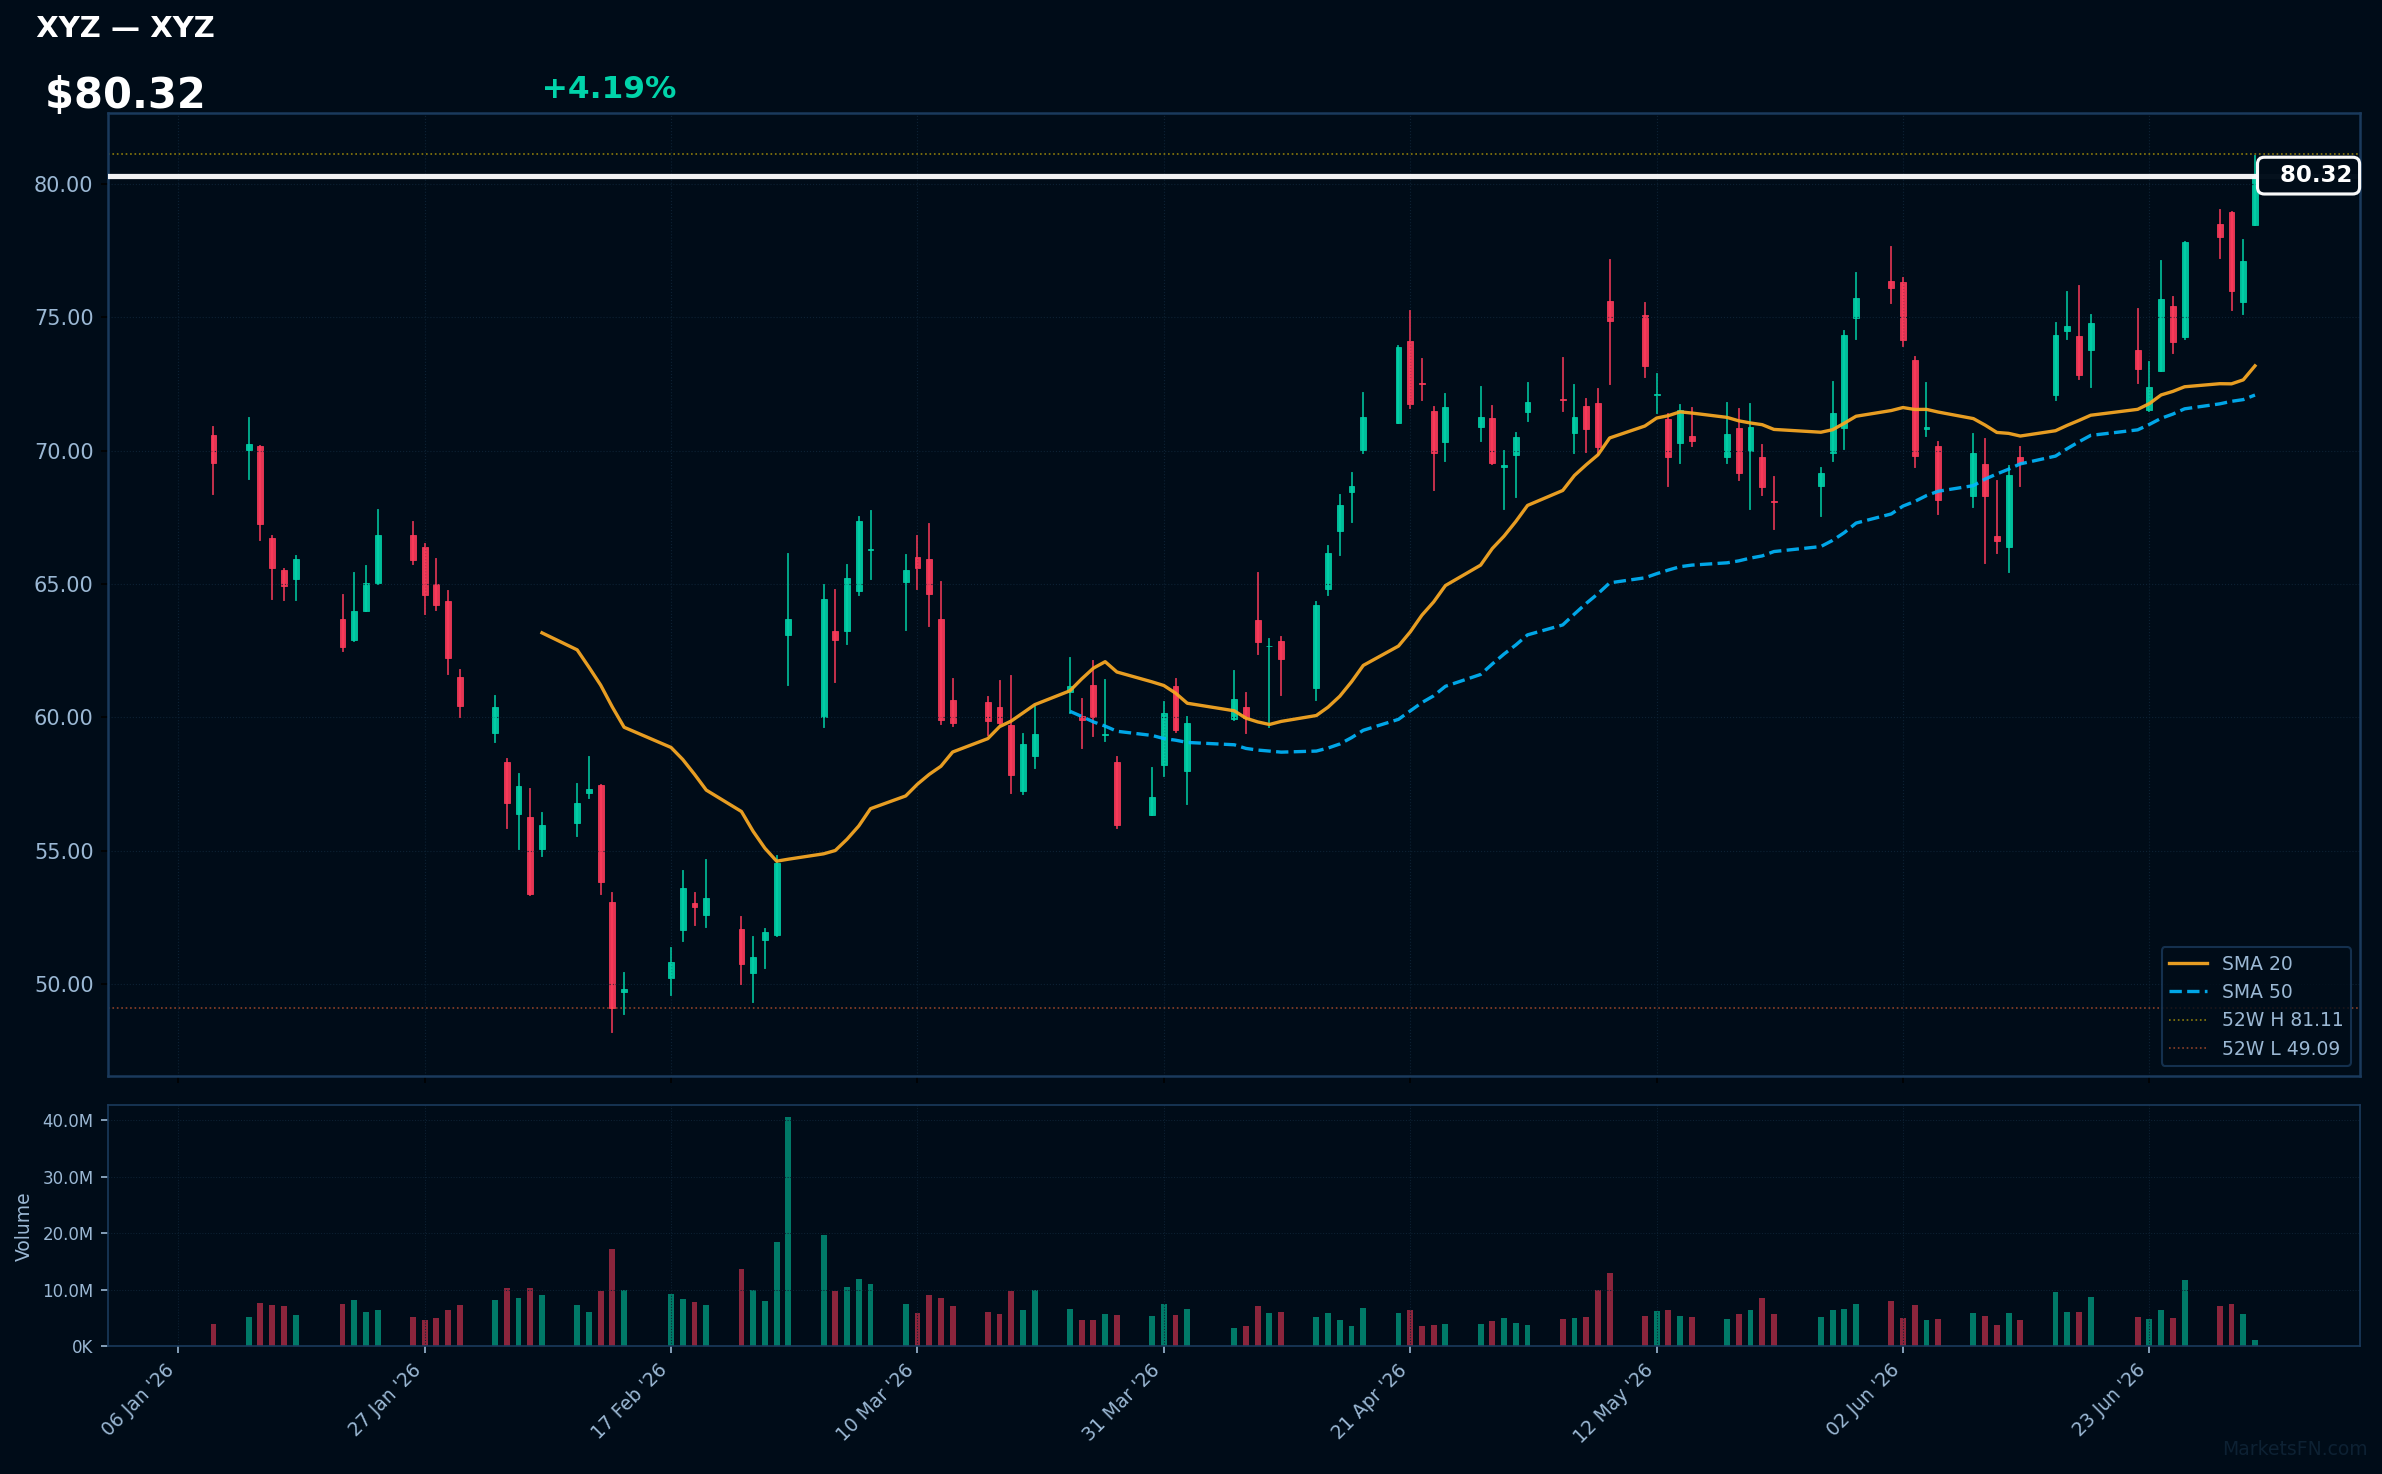
XYZ | Block Inc | Technology | Price: $80.36 | Day: +4.19% | 1W: +8.42% | 1M: +8.31% | RSI: 63.4 | vs MA200: +19.3% | Trend: Above MA20, MA50, MA200
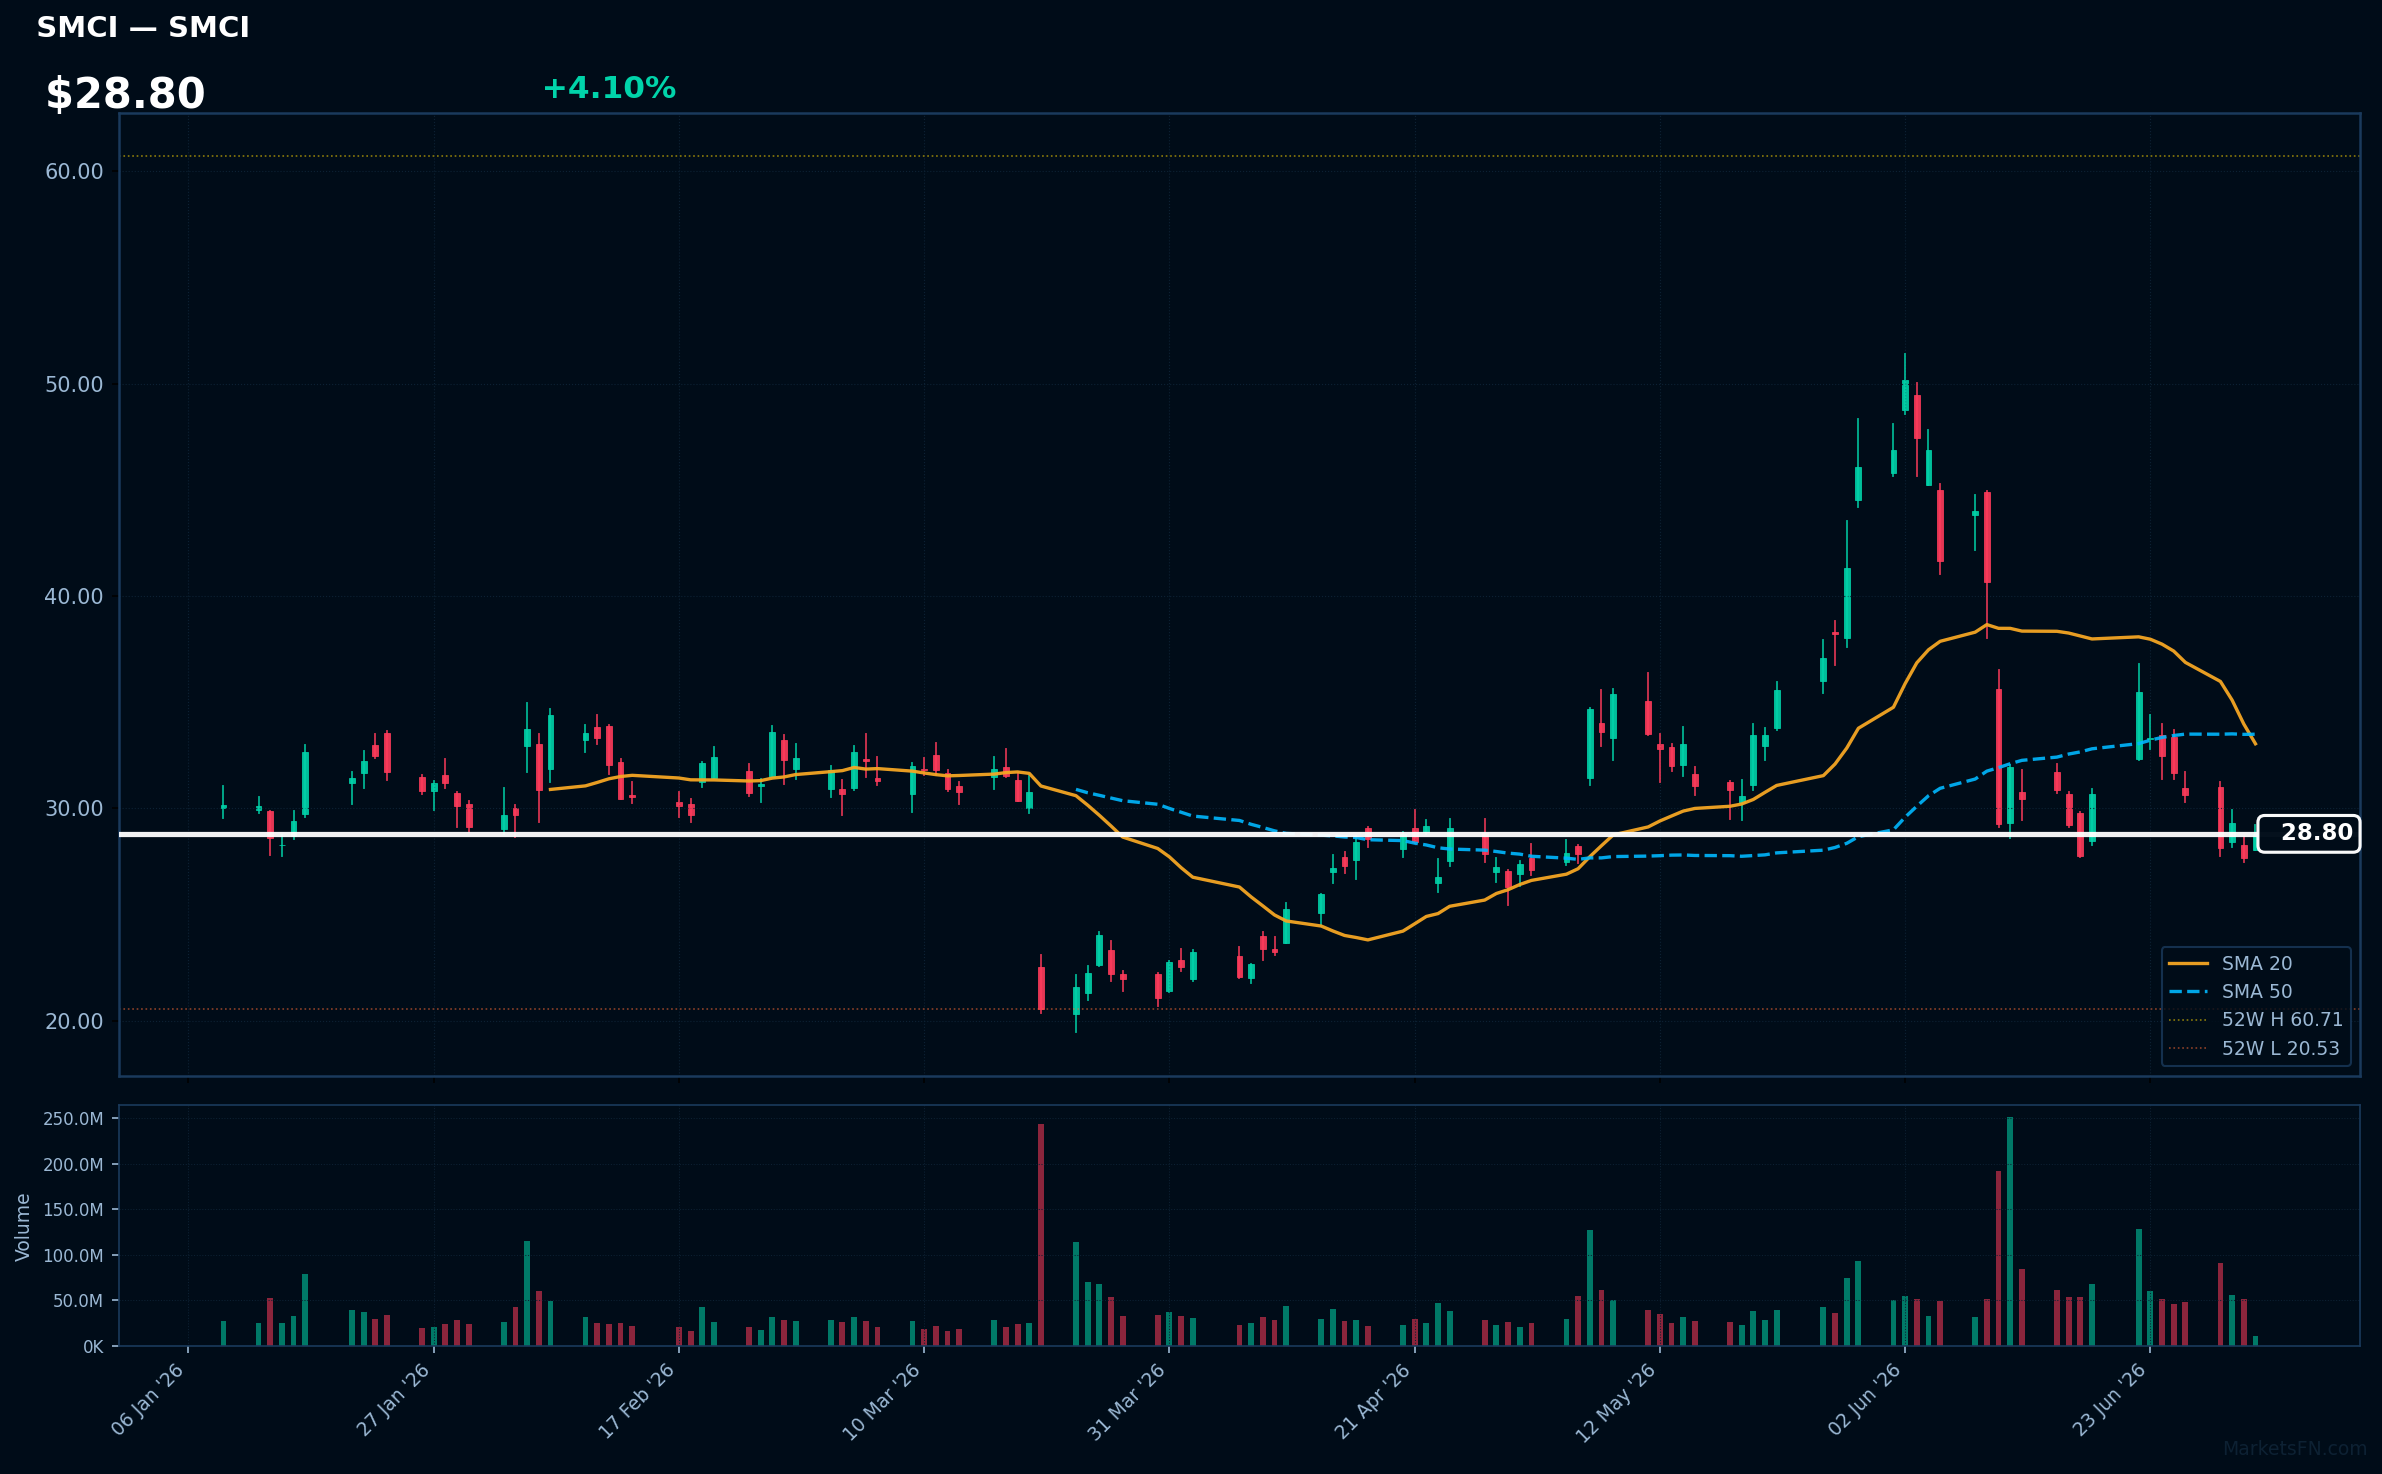
SMCI | Super Micro Computer Inc | Technology | Price: $28.78 | Day: +4.10% | 1W: -9.09% | 1M: -42.60% | RSI: 42.8 | vs MA200: -17.8% | Trend: Below MA20, MA50, MA200
Recent headlines (last 12h)
- AI server probe pulls back the curtain on the evolving journey of Taiwan's motherboard industry
- What Super Micro Said About Chip Smuggling Inquiry That's Lifting the Stock
- Super Micro Tries to Reassure on Taiwan Probe but Markets Aren't Convinced
- SMCI Stock Rises Premarket: Four Taiwan Staff Detained In Illegal Nvidia Chip Export Case
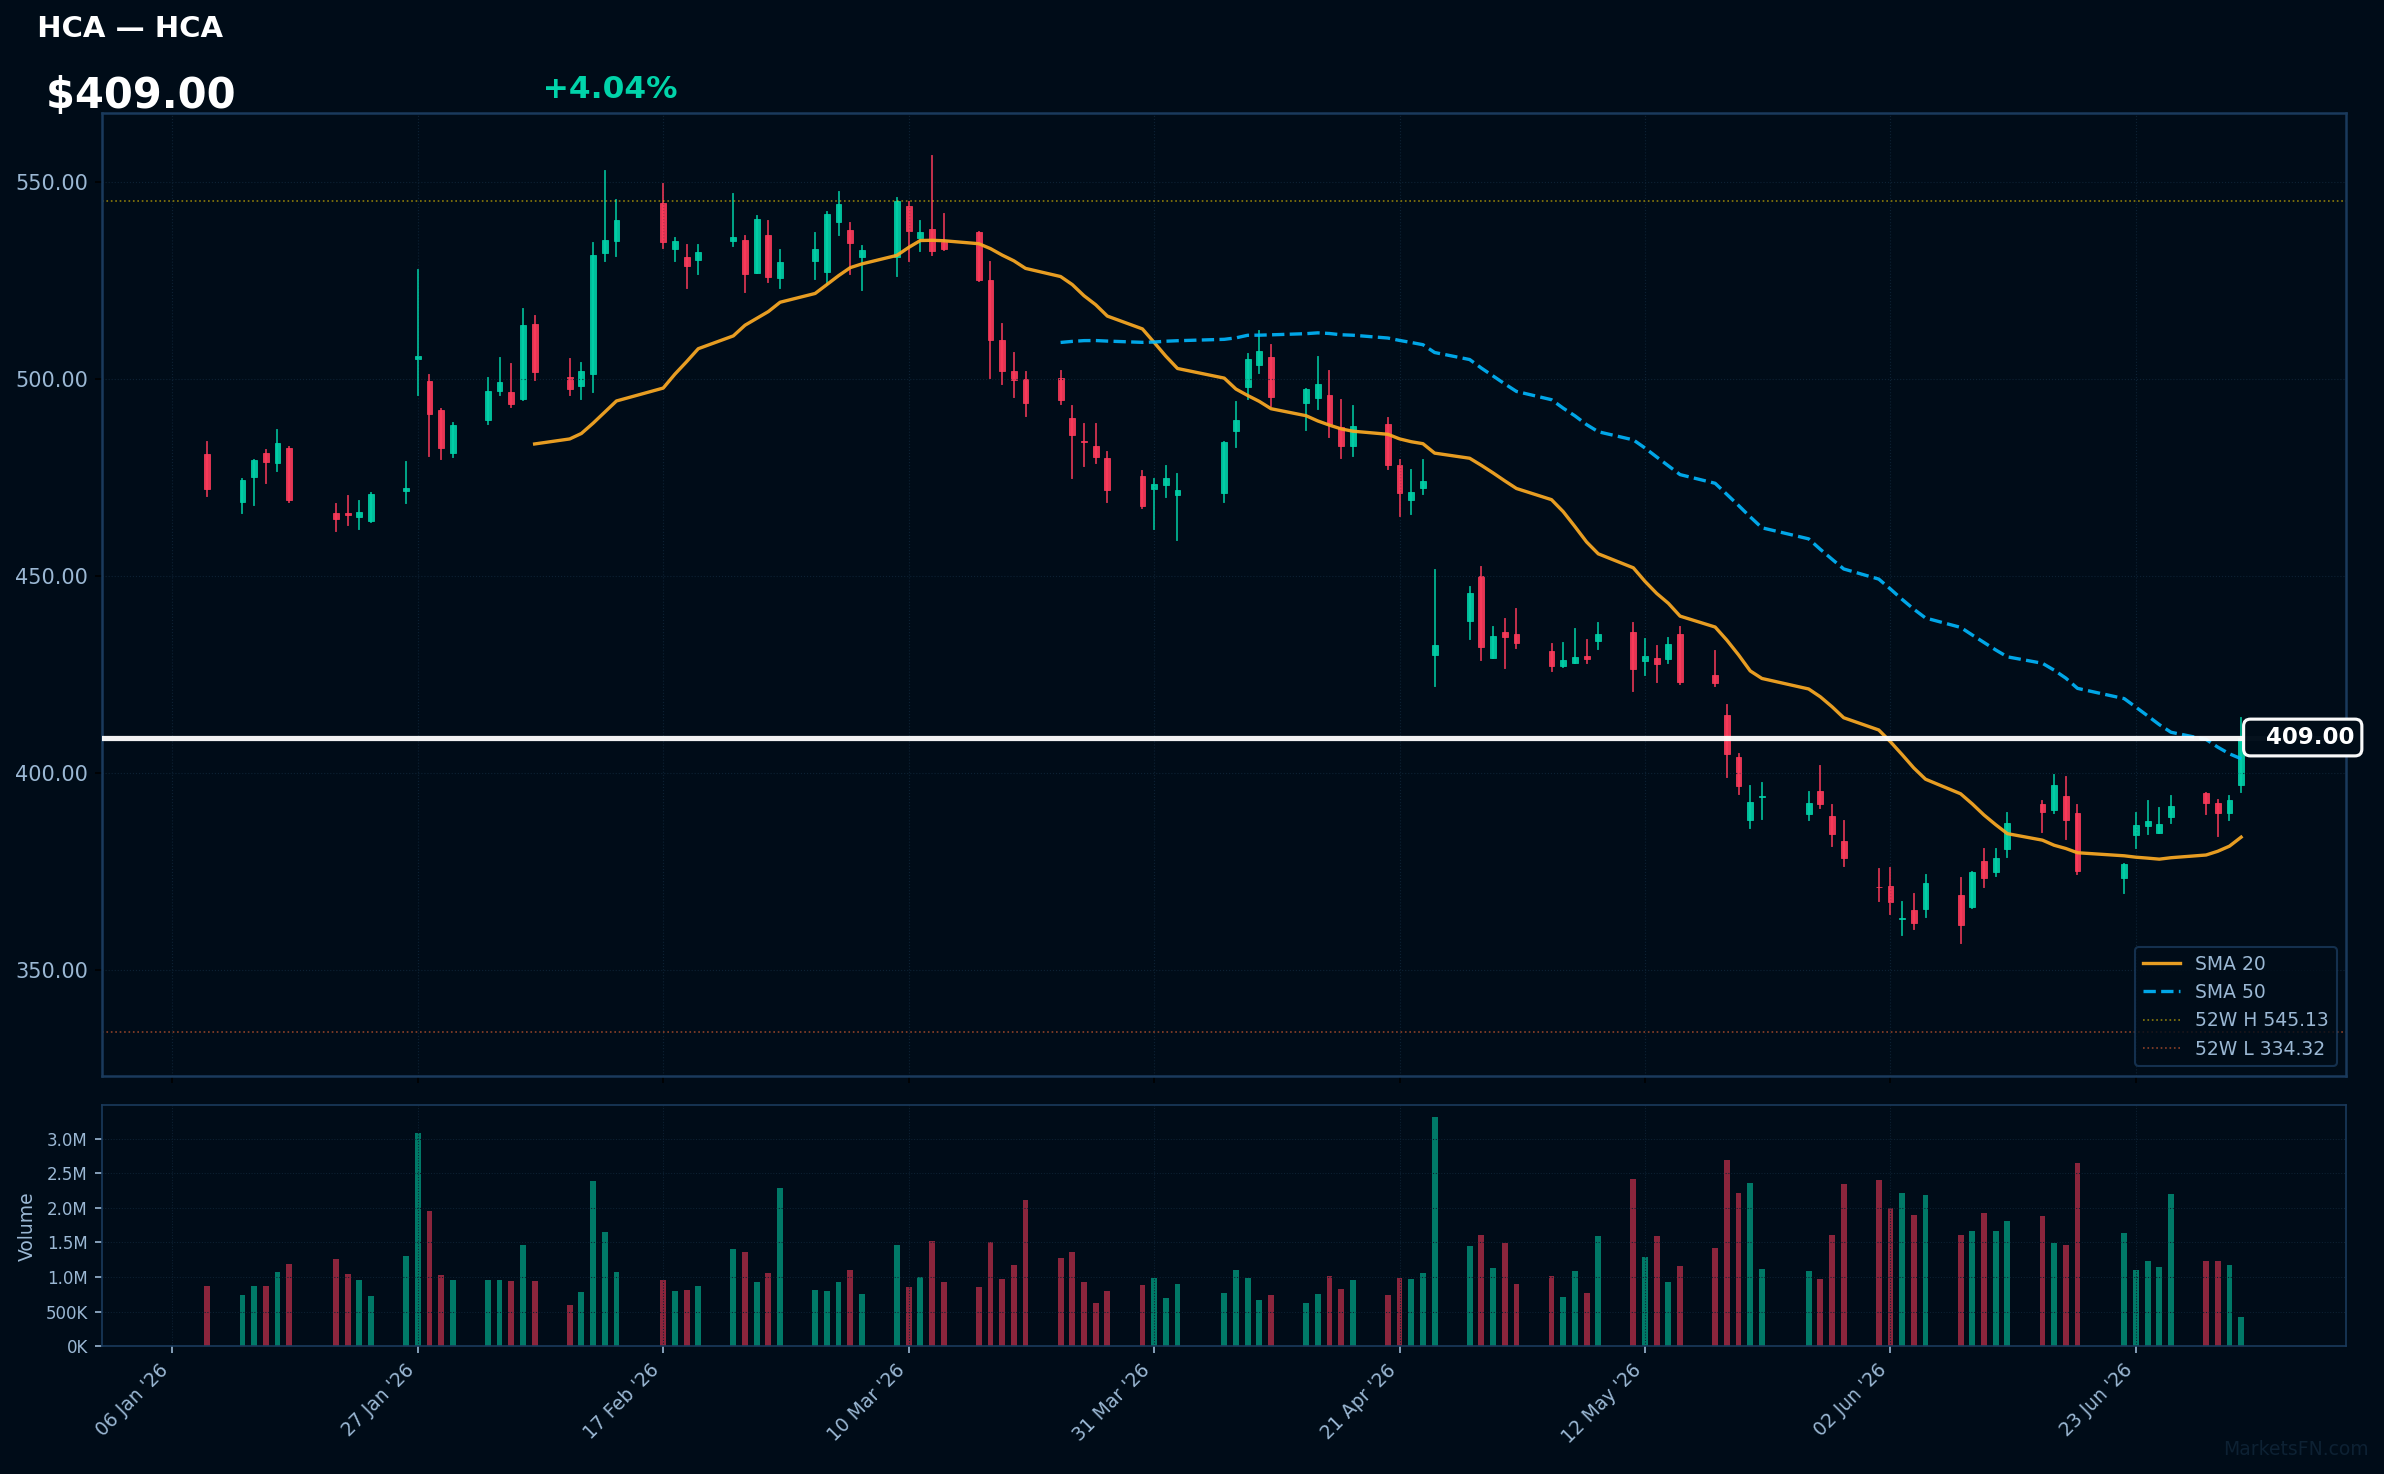
HCA | HCA Healthcare Inc | Healthcare | Price: $409.12 | Day: +4.04% | 1W: +5.70% | 1M: +11.34% | RSI: 60.8 | vs MA200: -11.0% | Trend: Above MA20, MA50 · Below MA200
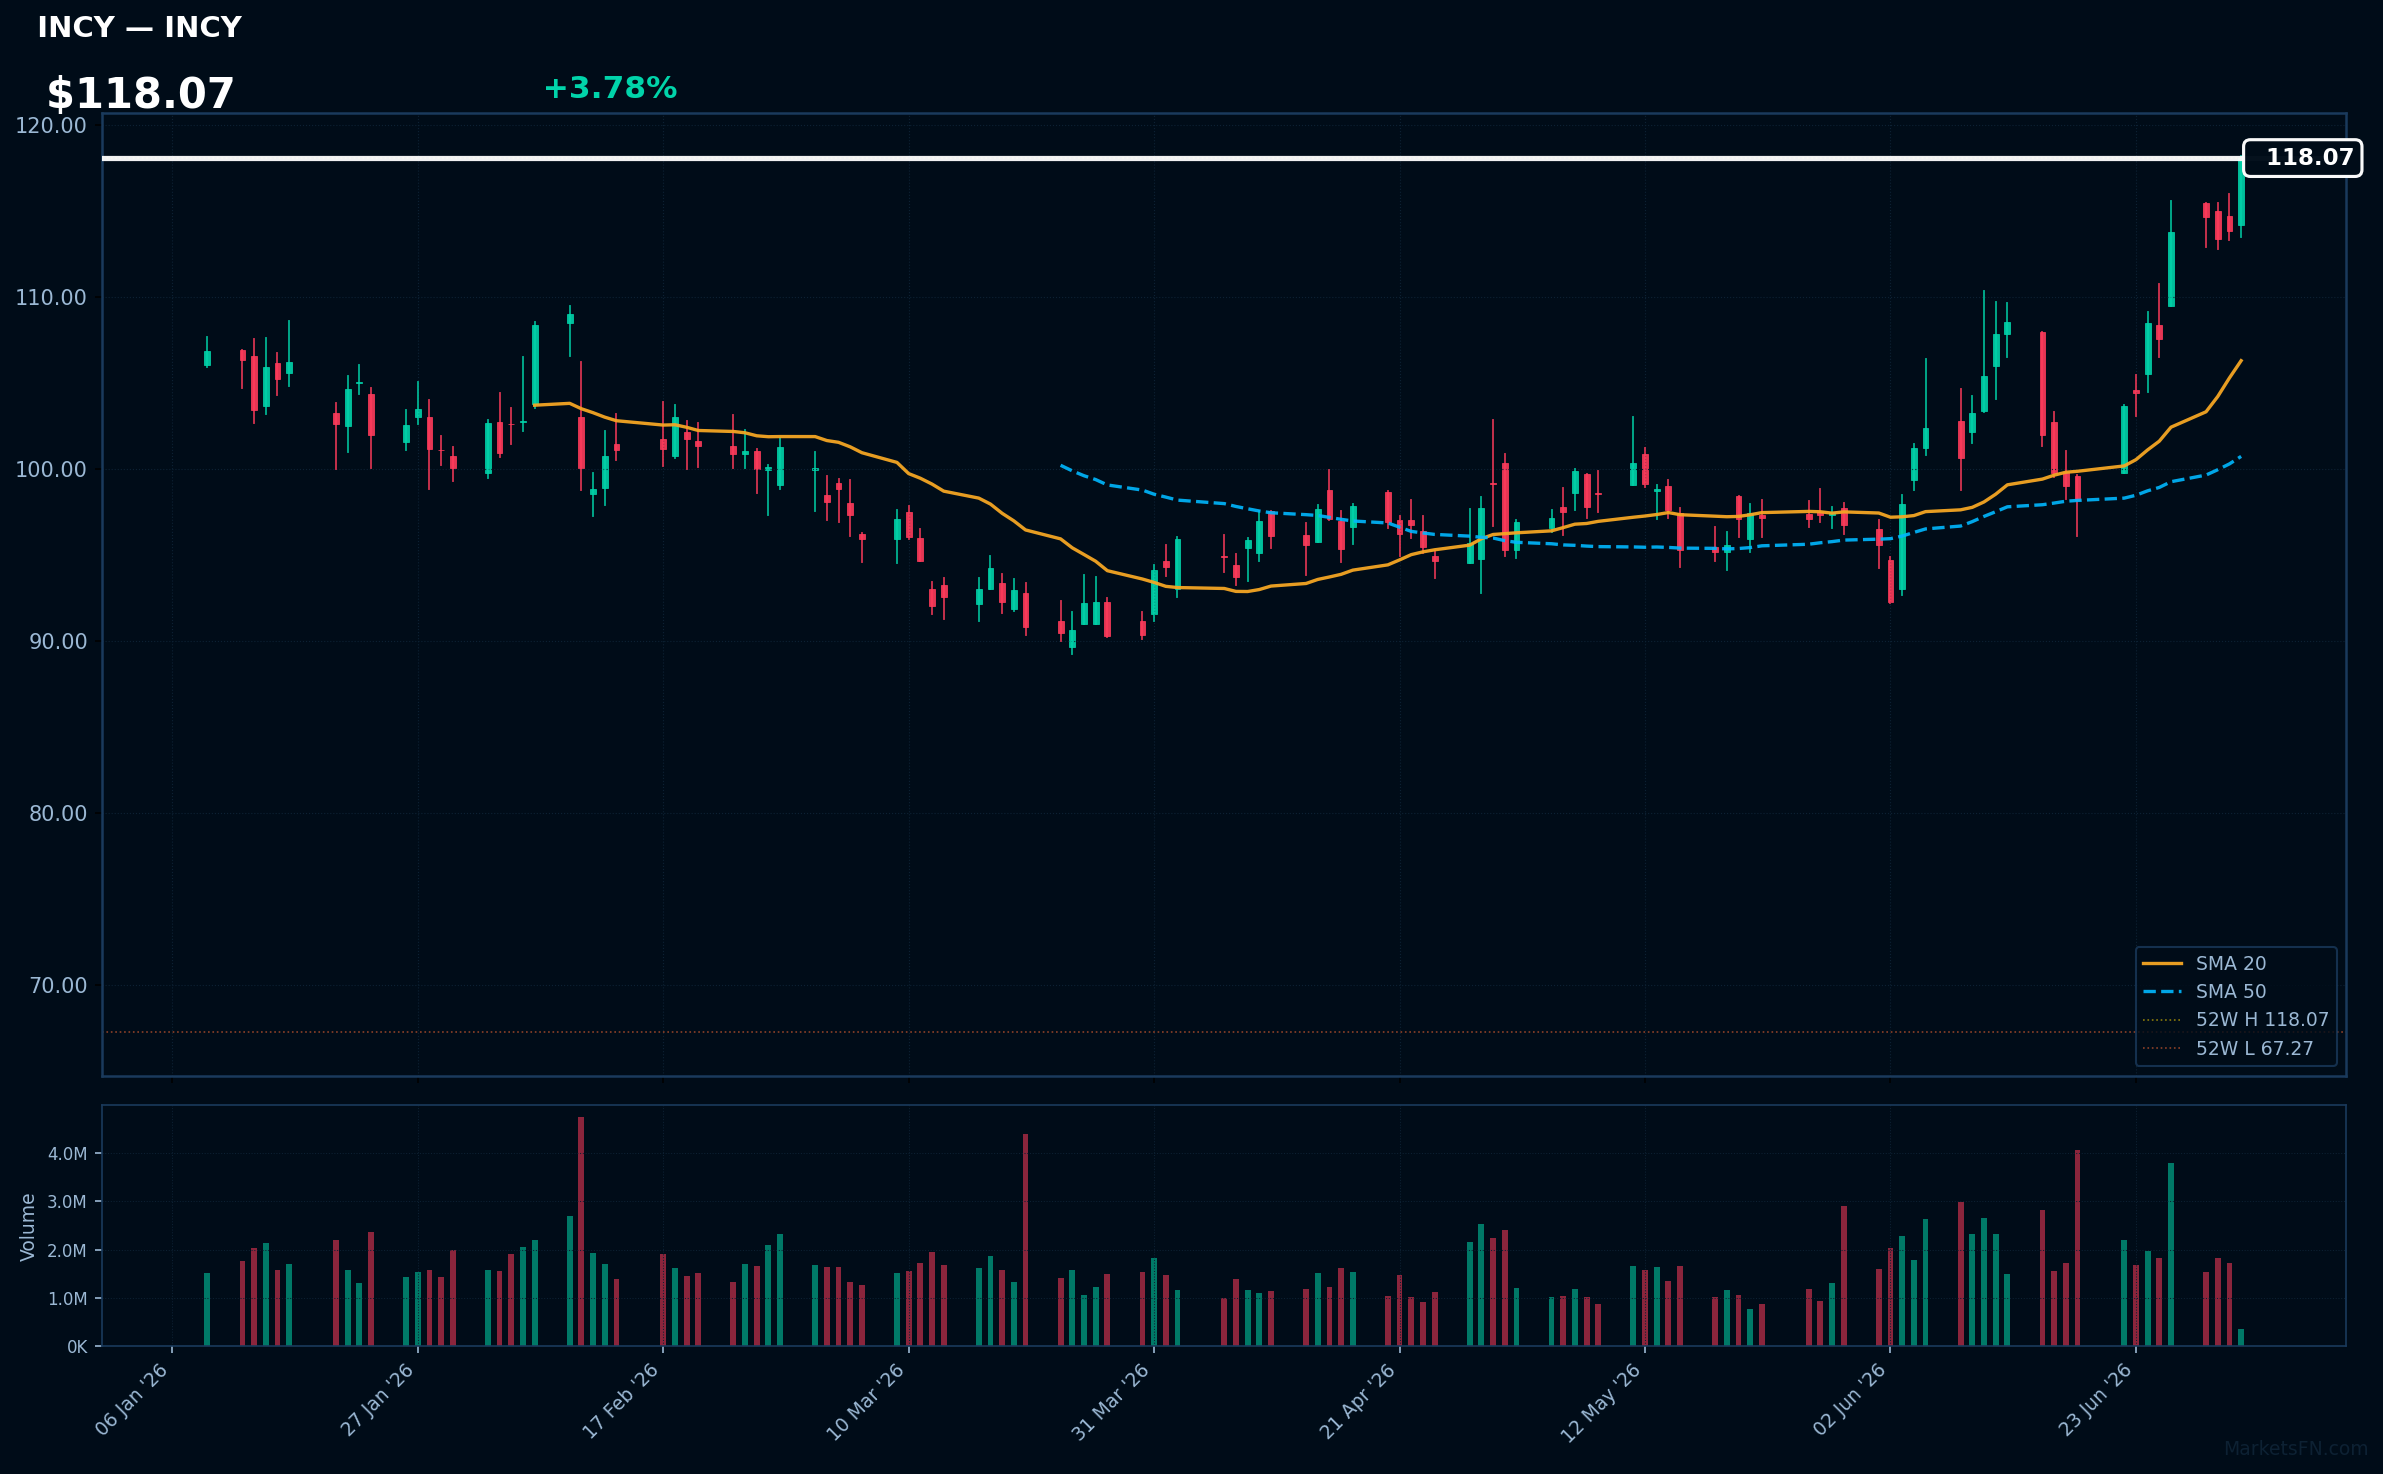
INCY | Incyte Corp | Healthcare | Price: $118.11 | Day: +3.78% | 1W: +9.81% | 1M: +28.01% | RSI: 71.6 | vs MA200: +20.6% | Trend: Above MA20, MA50, MA200
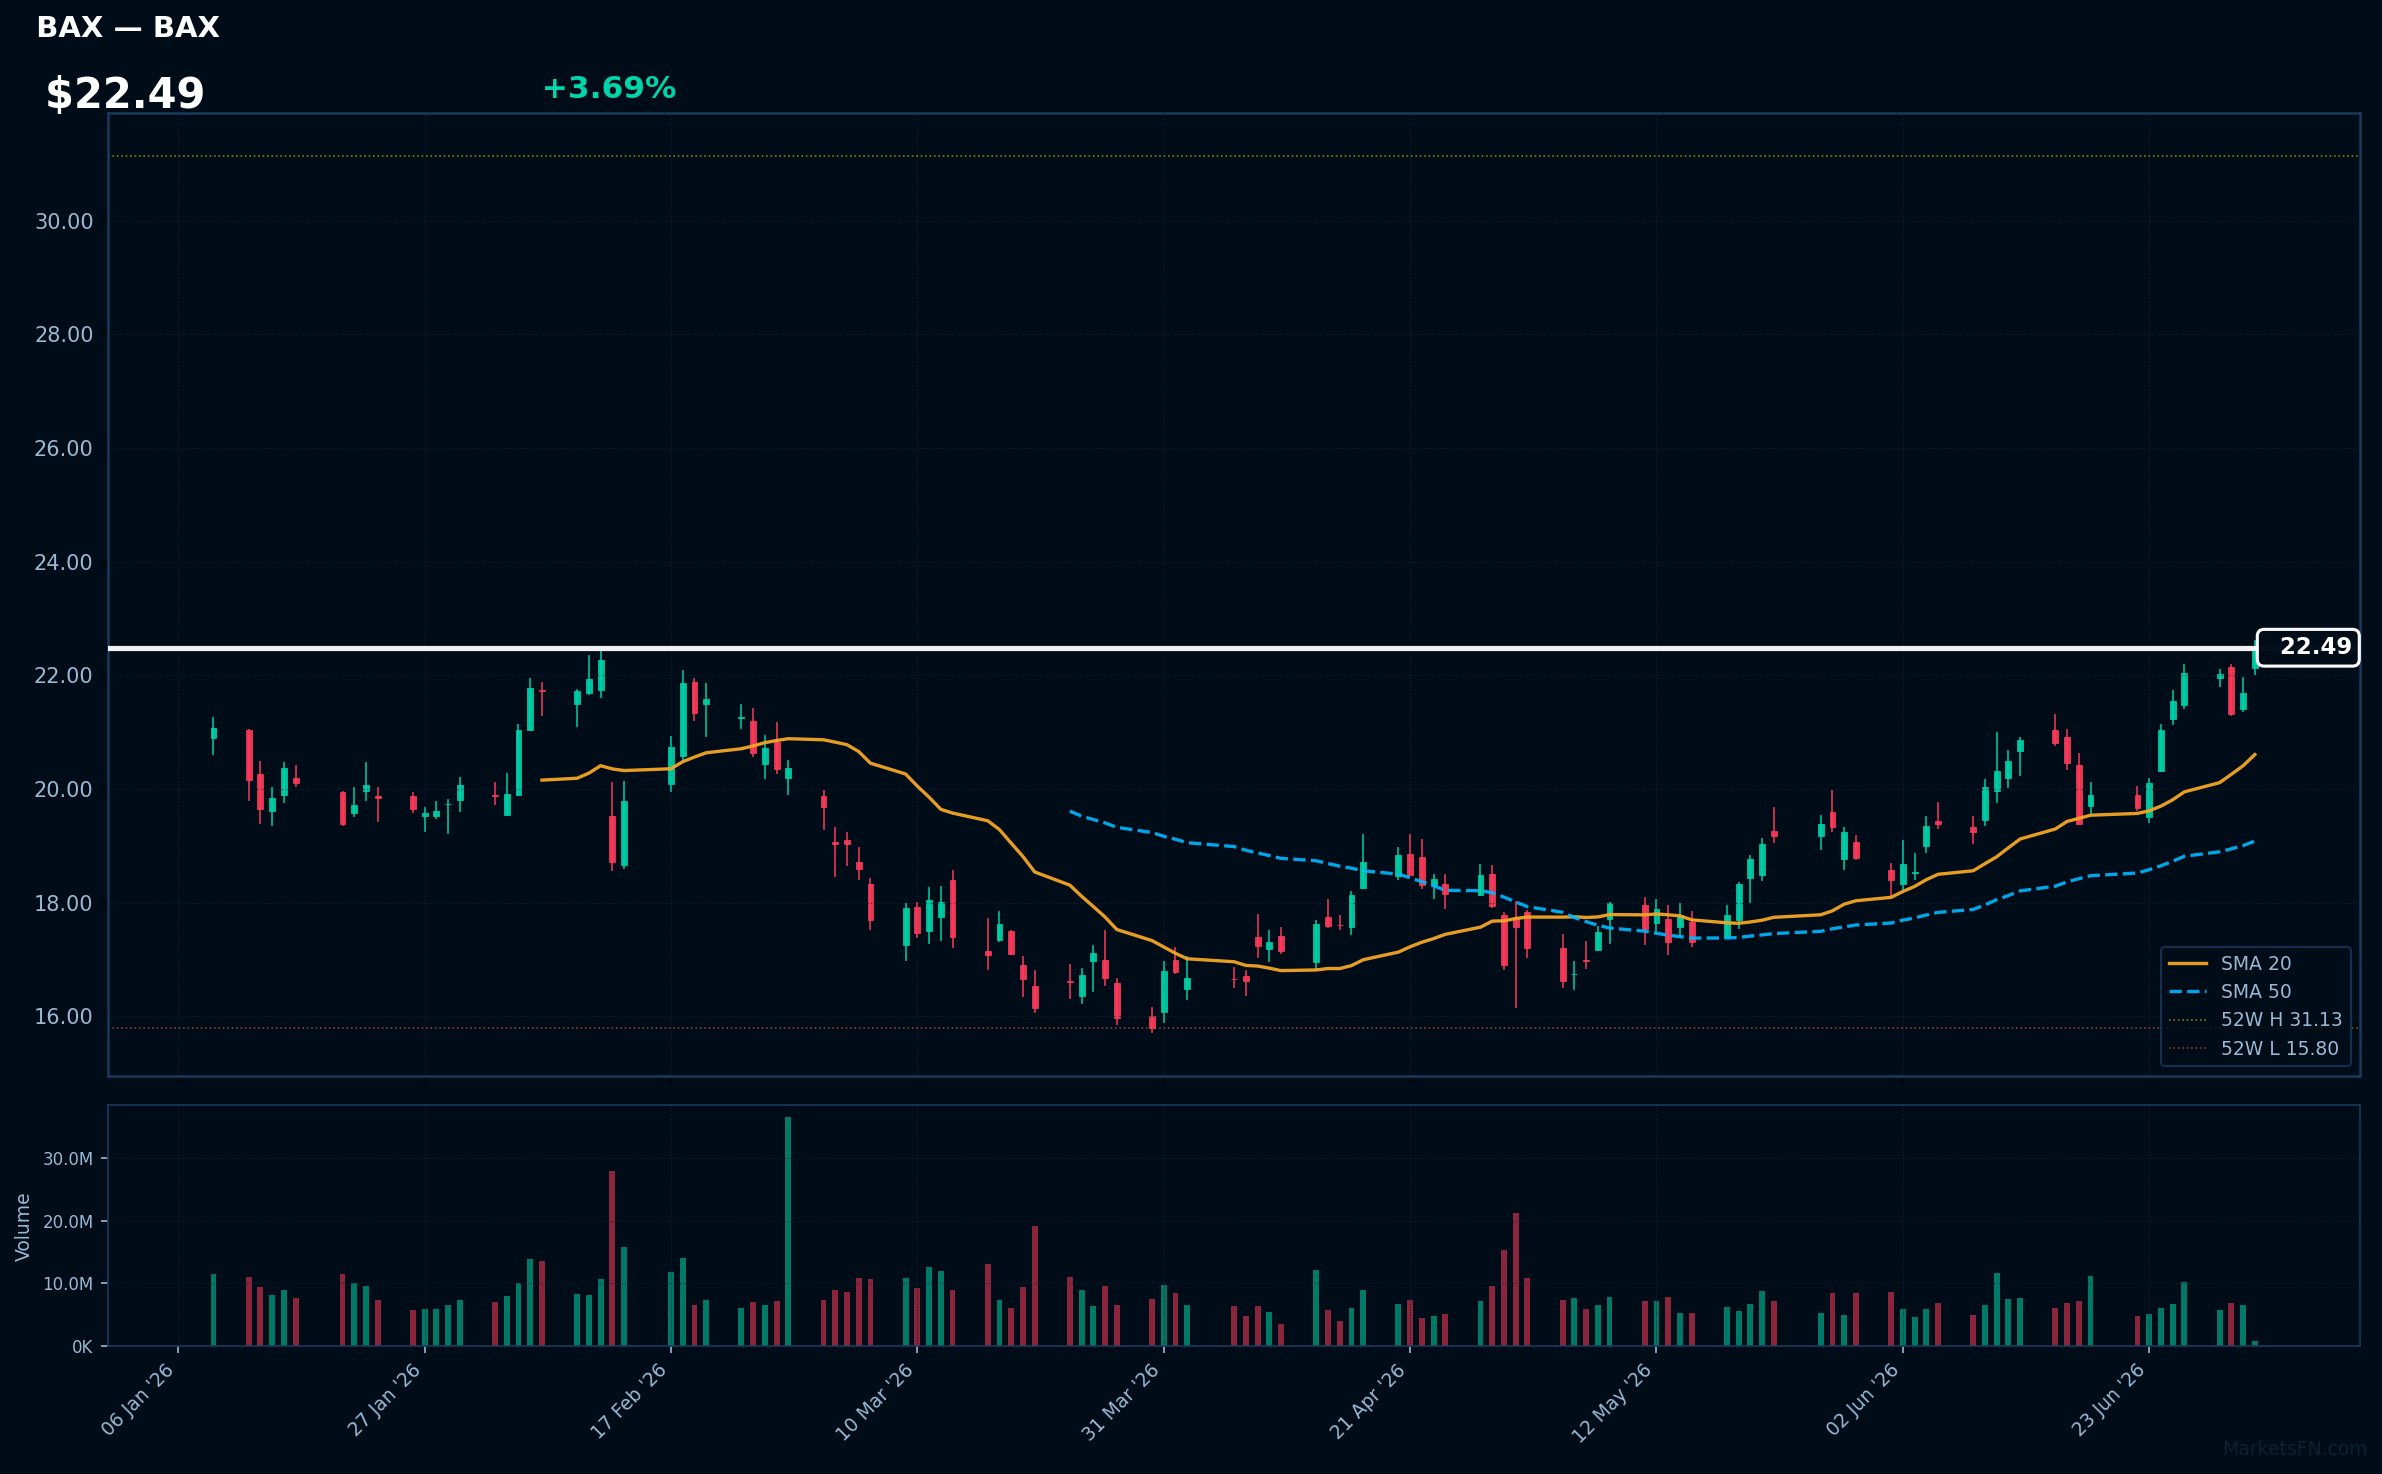
BAX | Baxter International Inc | Healthcare | Price: $22.49 | Day: +3.69% | 1W: +4.34% | 1M: +20.37% | RSI: 68.5 | vs MA200: +15.0% | Trend: Above MA20, MA50, MA200
Top 10 Losers
Today's weakest S&P 500 performers. Sector drag: Technology (4), Consumer Cyclical (2), Communication Services (2), Consumer Defensive (1), Real Estate (1).
| Ticker | Company | Sector | Price | Day % | 1W % | 1M % | RSI | vs MA200 | Trend |
|---|---|---|---|---|---|---|---|---|---|
| CPB | Campbells Co | Consumer Defensive | $22.97 | -2.13% | +2.77% | +9.43% | 58.6 | -11.8% | Above MA20, MA50 · Below MA200 |
| JBL | Jabil Inc | Technology | $366.95 | -2.23% | -2.05% | -1.66% | 49.7 | +36.9% | Above MA50, MA200 · Below MA20 |
| NCLH | Norwegian Cruise Line Holdings Ltd | Consumer Cyclical | $20.18 | -2.35% | -3.86% | +11.25% | 53.6 | -2.9% | Above MA20, MA50 · Below MA200 |
| AMAT | Applied Materials Inc | Technology | $634.11 | -2.58% | -5.18% | +29.26% | 57.9 | +86.8% | Above MA20, MA50, MA200 |
| LRCX | Lam Research Corp | Technology | $380.57 | -2.73% | -5.50% | +13.55% | 53.8 | +70.7% | Above MA20, MA50, MA200 |
| TKO | TKO Group Holdings Inc | Communication Services | $196.39 | -2.98% | -3.63% | -4.01% | 45.7 | -0.8% | Above MA50 · Below MA20, MA200 |
| TSLA | Tesla Inc | Consumer Cyclical | $412.39 | -3.03% | +9.94% | -2.67% | 53.0 | -1.5% | Above MA20, MA50 · Below MA200 |
| IRM | Iron Mountain Inc | Real Estate | $118.07 | -3.14% | -9.92% | -8.10% | 36.5 | +12.4% | Above MA200 · Below MA20, MA50 |
| META | Meta Platforms Inc | Communication Services | $592.37 | -3.35% | +8.86% | -1.12% | 51.7 | -8.4% | Above MA20 · Below MA50, MA200 |
| KLAC | KLA Corp | Technology | $254.65 | -4.34% | -1.64% | +24.46% | 54.6 | +67.5% | Above MA20, MA50, MA200 |
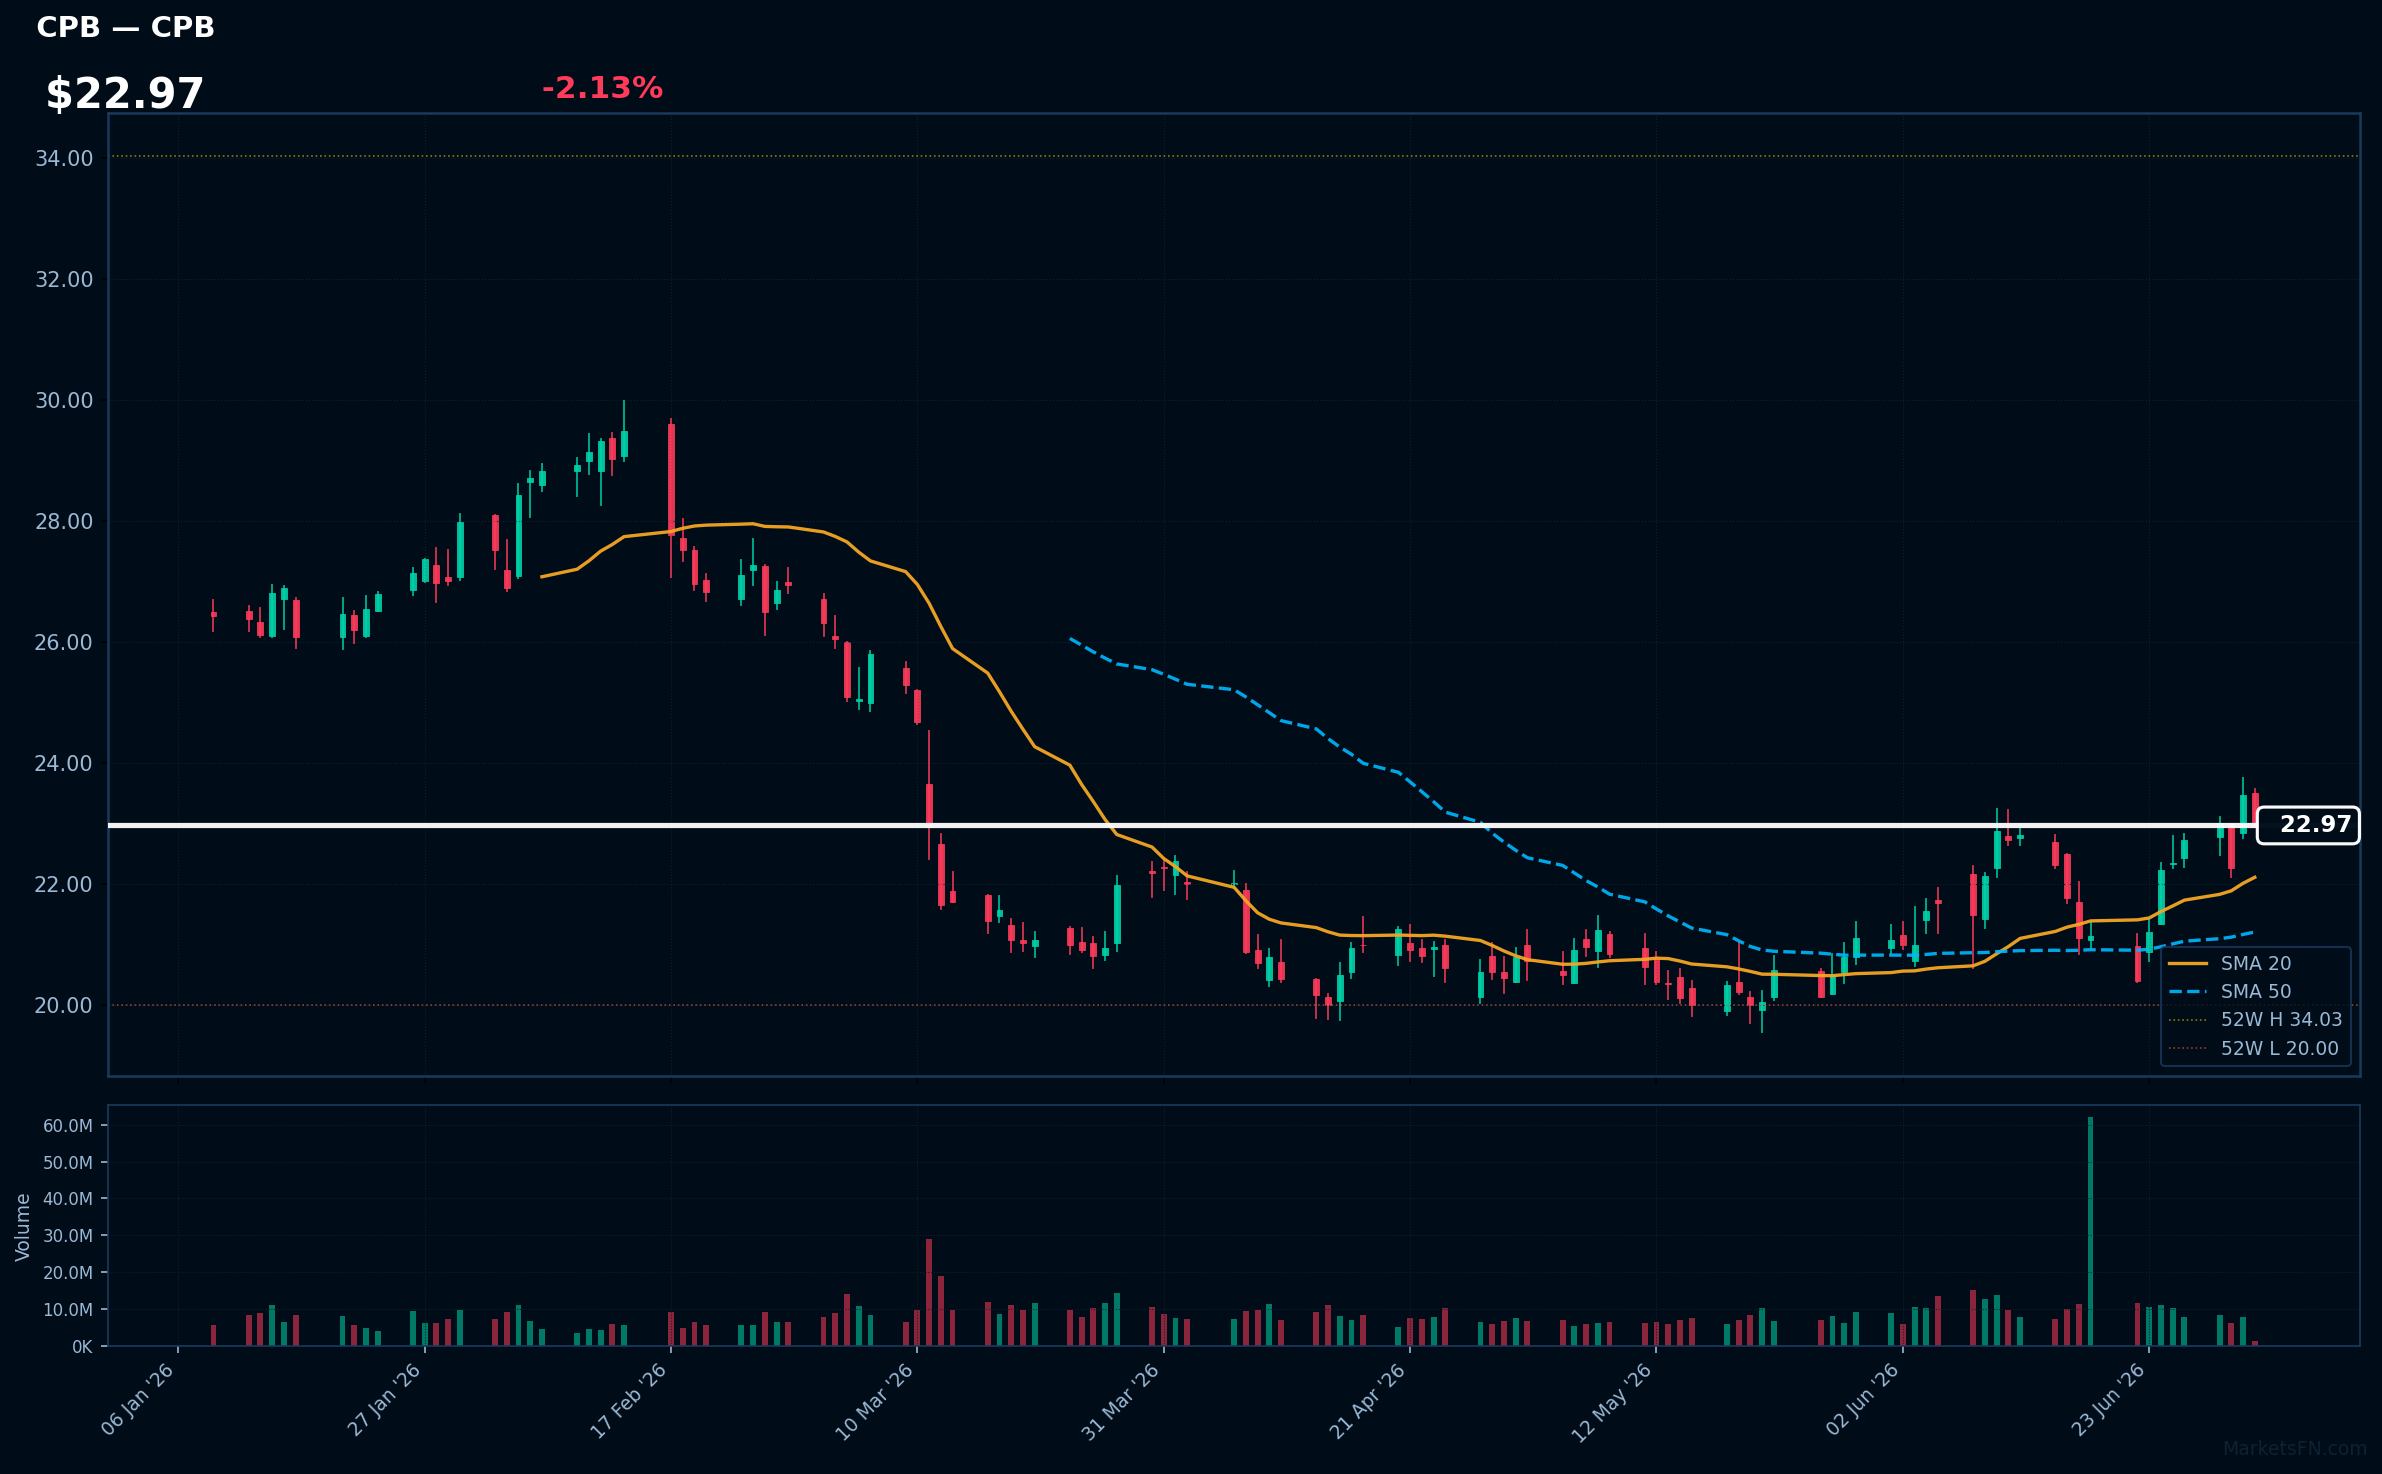
CPB | Campbells Co | Consumer Defensive | Price: $22.97 | Day: -2.13% | 1W: +2.77% | 1M: +9.43% | RSI: 58.6 | vs MA200: -11.8% | Trend: Above MA20, MA50 · Below MA200
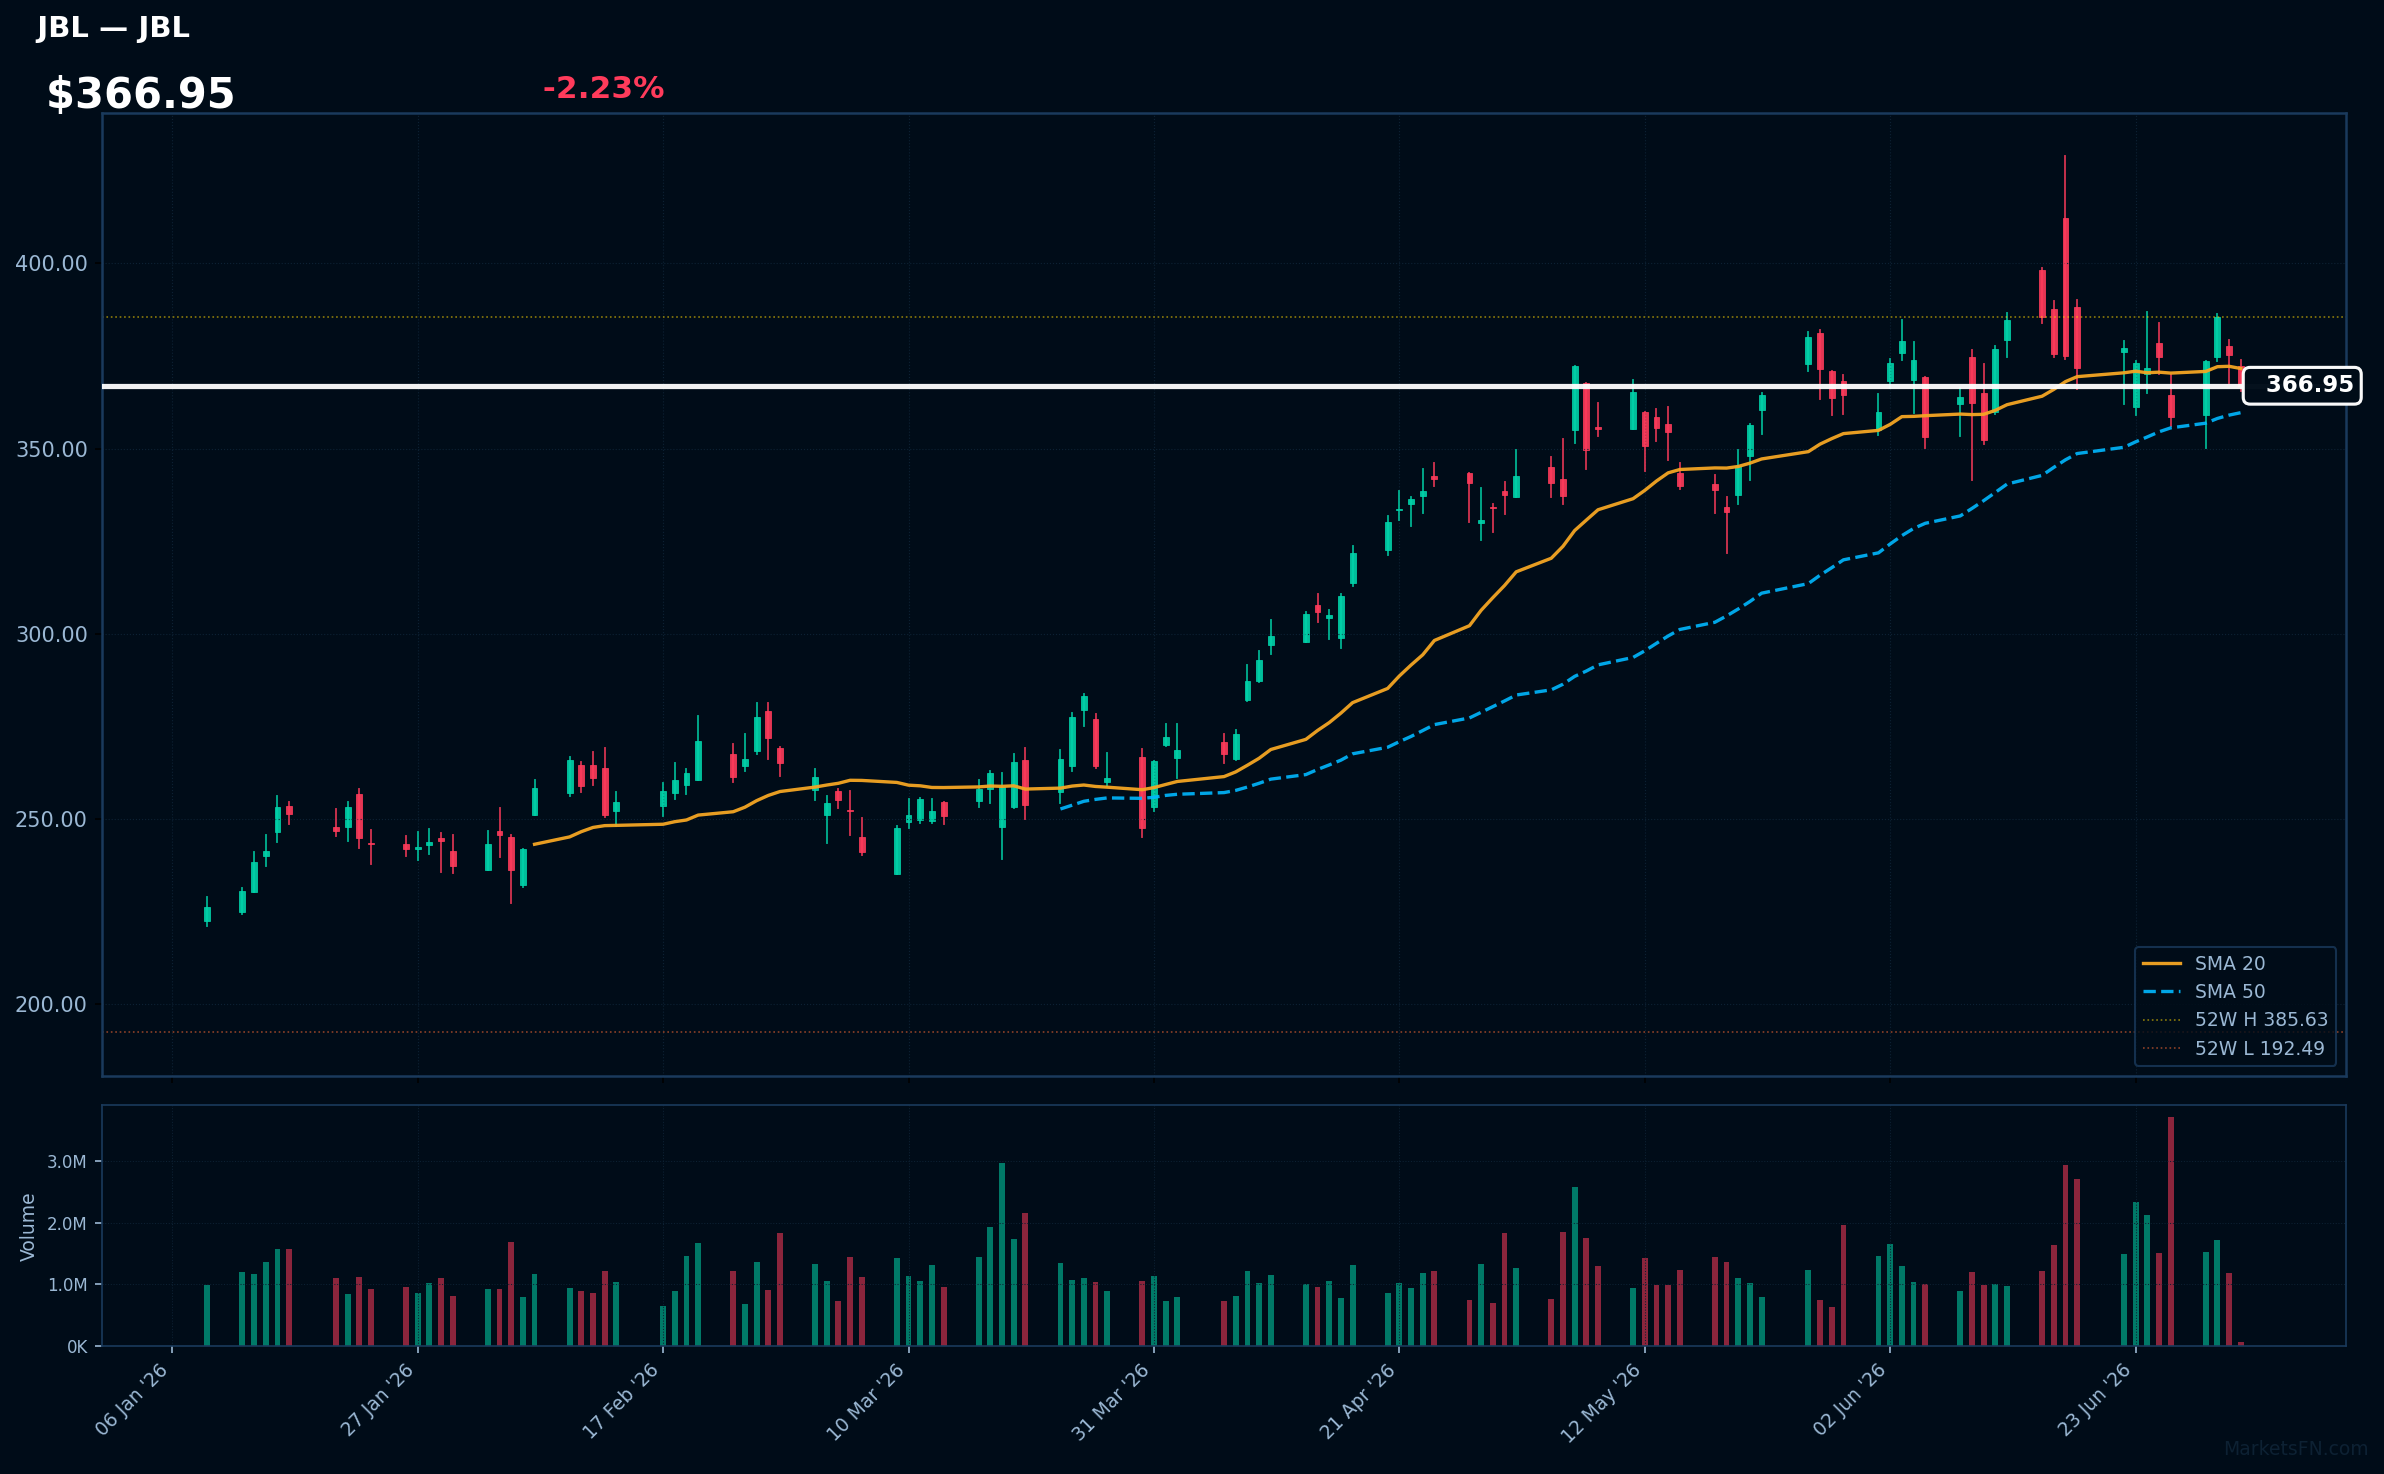
JBL | Jabil Inc | Technology | Price: $366.95 | Day: -2.23% | 1W: -2.05% | 1M: -1.66% | RSI: 49.7 | vs MA200: +36.9% | Trend: Above MA50, MA200 · Below MA20
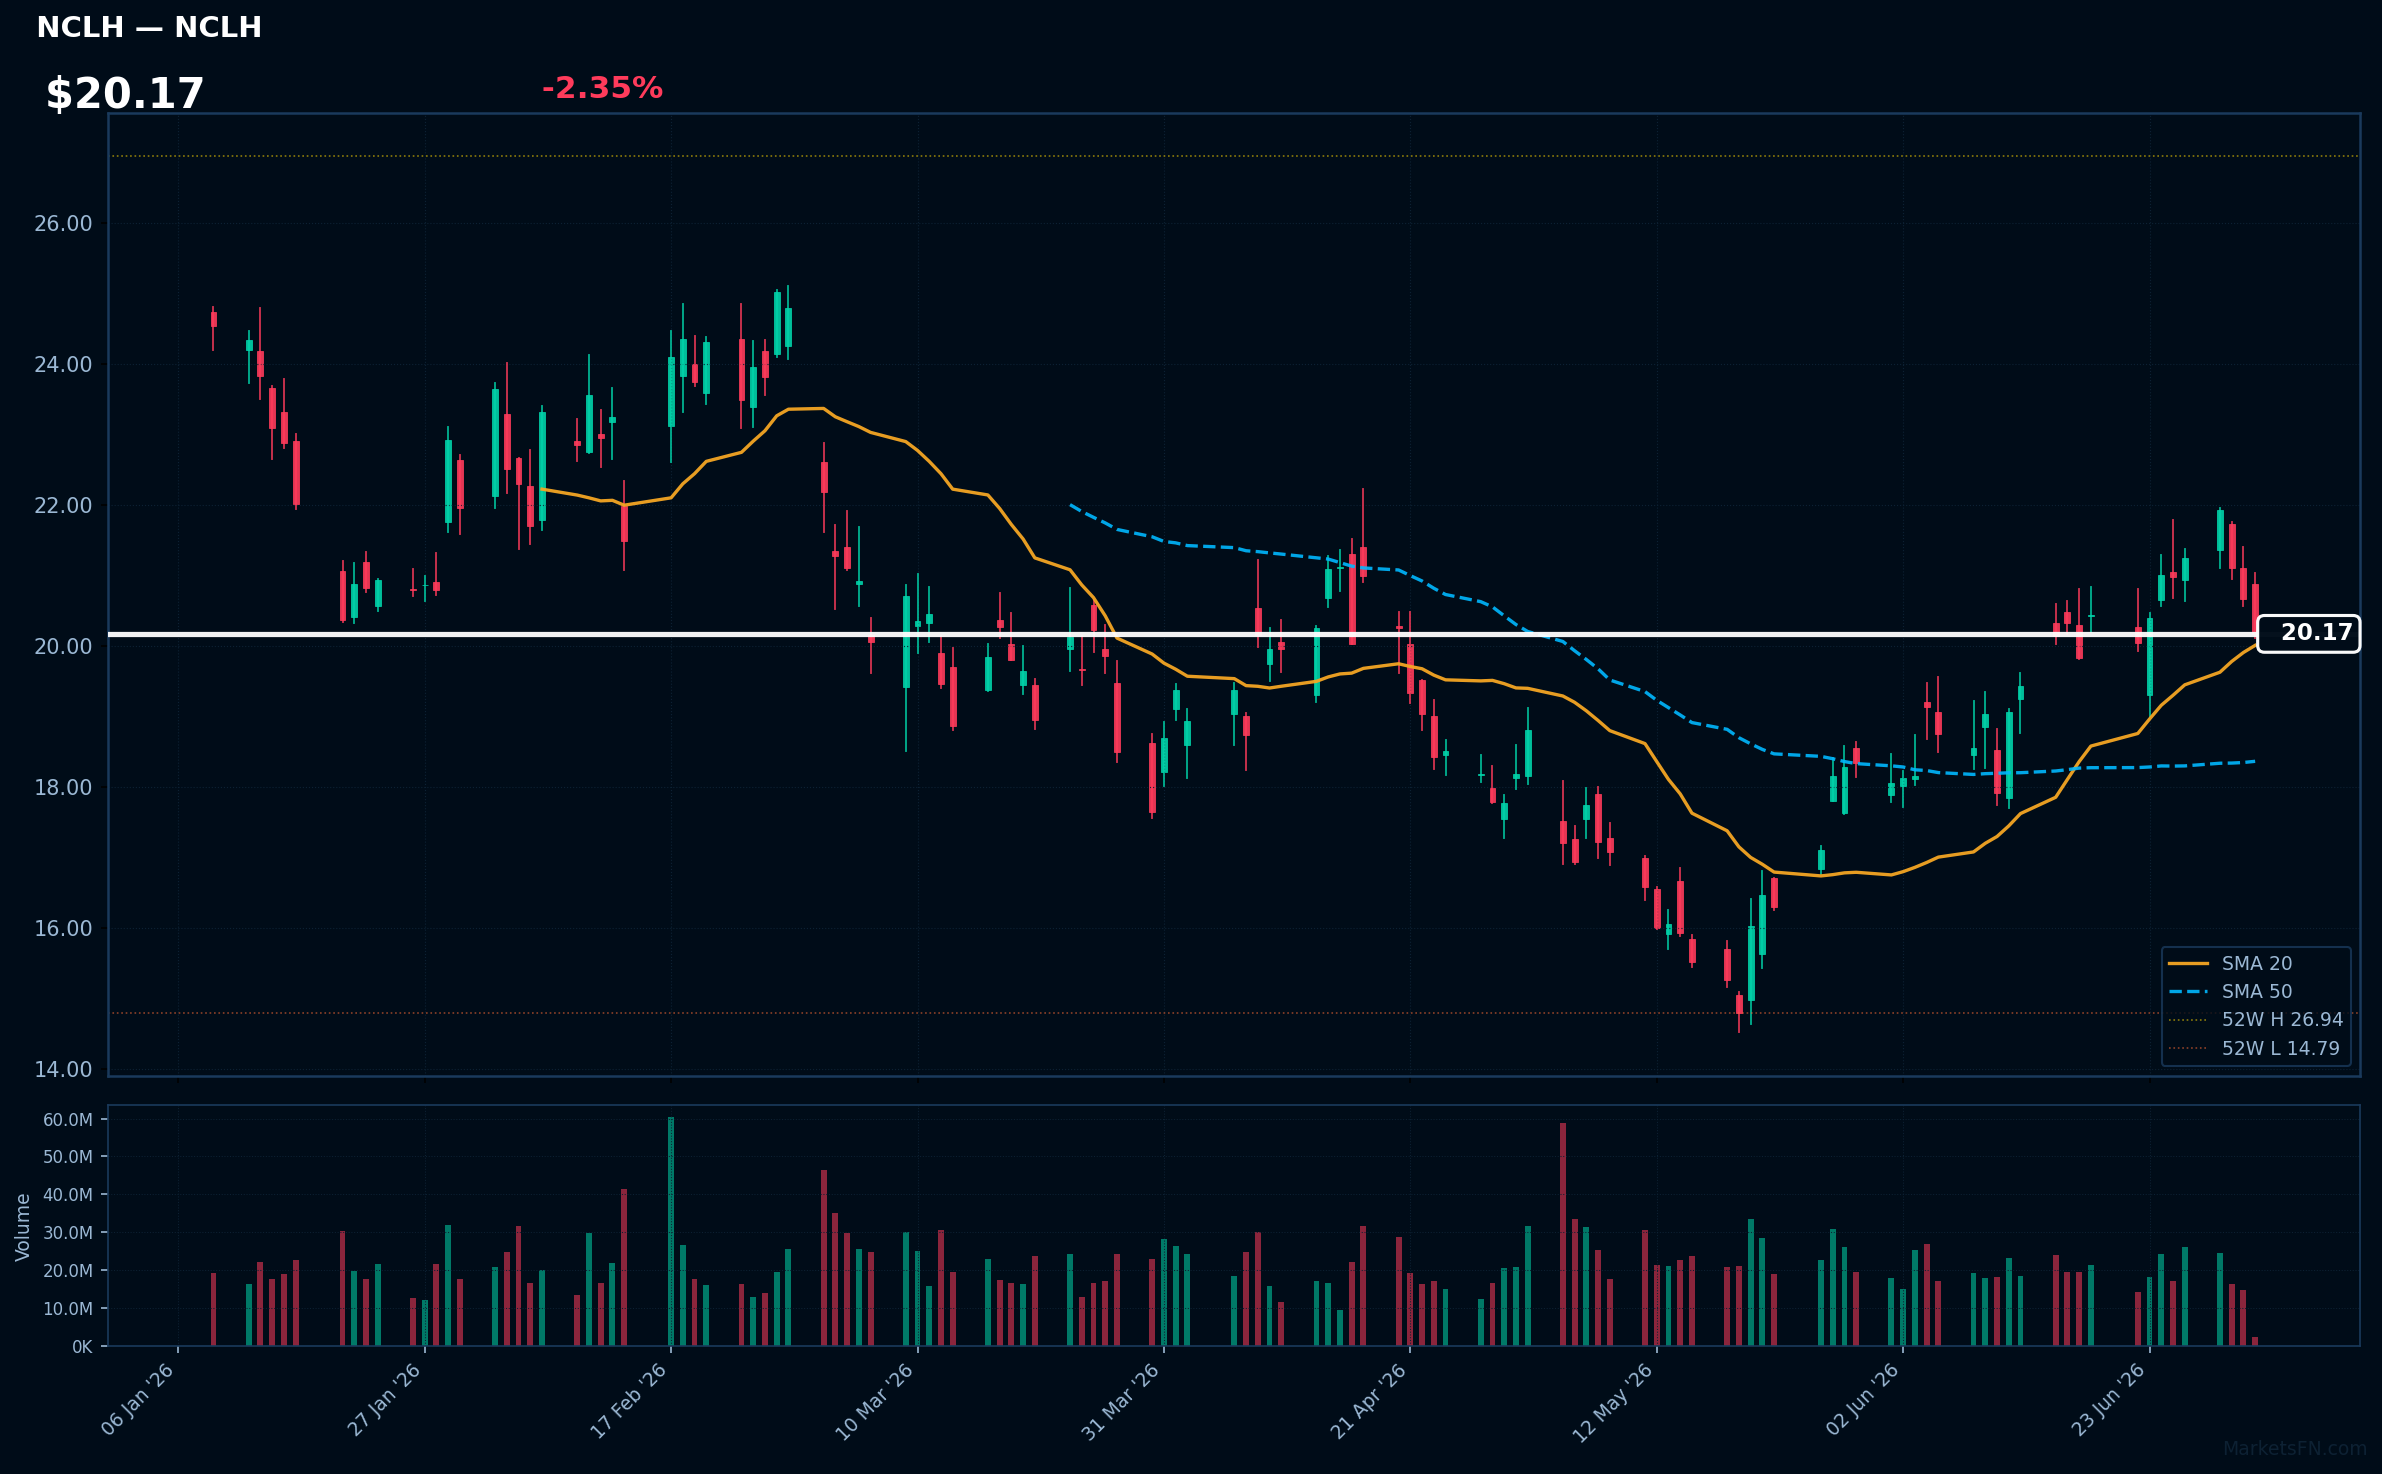
NCLH | Norwegian Cruise Line Holdings Ltd | Consumer Cyclical | Price: $20.18 | Day: -2.35% | 1W: -3.86% | 1M: +11.25% | RSI: 53.6 | vs MA200: -2.9% | Trend: Above MA20, MA50 · Below MA200
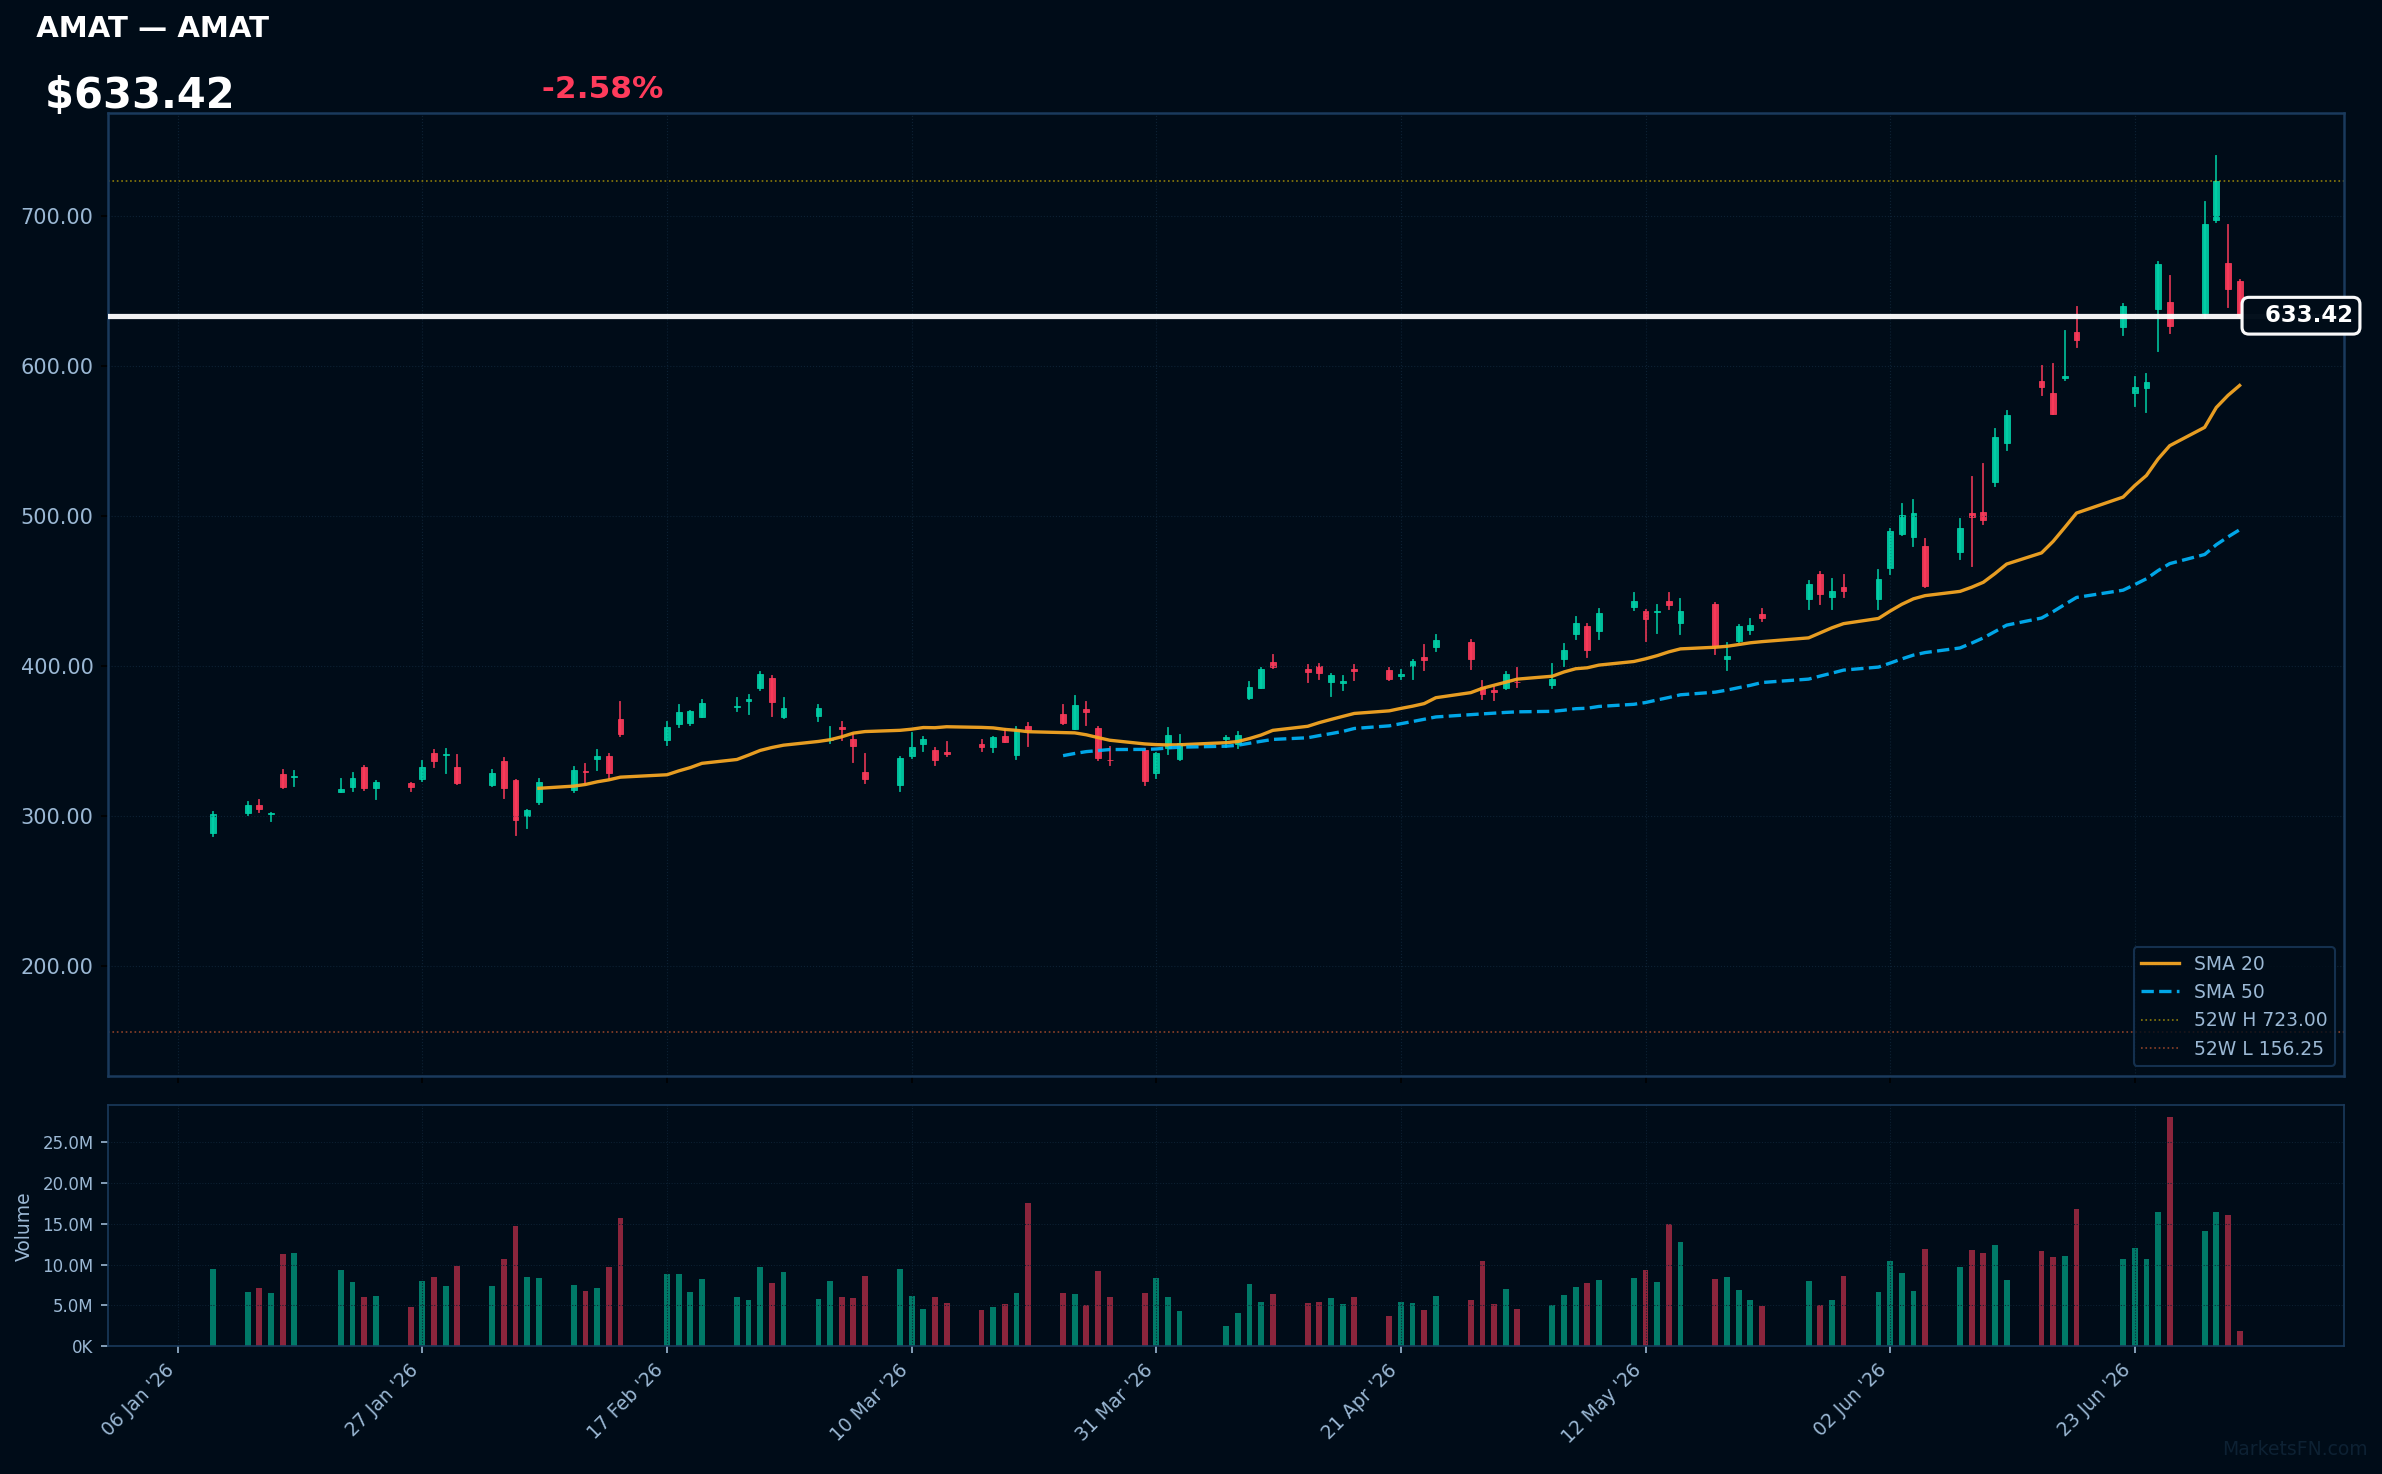
AMAT | Applied Materials Inc | Technology | Price: $634.11 | Day: -2.58% | 1W: -5.18% | 1M: +29.26% | RSI: 57.9 | vs MA200: +86.8% | Trend: Above MA20, MA50, MA200
Recent headlines (last 12h)
- Caterpillar Slides Nearly 7% After Burry Opens First Short
- Chip stocks selloff extends on valuation, Metas pivot fears
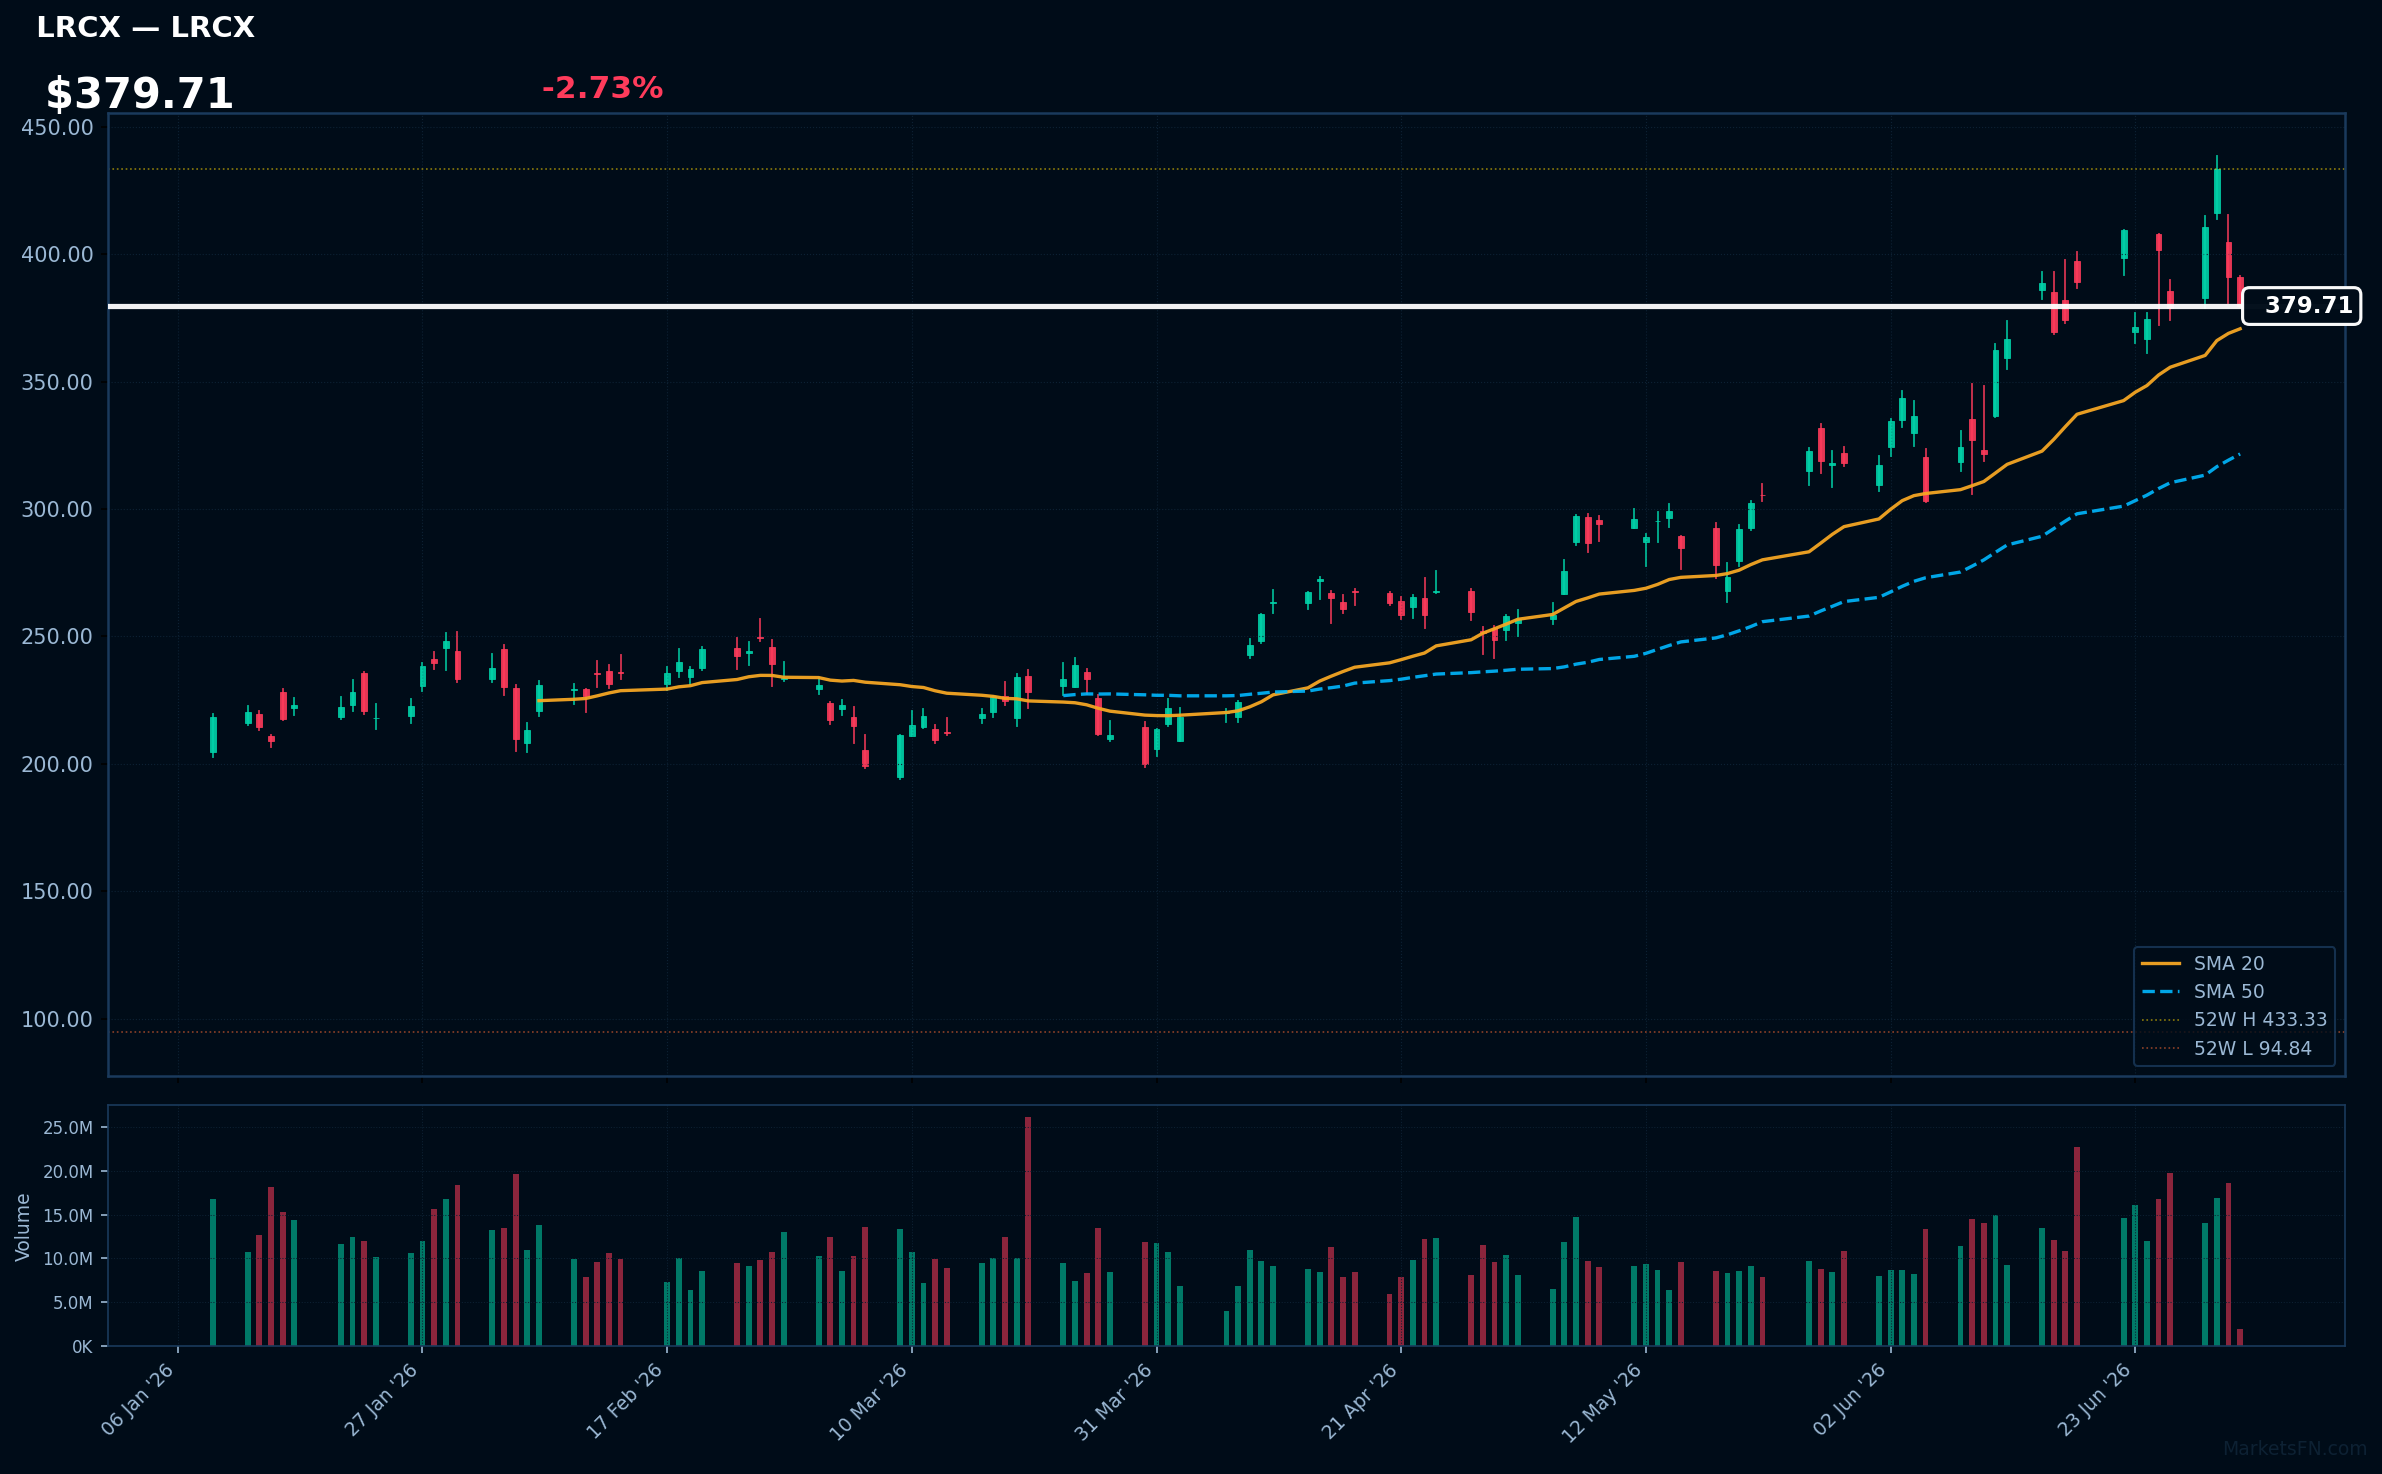
LRCX | Lam Research Corp | Technology | Price: $380.57 | Day: -2.73% | 1W: -5.50% | 1M: +13.55% | RSI: 53.8 | vs MA200: +70.7% | Trend: Above MA20, MA50, MA200
Recent headlines (last 12h)
- Chip stocks selloff extends on valuation, Metas pivot fears
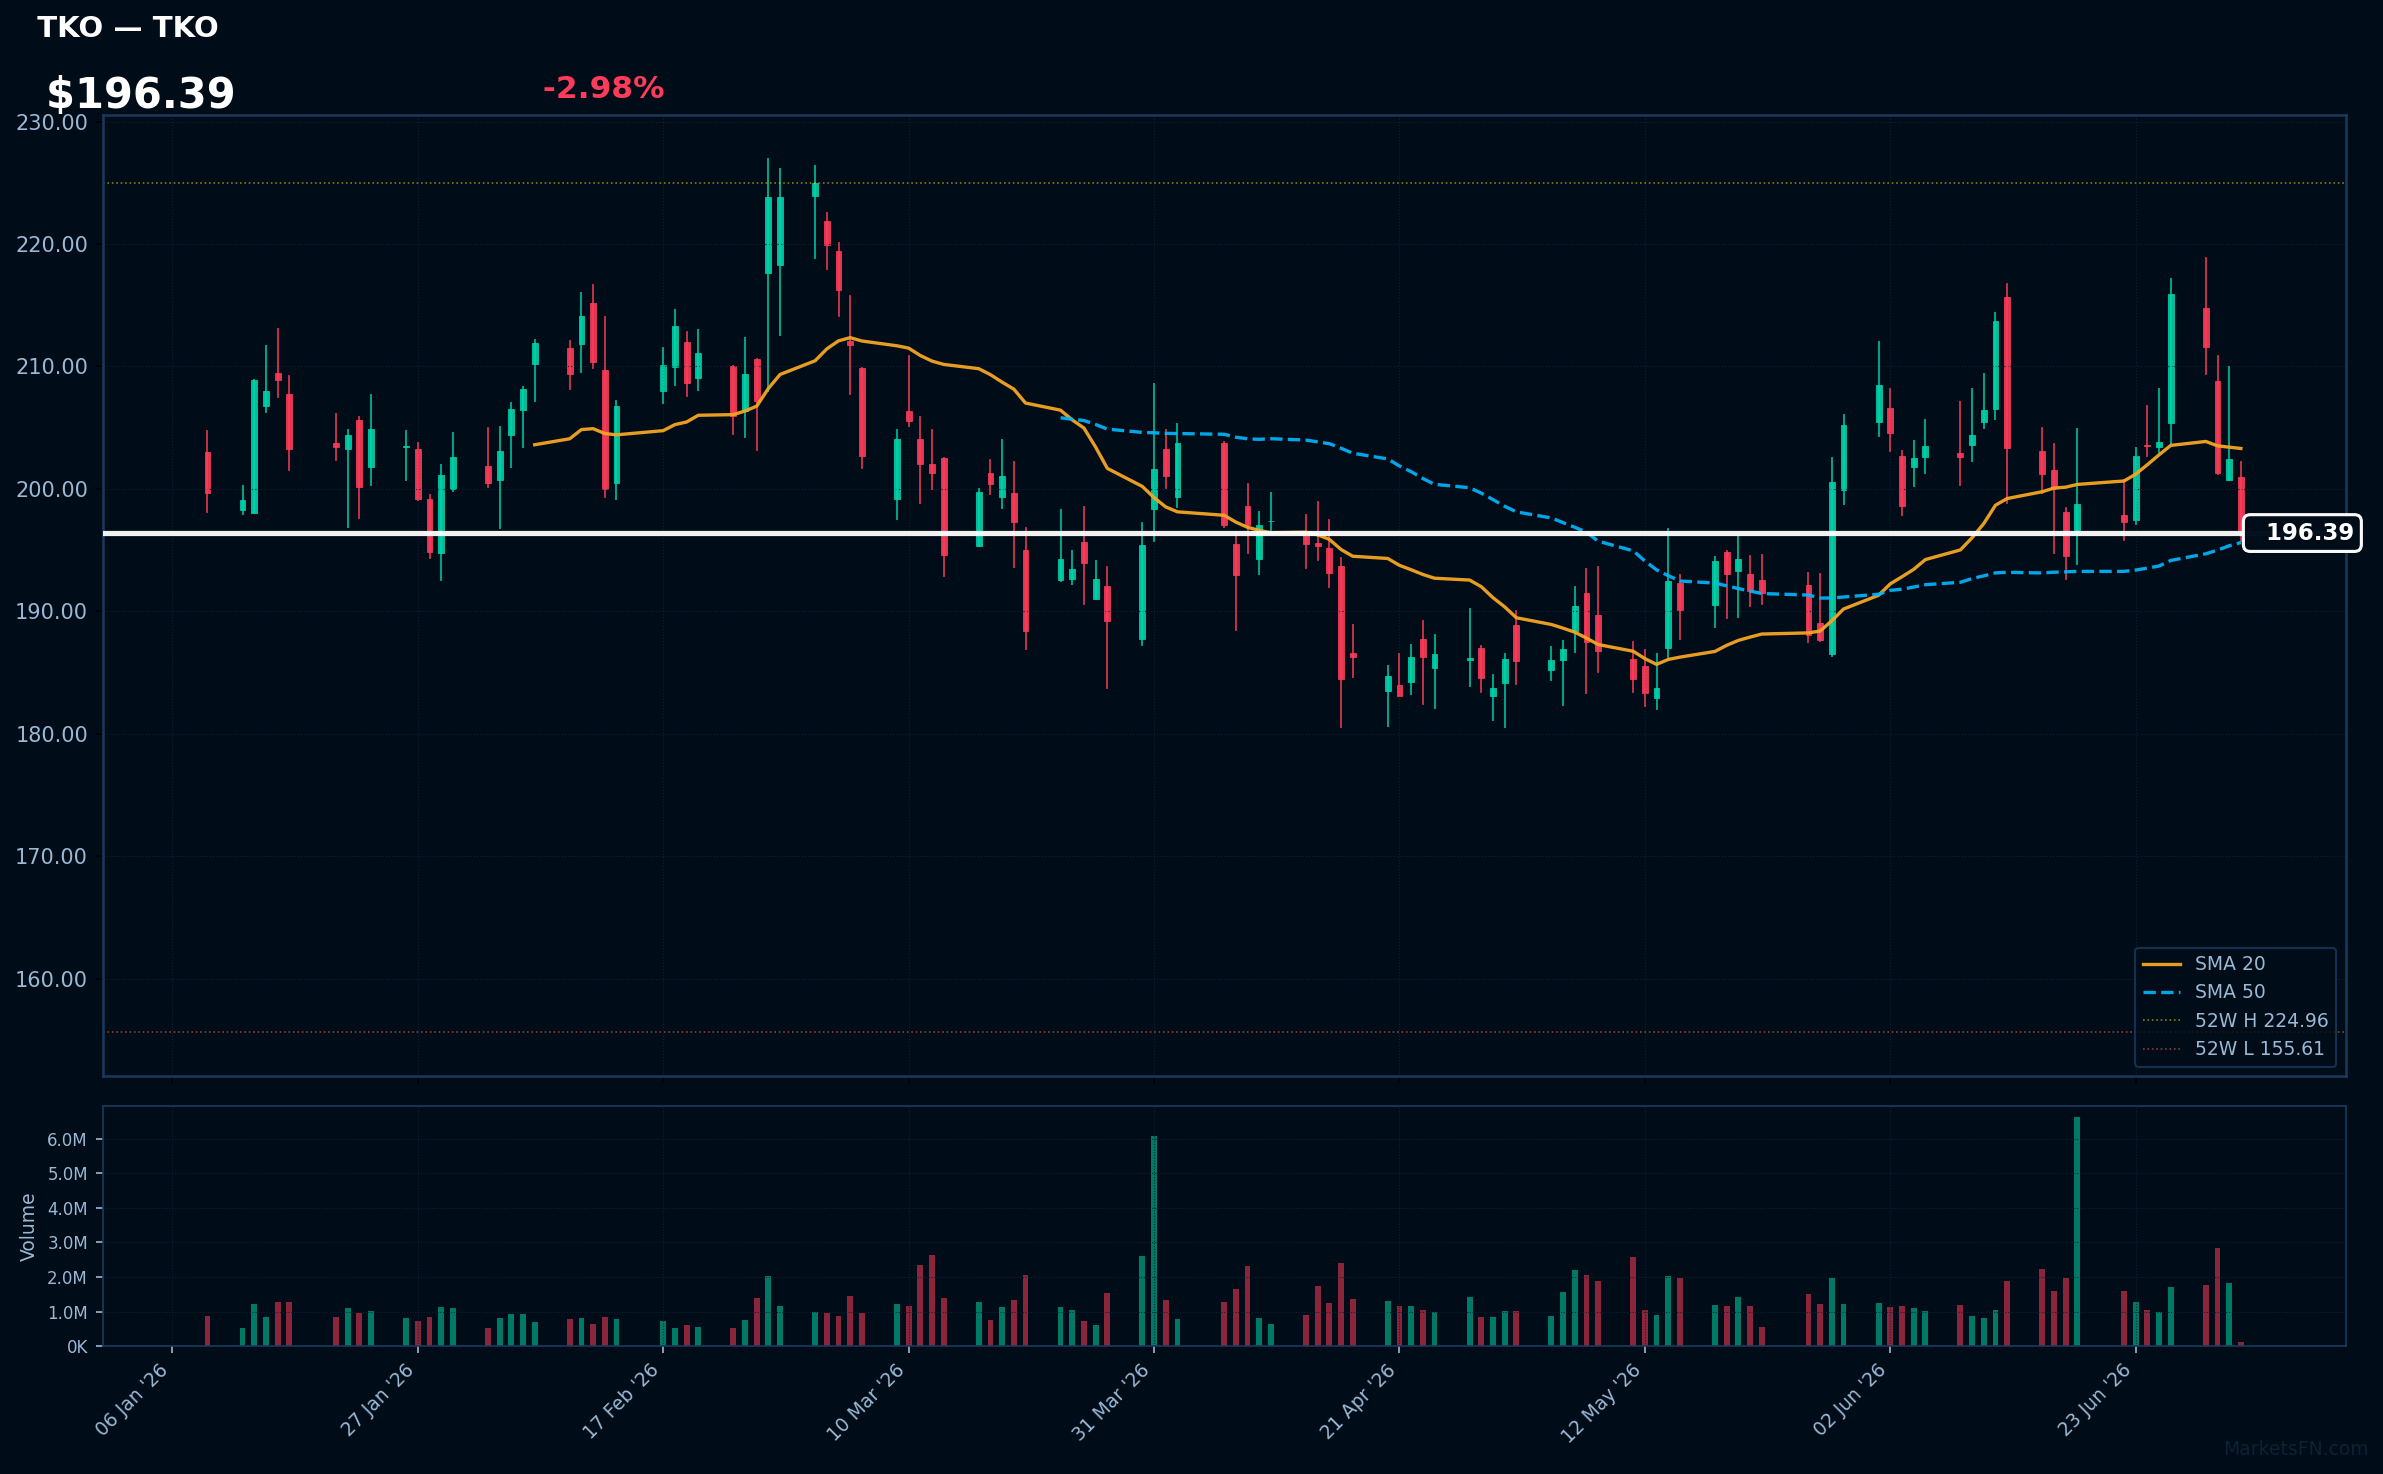
TKO | TKO Group Holdings Inc | Communication Services | Price: $196.39 | Day: -2.98% | 1W: -3.63% | 1M: -4.01% | RSI: 45.7 | vs MA200: -0.8% | Trend: Above MA50 · Below MA20, MA200
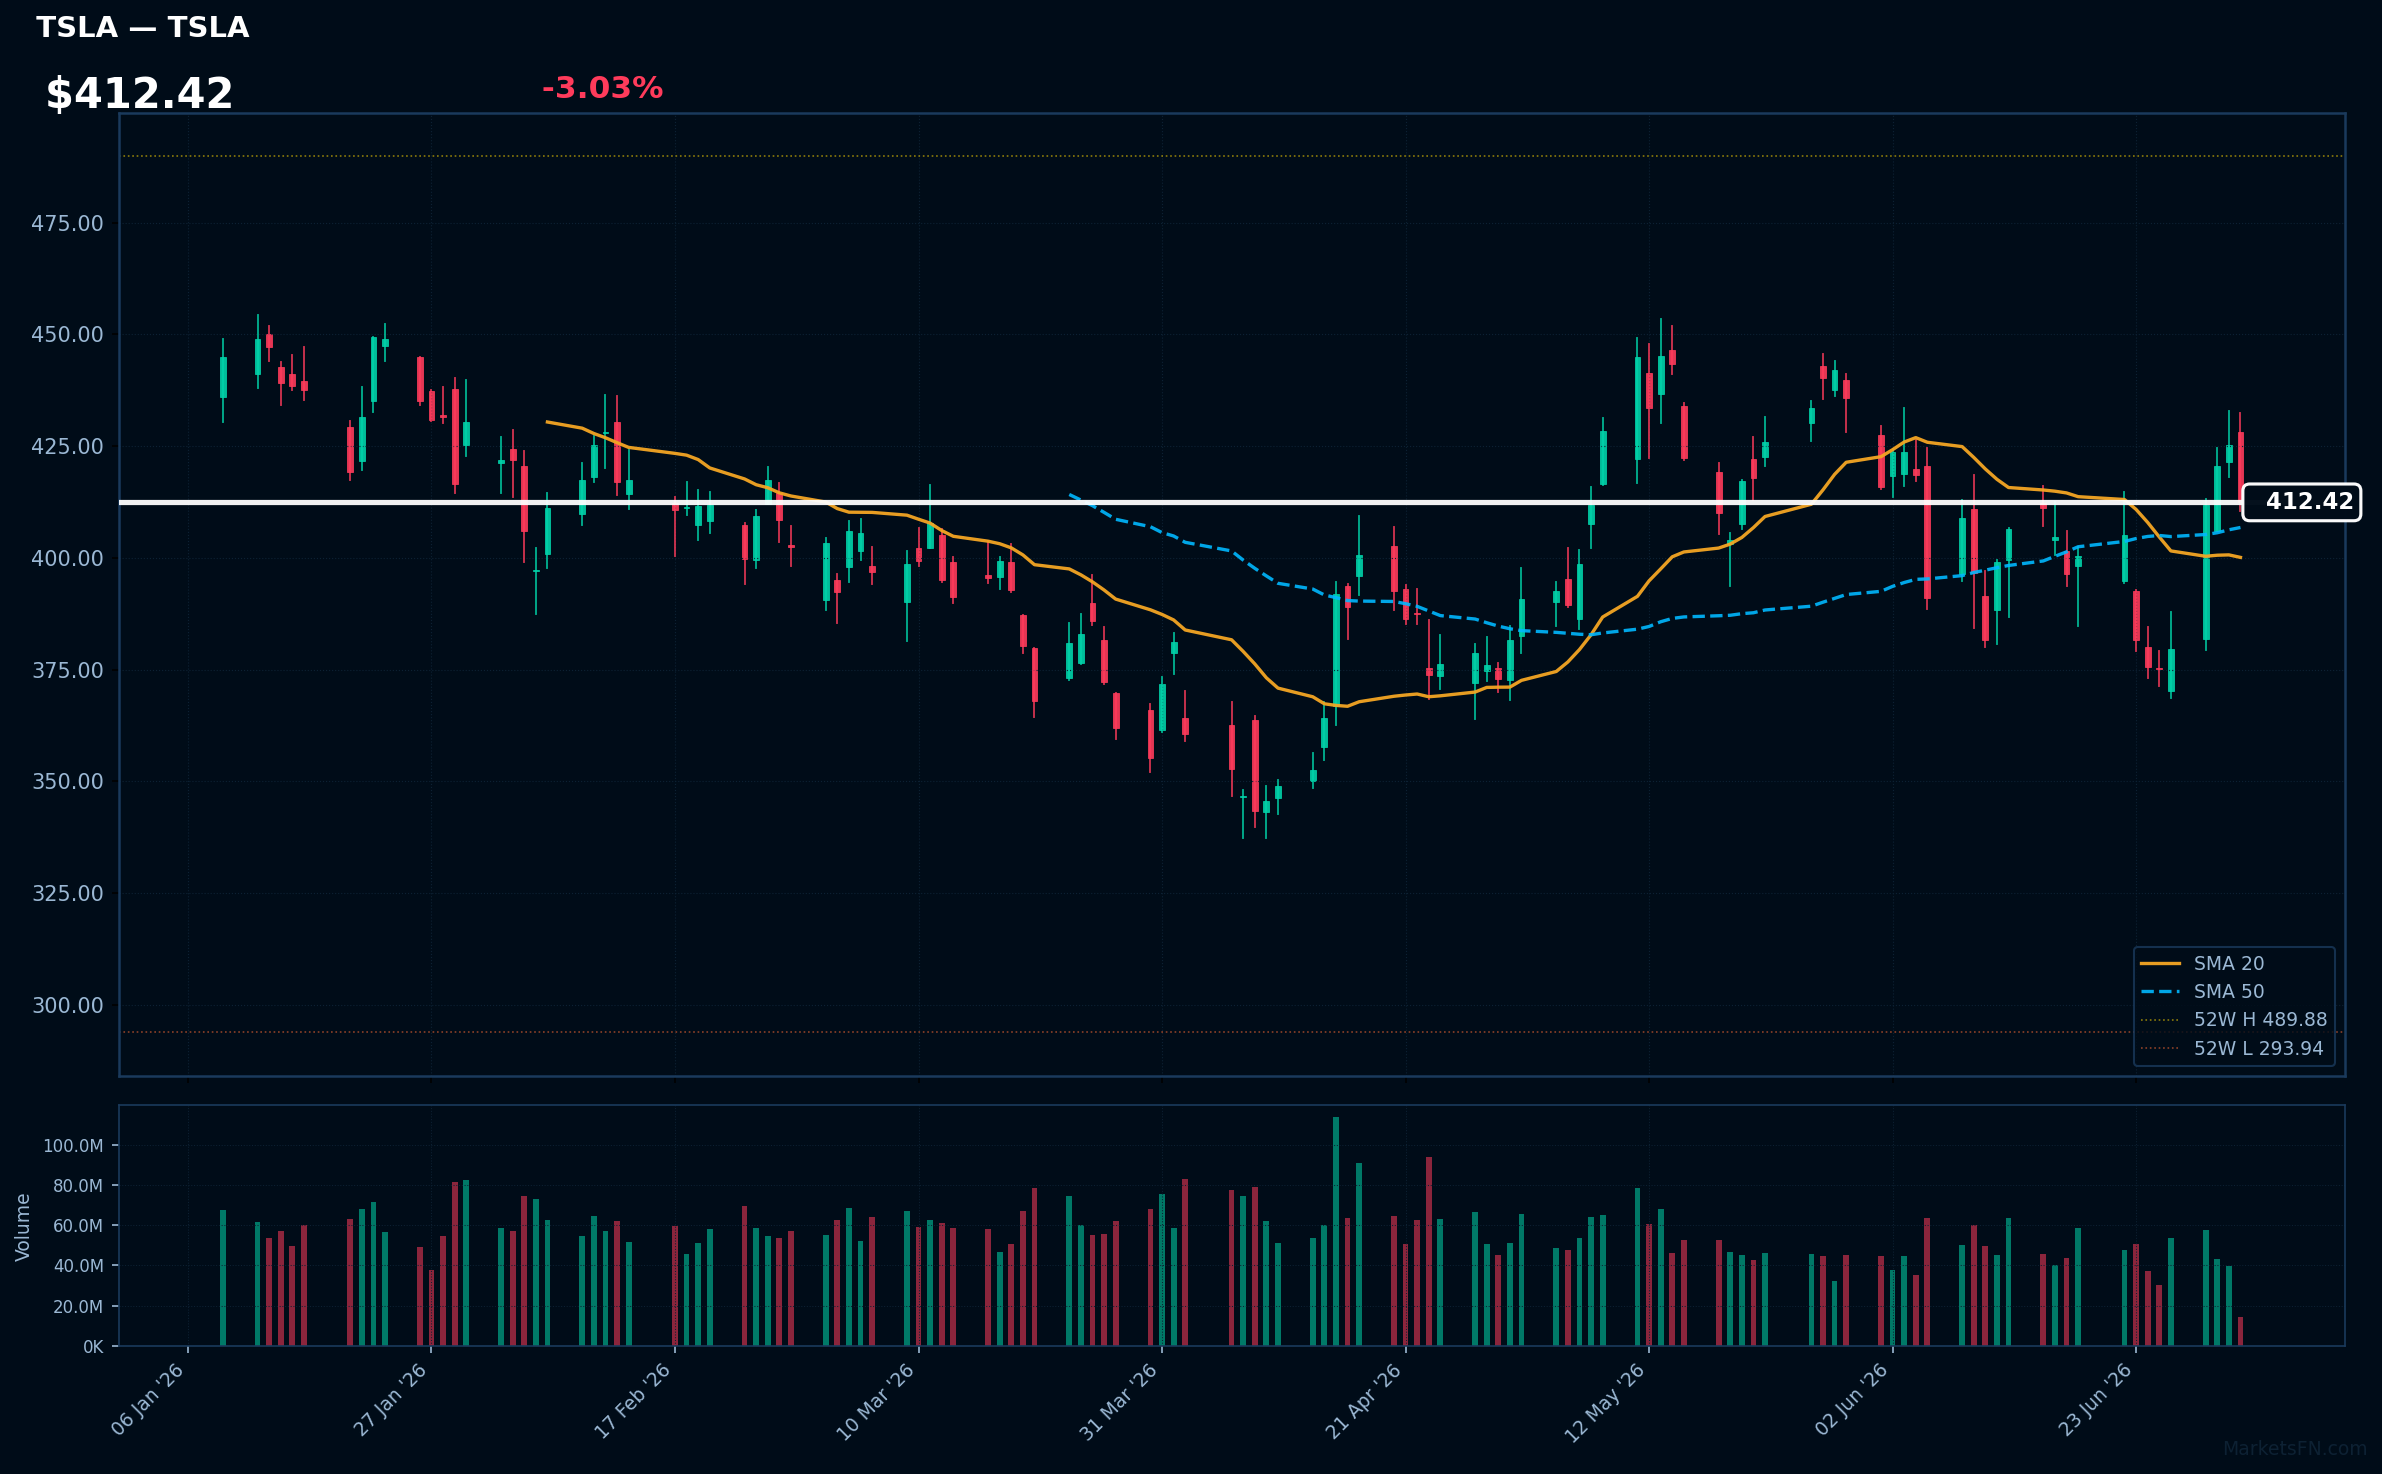
TSLA | Tesla Inc | Consumer Cyclical | Price: $412.39 | Day: -3.03% | 1W: +9.94% | 1M: -2.67% | RSI: 53.0 | vs MA200: -1.5% | Trend: Above MA20, MA50 · Below MA200
Recent headlines (last 12h)
- Tesla Eyes 3% Delivery Growth as Europe Sales Jump 57%
- Ethereum leads way as large cryptocurrencies post increases
- Rivian Stock Rises as EV Demand Rebounds on Higher Gas Prices
- Tesla Q2 deliveries crush forecasts at 480,126, erasing backlog concerns
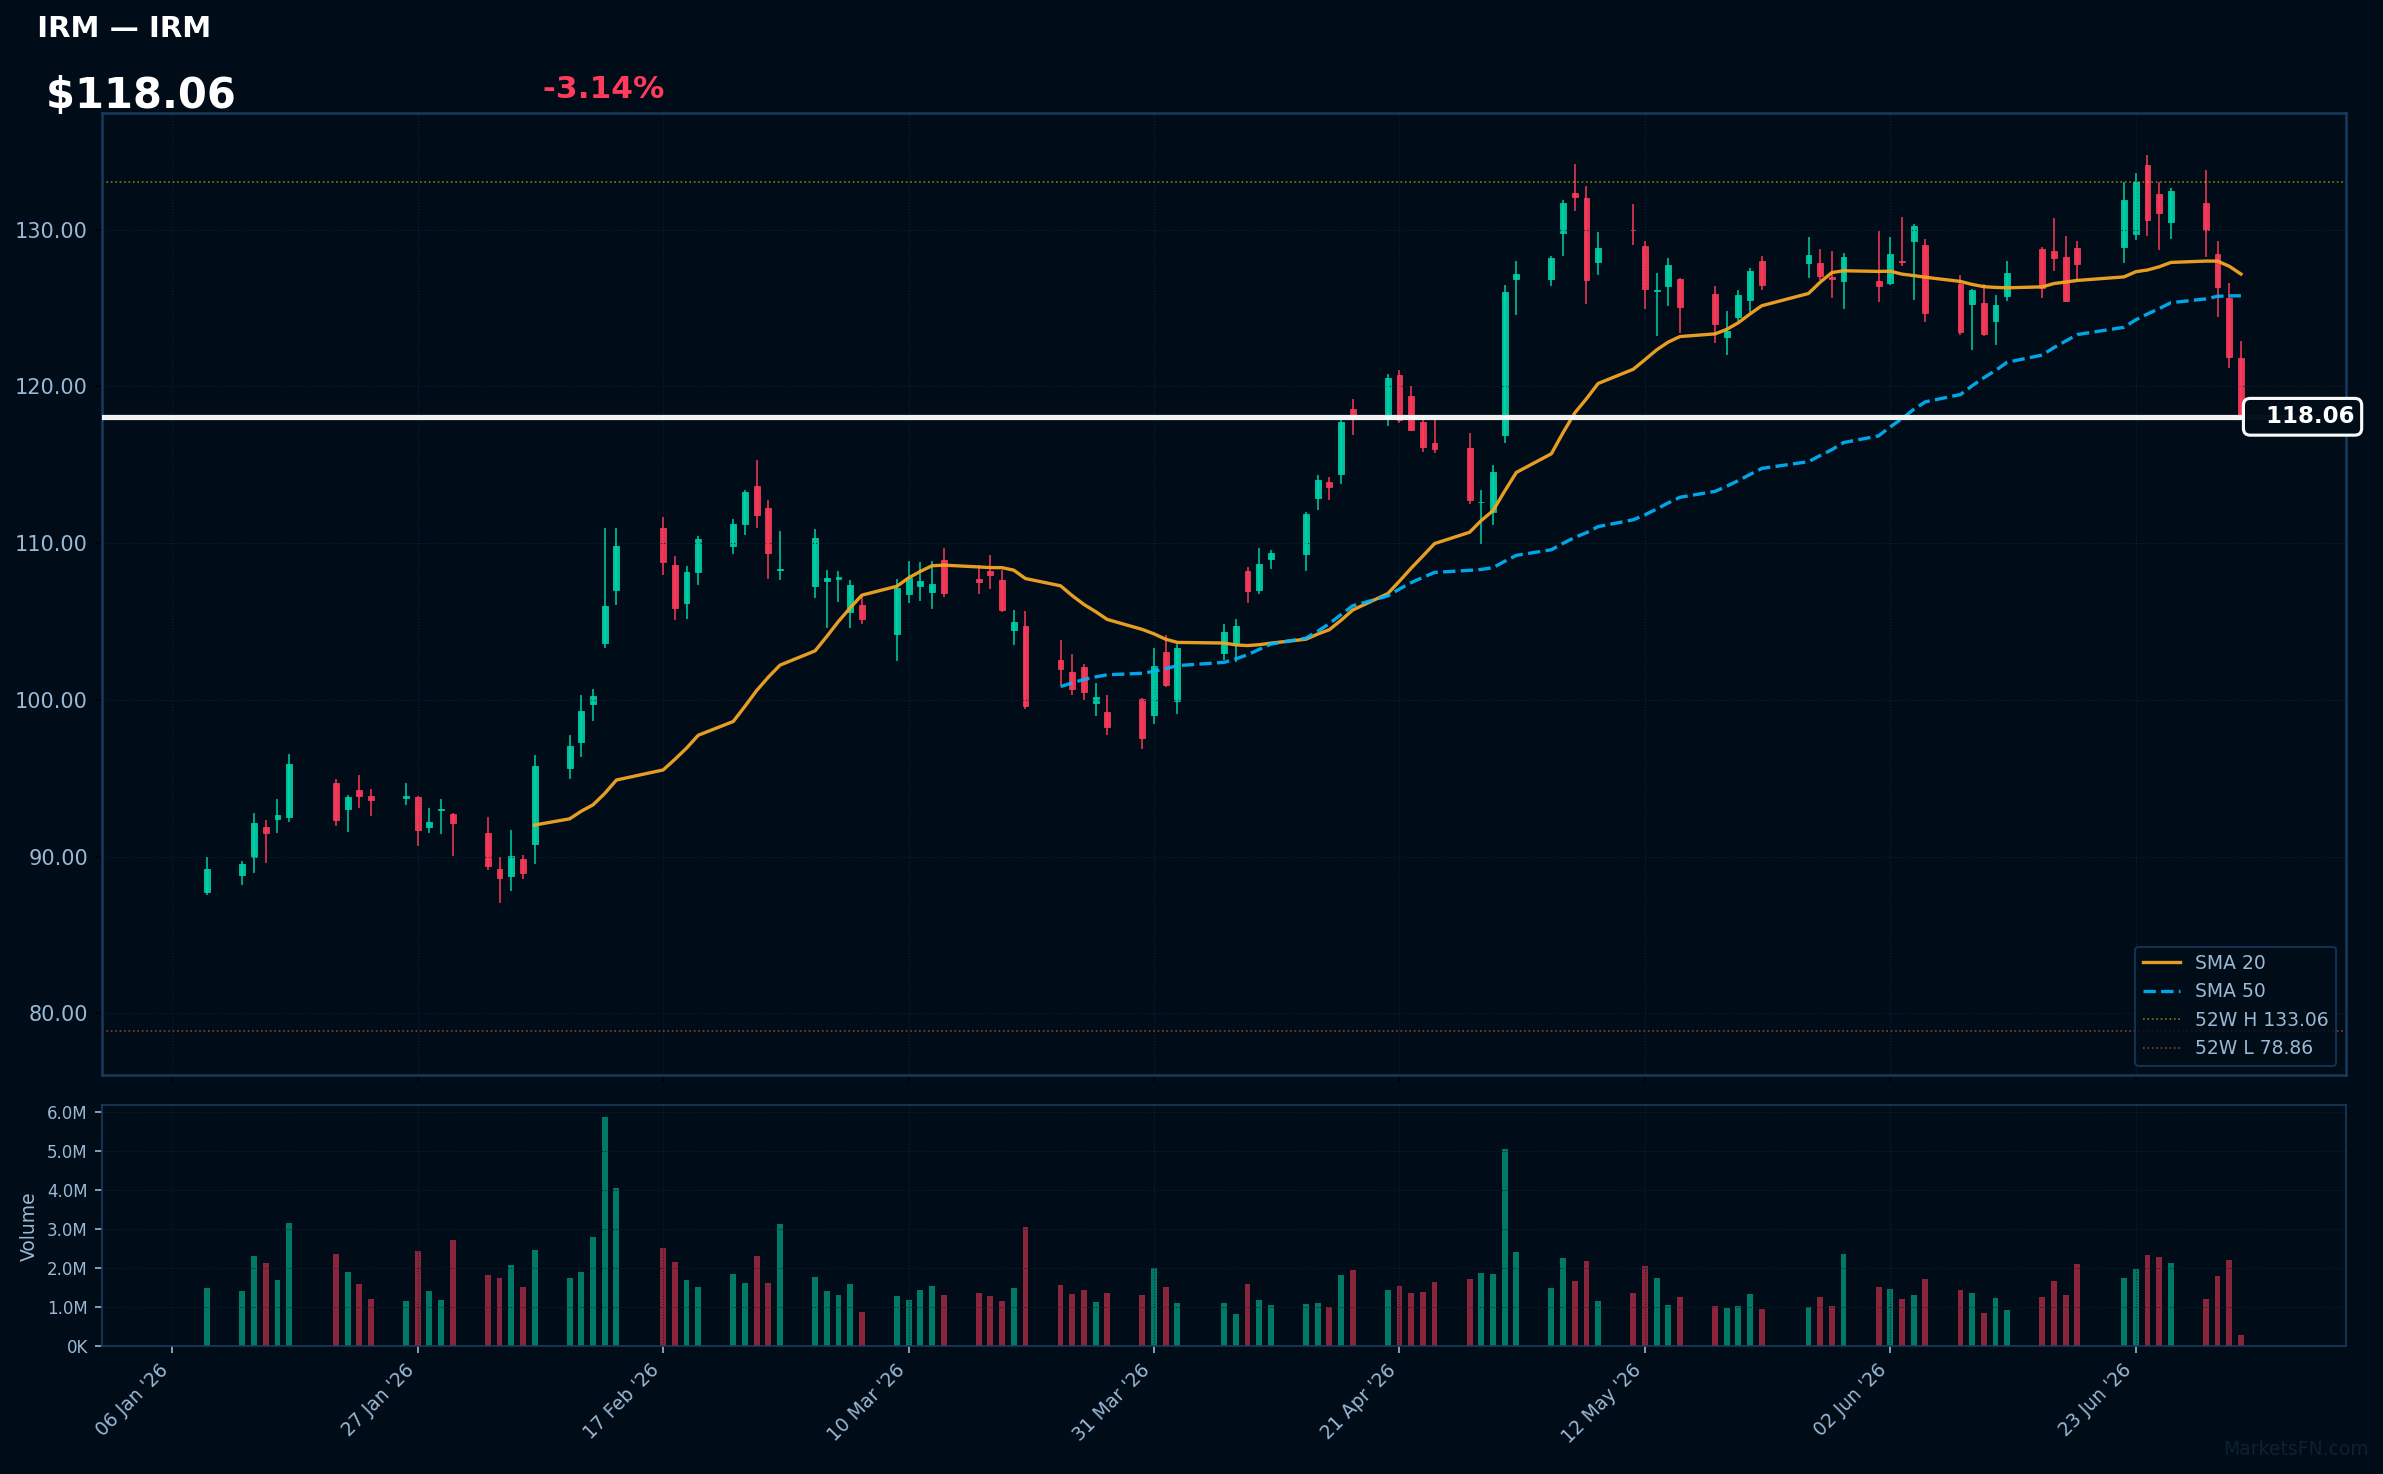
IRM | Iron Mountain Inc | Real Estate | Price: $118.07 | Day: -3.14% | 1W: -9.92% | 1M: -8.10% | RSI: 36.5 | vs MA200: +12.4% | Trend: Above MA200 · Below MA20, MA50
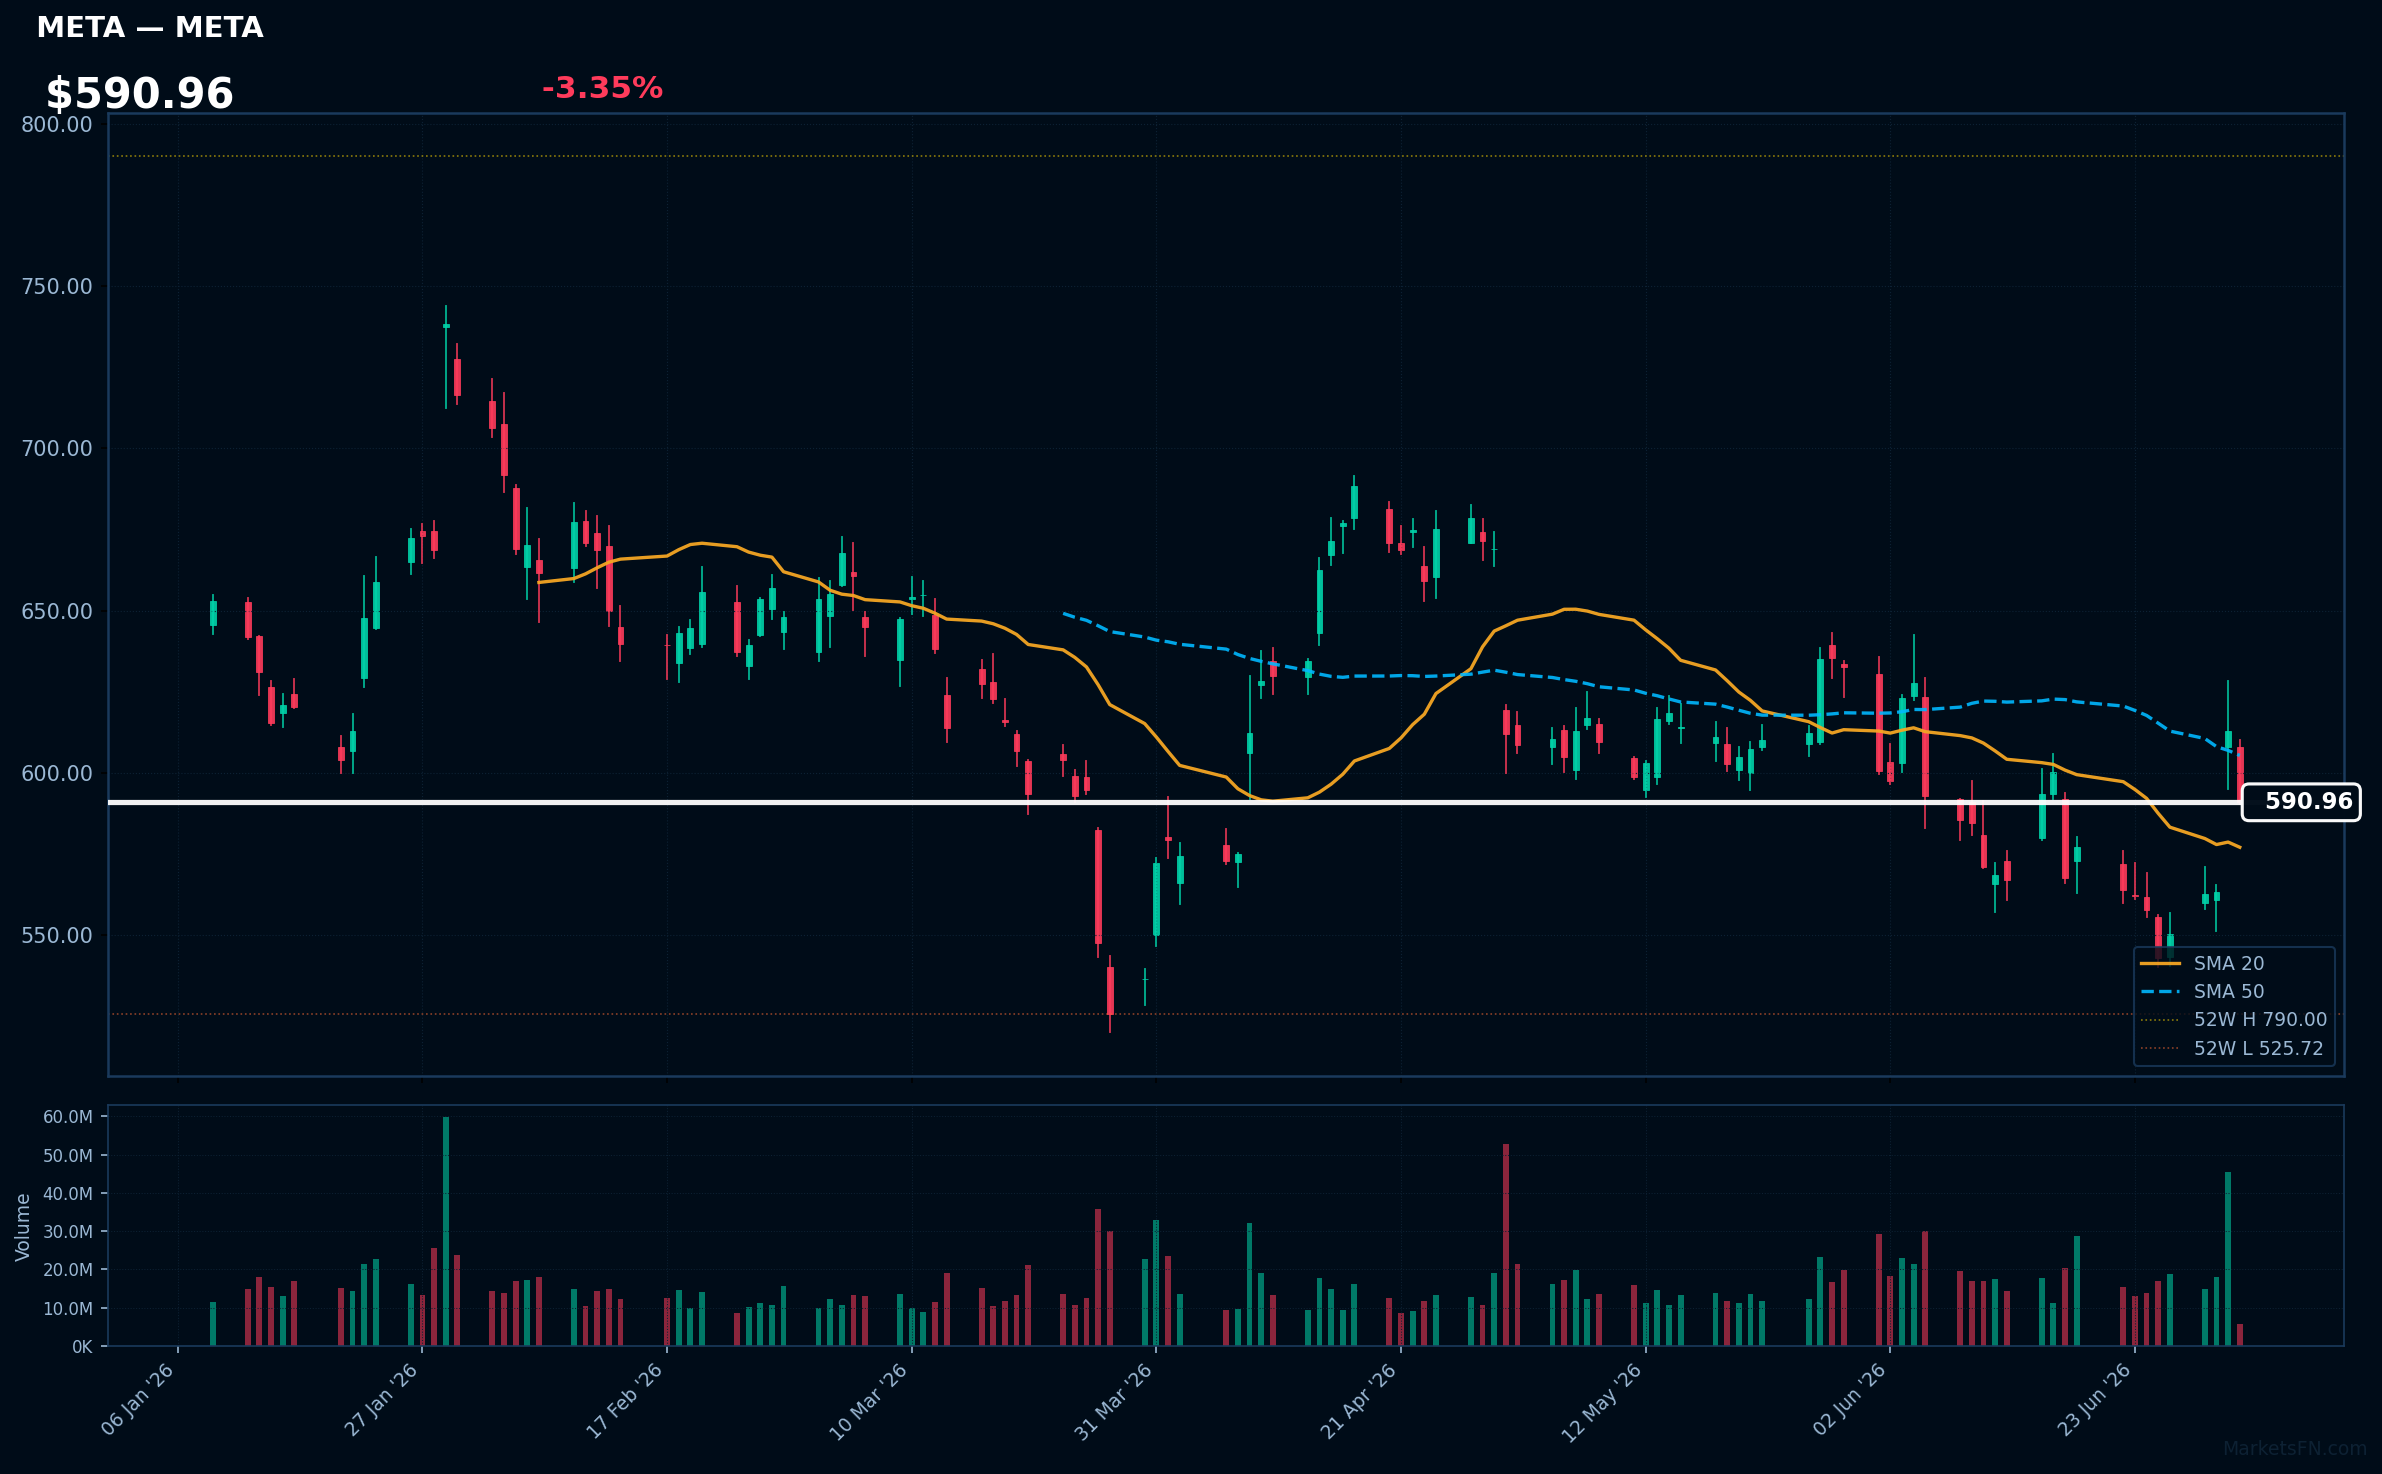
META | Meta Platforms Inc | Communication Services | Price: $592.37 | Day: -3.35% | 1W: +8.86% | 1M: -1.12% | RSI: 51.7 | vs MA200: -8.4% | Trend: Above MA20 · Below MA50, MA200
Recent headlines (last 12h)
- Morning Bid: Shares pull back as markets await likely payrolls beat
- Stock analysts may be setting up the market for a summer failure
- Why CoreWeave Stock Just Nosedived
- Meta Jumps 9.3% on Plans for AI Cloud Infrastructure Business
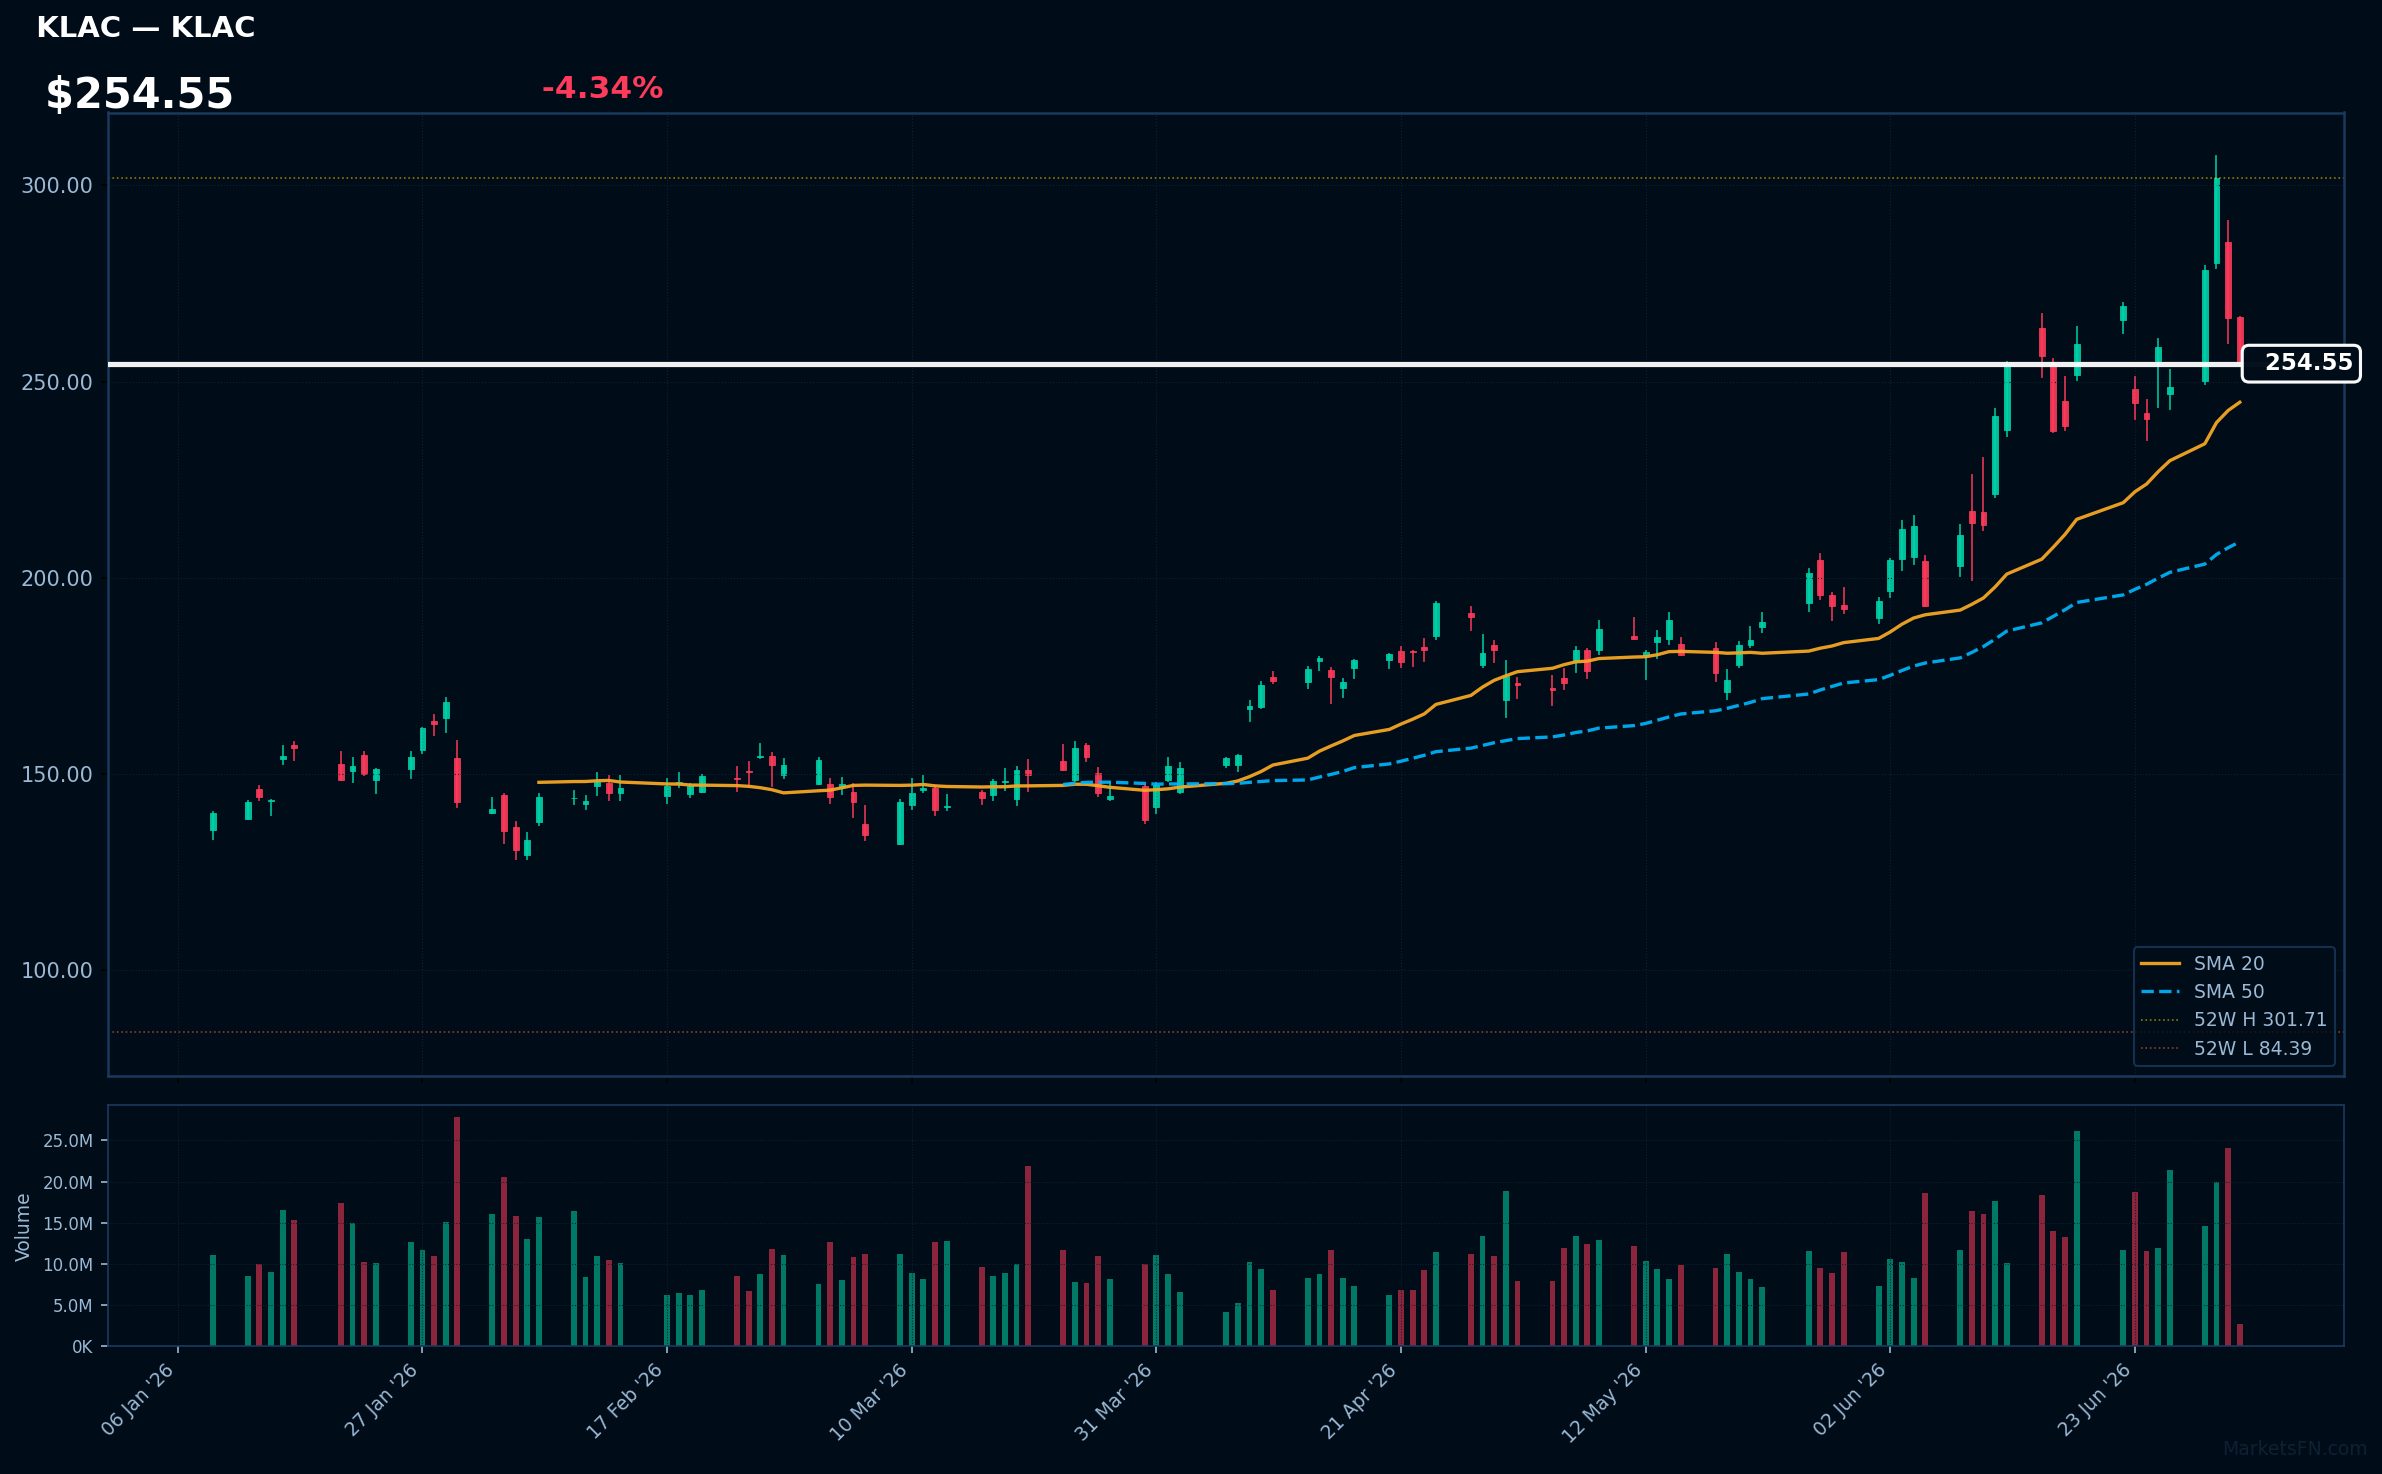
KLAC | KLA Corp | Technology | Price: $254.65 | Day: -4.34% | 1W: -1.64% | 1M: +24.46% | RSI: 54.6 | vs MA200: +67.5% | Trend: Above MA20, MA50, MA200
Market Commentary
Today's S&P 500 session reflects a strong bullish tone, with 357 advancing stocks (72.1%) compared to 136 declining stocks (27.5%). This breadth indicates robust market participation, as the average daily change of +0.67% suggests a positive sentiment among investors. However, only 9 stocks (1.8%) are above their 200-day moving average, signaling potential caution for those looking for sustained momentum.
Sector rotation is evident, with top gainers like MRNA, COIN, and UHS leading the charge in Healthcare and Technology, while the losers, including TSLA and META, primarily hail from Communication Services and Consumer Cyclical sectors. This shift could indicate a market preference for defensive and growth-oriented stocks, as investors reassess their risk appetites amidst broader economic uncertainties.
Traders should keep an eye on key risk levels, particularly the performance of stocks above their 200-day moving average. A failure to increase this number could signal a weakening trend, while a breakout above these levels could confirm bullish momentum. Additionally, monitoring the performance of the top gainers and losers will provide insights into sector strength and potential reversals.
Methodology
Daily ranking uses the latest session close versus the prior close. RSI (14-day EWM), MA20, MA50, and MA200 are computed from 12 months of daily OHLCV data sourced from Yahoo Finance. Charts show the last 120 trading sessions with SMA 20/50, 52-week H/L markers, and volume. Recent news (last 12 h) is sourced from FinViz. Updated every trading day.
Disclaimer
The content on MarketsFN.com is provided for educational and informational purposes only. It does not constitute financial advice, investment recommendations, or trading guidance. All investments involve risks, and past performance does not guarantee future results. You are solely responsible for your investment decisions and should conduct independent research and consult a qualified financial advisor before acting. MarketsFN.com and its authors are not liable for any losses or damages arising from your use of this information.
Related Articles
- Nasdaq 100 52-Week Highs & Lows Radar: Linde Plc (LIN), Copart, (CPRT) and more — Nasdaq 100 stocks nearest to their 52-week high and low. Bloomberg-style charts, RSI/MA analysis and Grok commentary.
- S&P 500 52-Week Highs & Lows Radar: GE Aerospace (GE), VICI Properties (VICI) and more — S&P 500 stocks nearest to their 52-week high and low. Bloomberg-style charts, RSI/MA analysis and Grok commentary.
- Nasdaq 100 2026 YTD Highs & Lows Radar: Linde Plc (LIN), Constellation Energyoration (CEG) and more — Nasdaq 100 stocks nearest to their 2026 year-to-date high and low. Bloomberg-style charts, RSI/MA analysis and Grok…
- S&P 500 2026 YTD Highs & Lows Radar: Bank Of America (BAC), Walmart (WMT) and more — S&P 500 stocks nearest to their 2026 year-to-date high and low. Bloomberg-style charts, RSI/MA analysis and Grok…
- Lindsay Corporation (LNN) Q3 2026 Financial Results Summary — Lindsay Corporation (LNN) Q3 2026: Revenue Decline Amid Market Challenges — Disappointing Quarter Lindsay Corporation…