S&P 500 Bull & Bear Radar — June 23, 2026
· Stocks · QuoteReporter
S&P 500 Bull & Bear Radar — June 23, 2026
A daily technical sweep of 496 S&P 500 constituents ranked by session performance, enriched with RSI, MA20/MA50/MA200 trend signals, Bloomberg-style charts, and recent news.
Index-Wide Breadth
| Constituents tracked | 496 |
| Advancing | 314 (63.3%) |
| Declining | 182 (36.7%) |
| Average daily change | +0.09% |
| Above MA200 | 13 (2.6%) |
Top 10 Gainers
Today's strongest S&P 500 performers. Sector leadership: Healthcare (2), Technology (2), Financial (2), Consumer Cyclical (2), Industrials (1), Consumer Defensive (1).
| Ticker | Company | Sector | Price | Day % | 1W % | 1M % | RSI | vs MA200 | Trend |
|---|---|---|---|---|---|---|---|---|---|
| MRNA | Moderna Inc | Healthcare | $63.47 | +6.94% | +21.74% | +34.29% | 68.2 | +60.3% | Above MA20, MA50, MA200 |
| AXON | Axon Enterprise Inc | Industrials | $434.27 | +5.91% | -1.98% | +11.44% | 50.2 | -19.8% | Above MA50 · Below MA20, MA200 |
| CDW | CDW Corp | Technology | $129.85 | +5.08% | -1.10% | +21.49% | 54.1 | -4.6% | Above MA20, MA50 · Below MA200 |
| IBM | International Business Machines Corp | Technology | $263.56 | +4.50% | -2.00% | +4.10% | 49.6 | -3.7% | Above MA50 · Below MA20, MA200 |
| COR | Cencora Inc | Healthcare | $281.51 | +3.77% | +0.04% | +6.07% | 54.7 | -13.3% | Above MA20 · Below MA50, MA200 |
| AJG | Arthur J. Gallagher & Co | Financial | $216.84 | +3.71% | +0.51% | +4.55% | 56.3 | -10.5% | Above MA20, MA50 · Below MA200 |
| BALL | Ball Corp | Consumer Cyclical | $60.33 | +3.66% | +5.21% | +7.08% | 68.0 | +8.8% | Above MA20, MA50, MA200 |
| BRO | Brown & Brown, Inc | Financial | $60.29 | +3.52% | +1.70% | +3.02% | 55.8 | -18.9% | Above MA20, MA50 · Below MA200 |
| AZO | Autozone Inc | Consumer Cyclical | $3051.85 | +3.49% | -1.69% | -11.21% | 42.5 | -16.0% | Below MA20, MA50, MA200 |
| TGT | Target Corp | Consumer Defensive | $134.24 | +3.47% | +0.80% | +6.41% | 60.0 | +24.4% | Above MA20, MA50, MA200 |
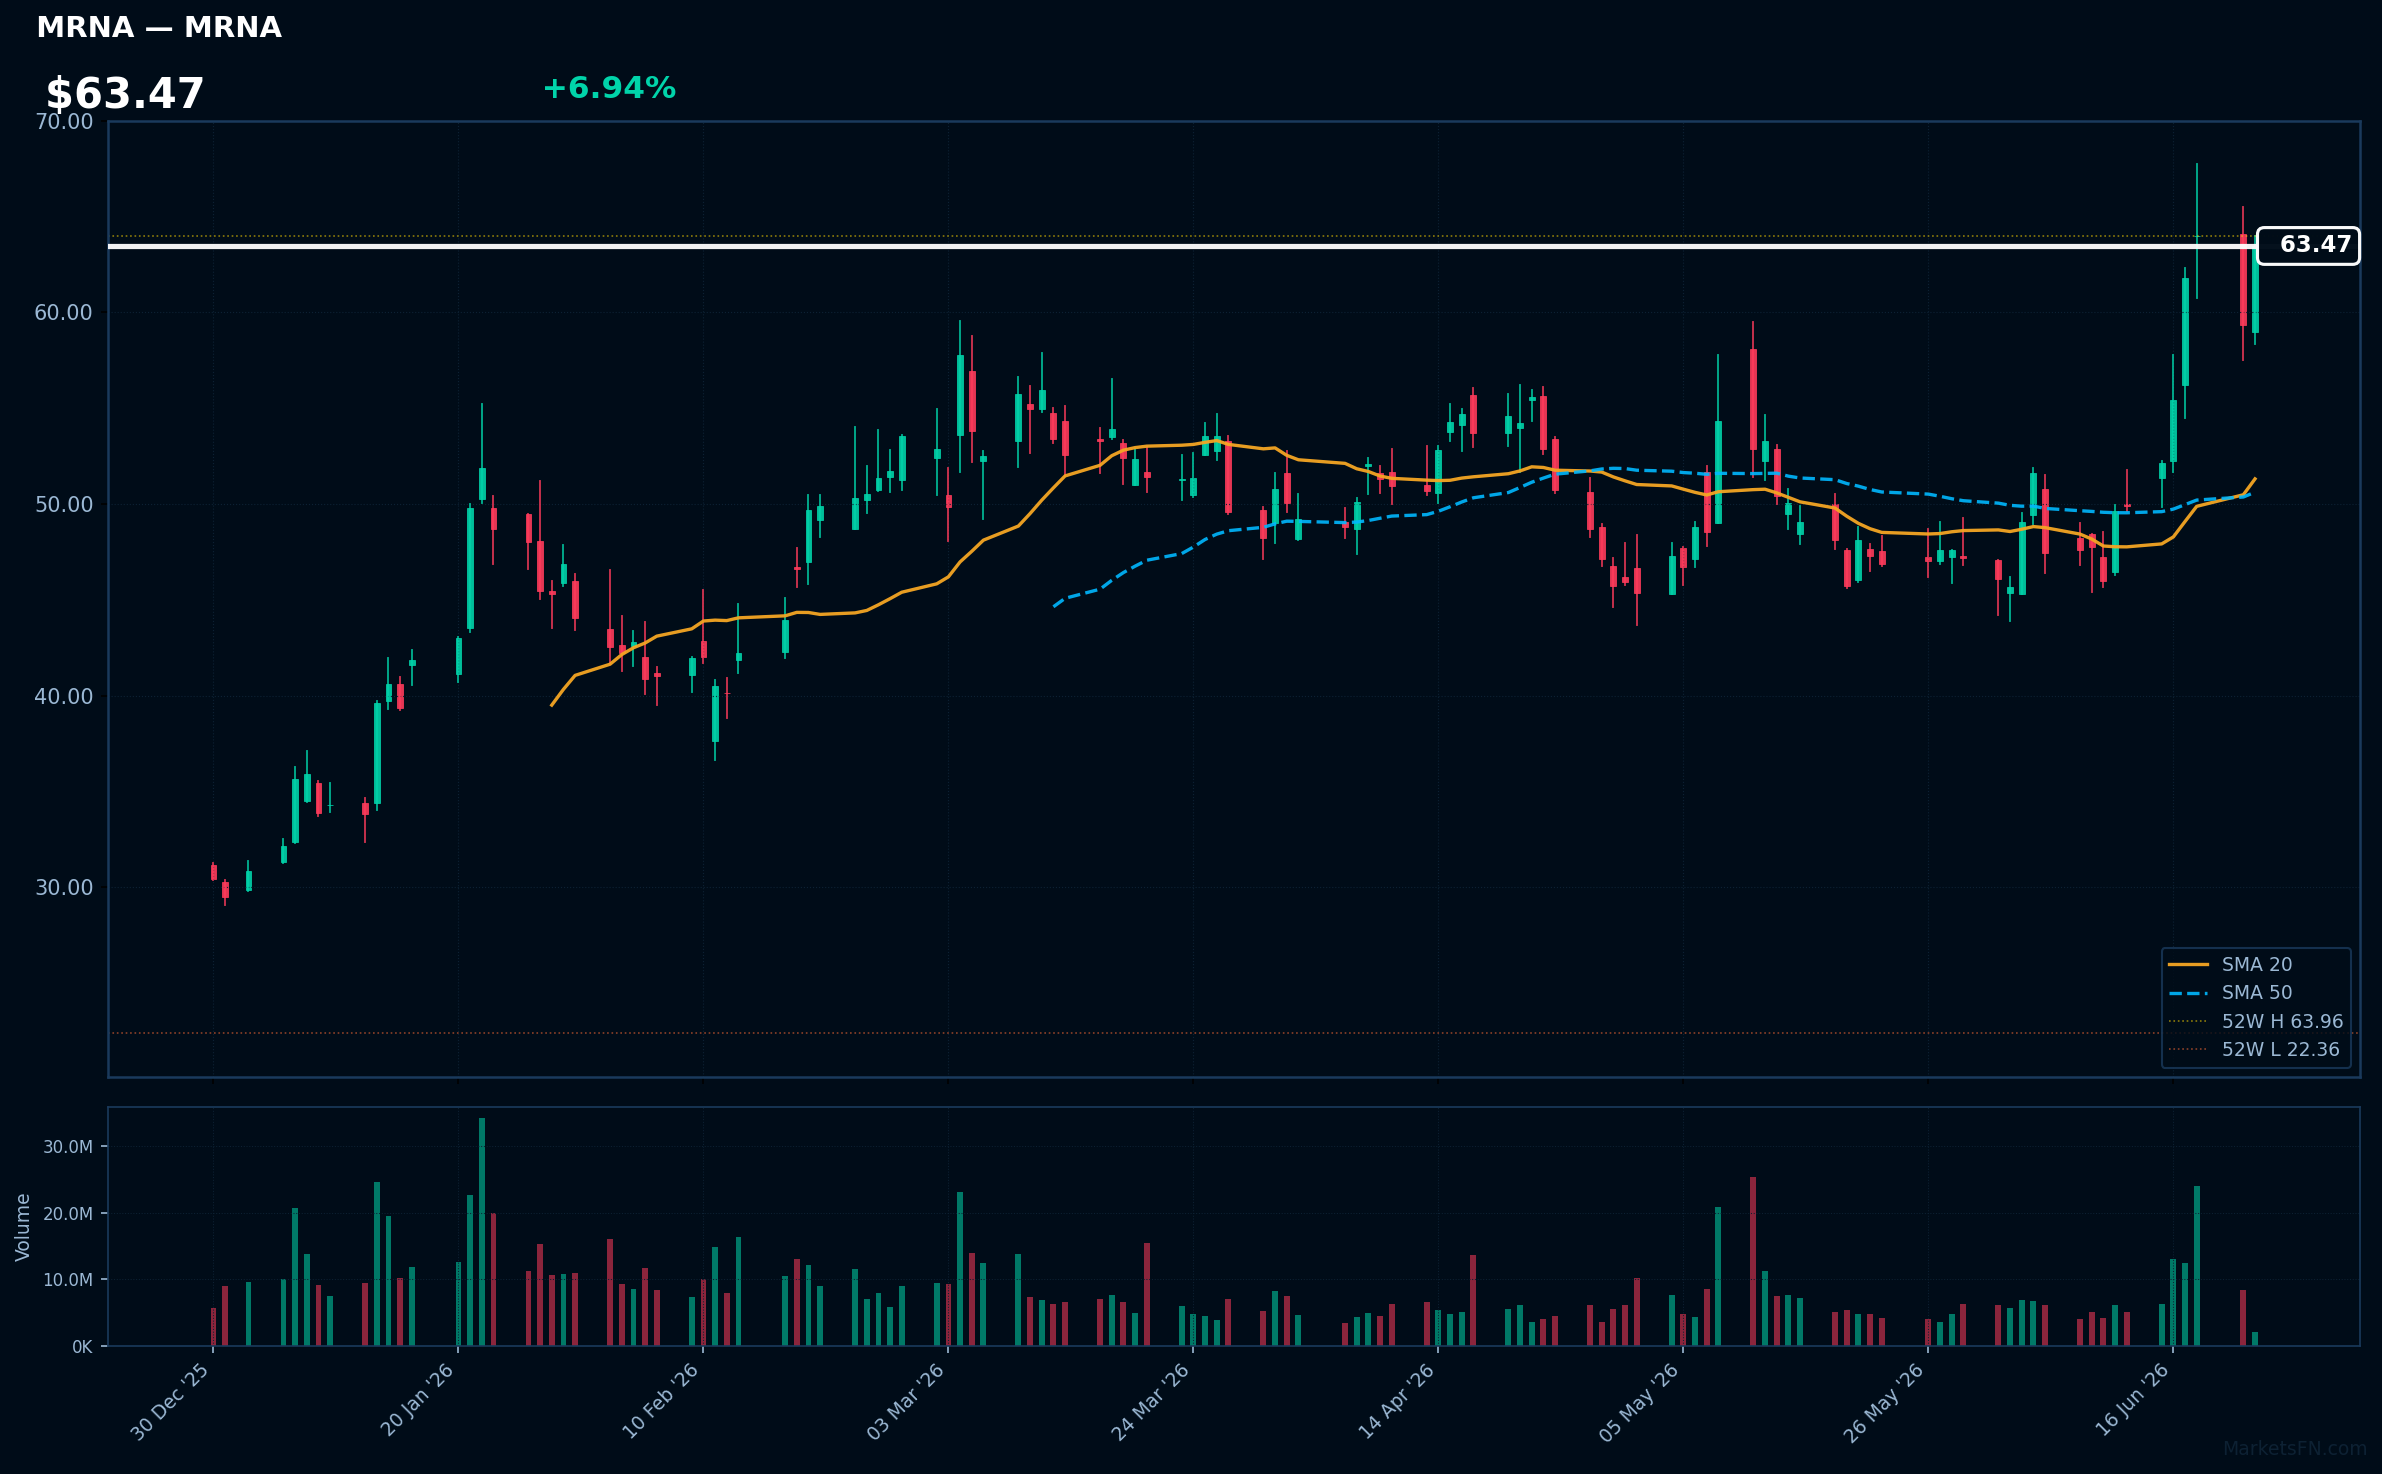
MRNA | Moderna Inc | Healthcare | Price: $63.47 | Day: +6.94% | 1W: +21.74% | 1M: +34.29% | RSI: 68.2 | vs MA200: +60.3% | Trend: Above MA20, MA50, MA200
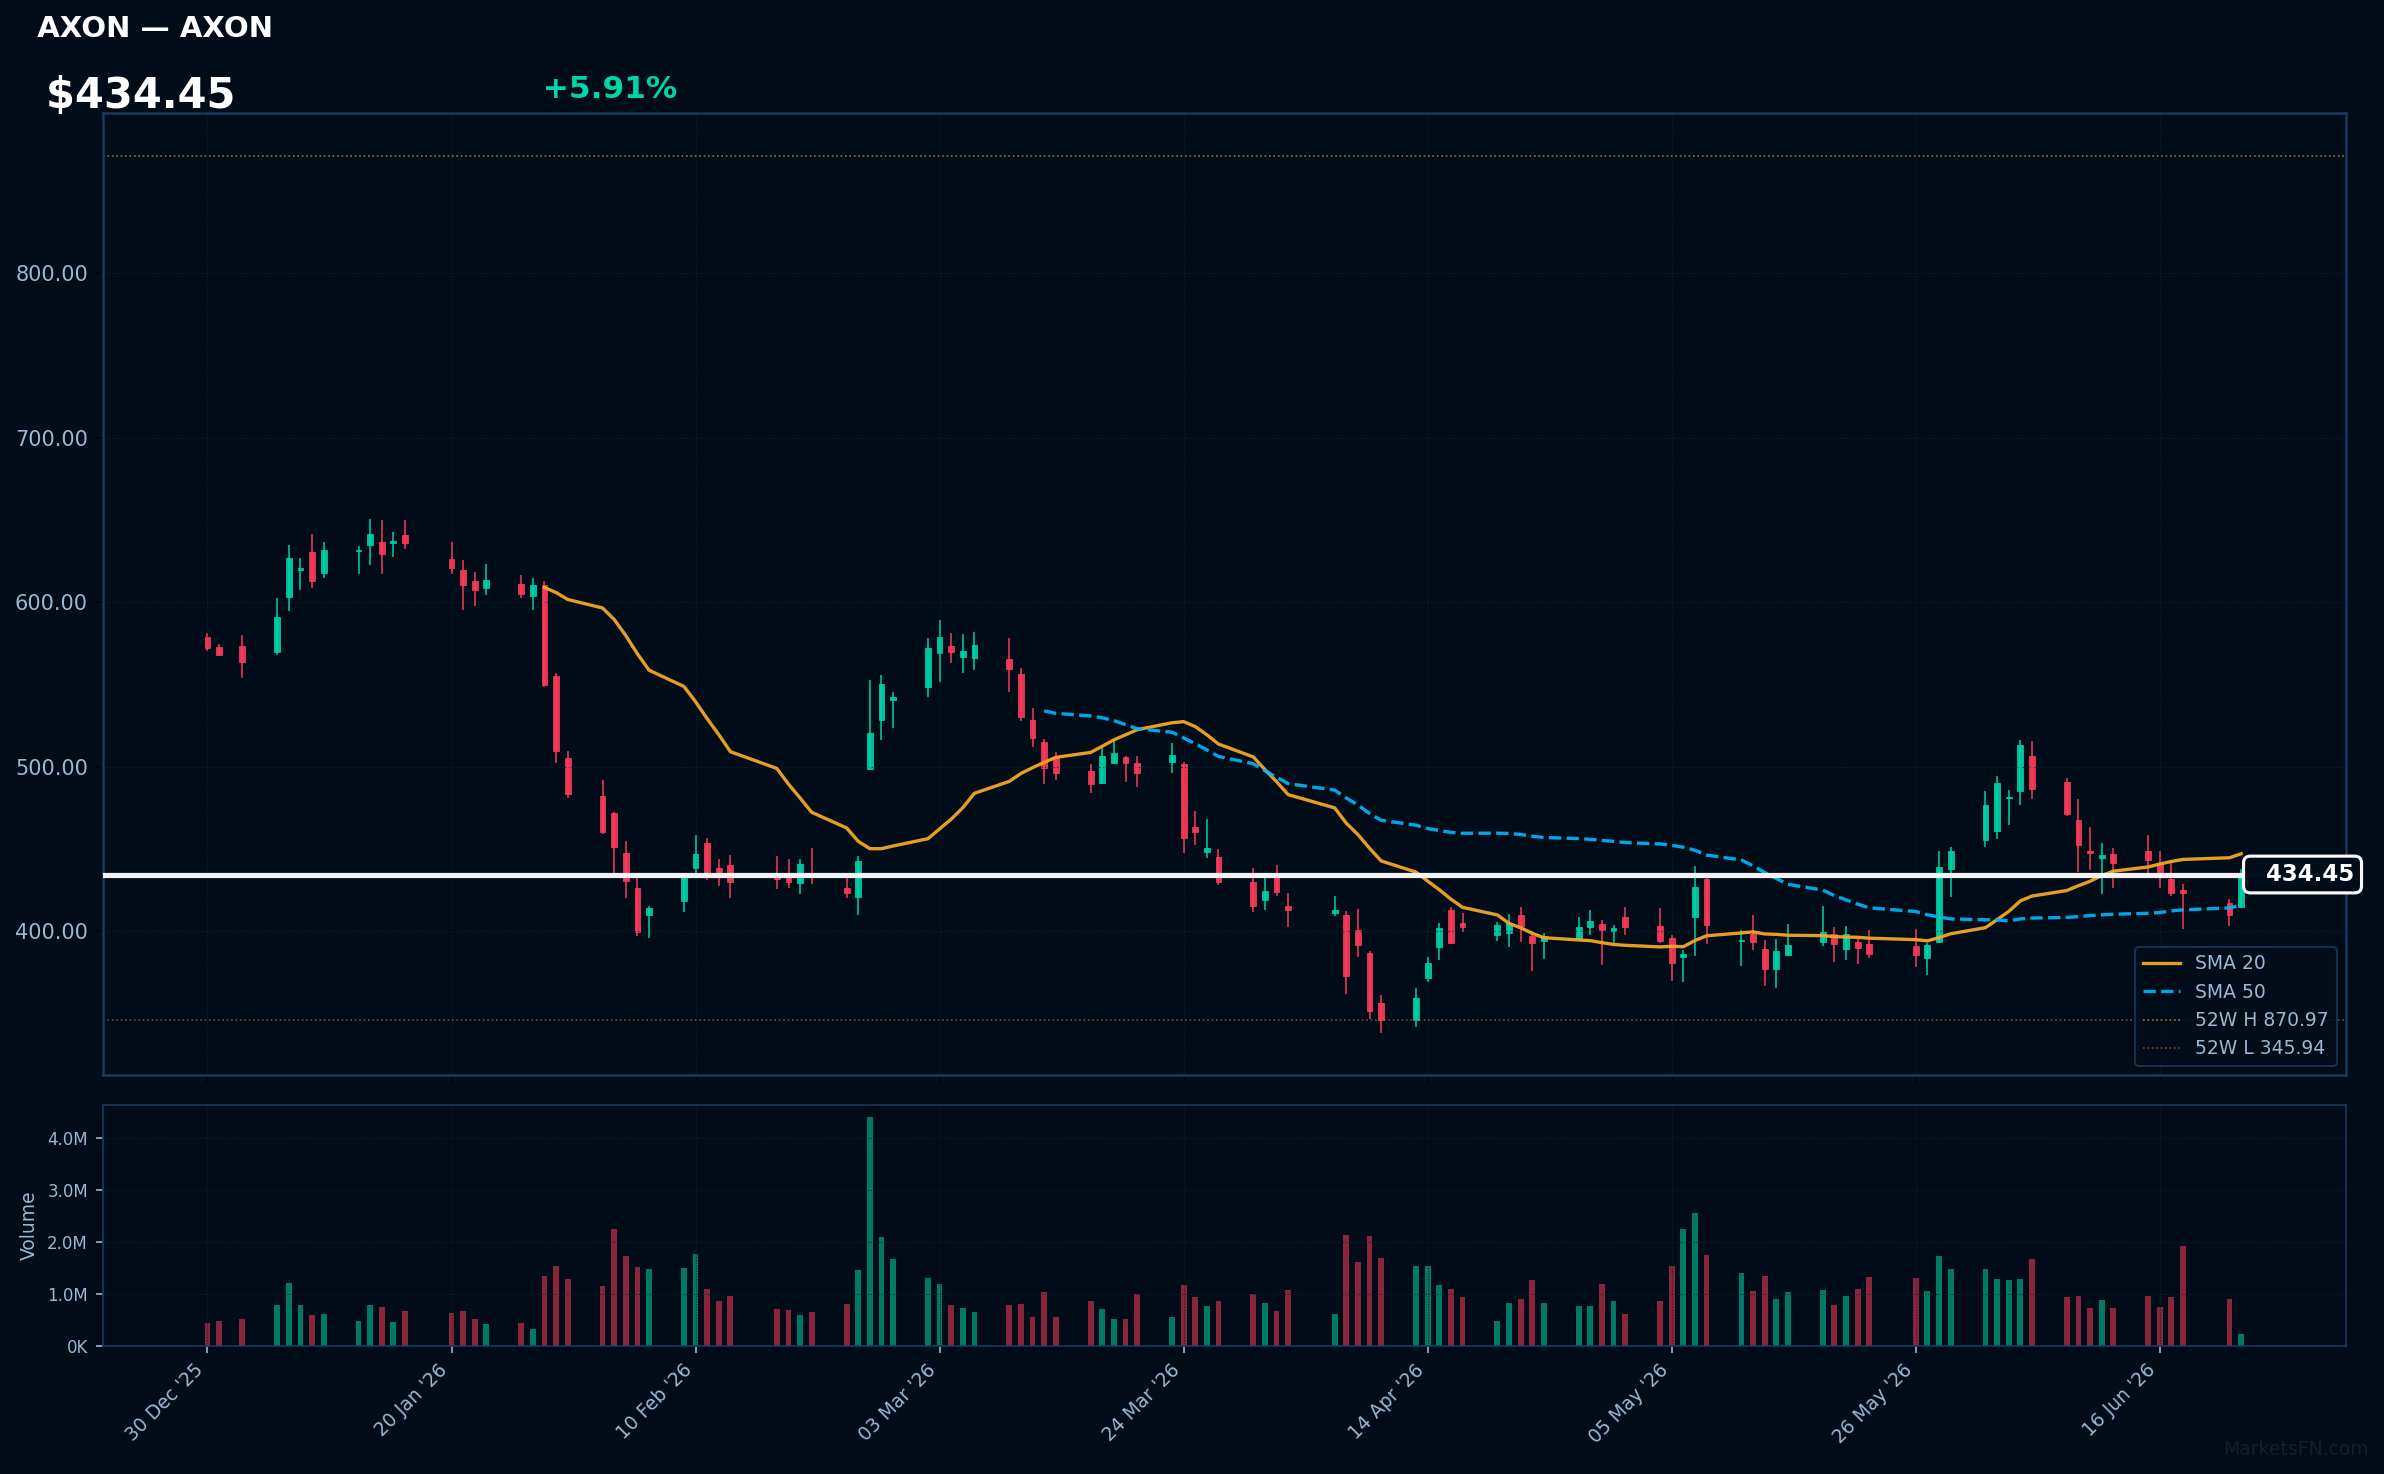
AXON | Axon Enterprise Inc | Industrials | Price: $434.27 | Day: +5.91% | 1W: -1.98% | 1M: +11.44% | RSI: 50.2 | vs MA200: -19.8% | Trend: Above MA50 · Below MA20, MA200
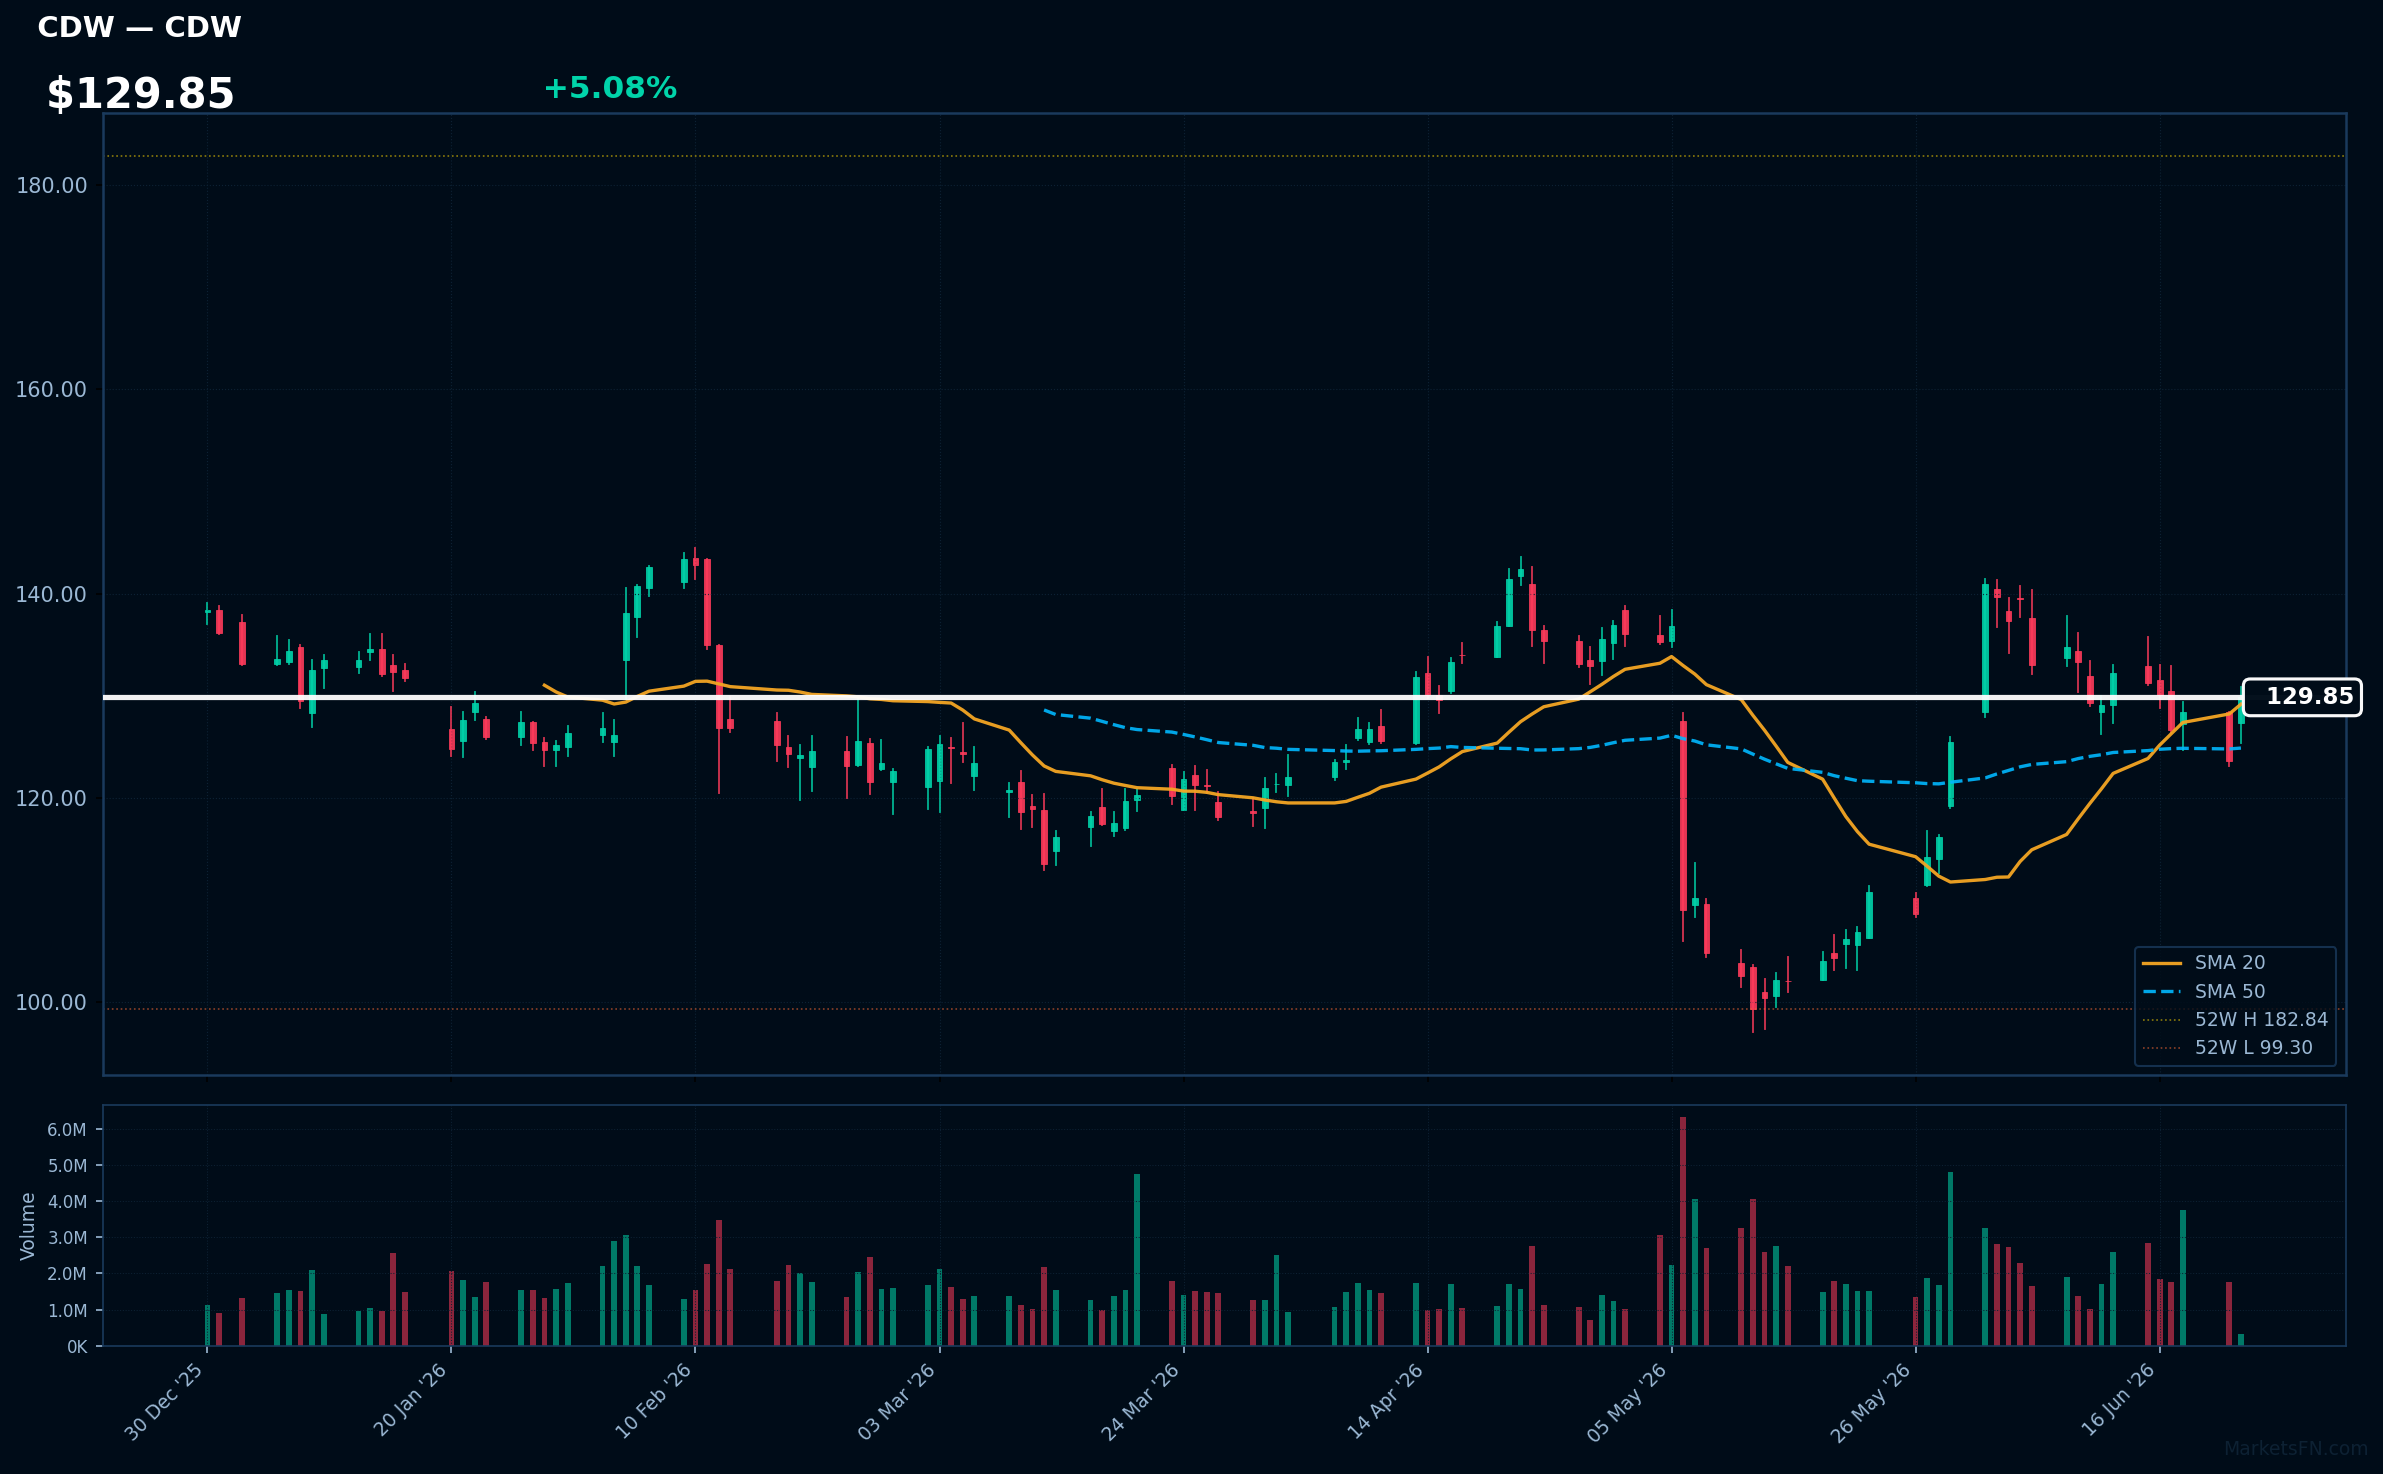
CDW | CDW Corp | Technology | Price: $129.85 | Day: +5.08% | 1W: -1.10% | 1M: +21.49% | RSI: 54.1 | vs MA200: -4.6% | Trend: Above MA20, MA50 · Below MA200
Recent headlines (last 12h)
- Morgan Stanley upgrades CDW on stronger AI-driven server demand
- IBM upgrade, SpaceX initiation among today's top calls on Wall Street
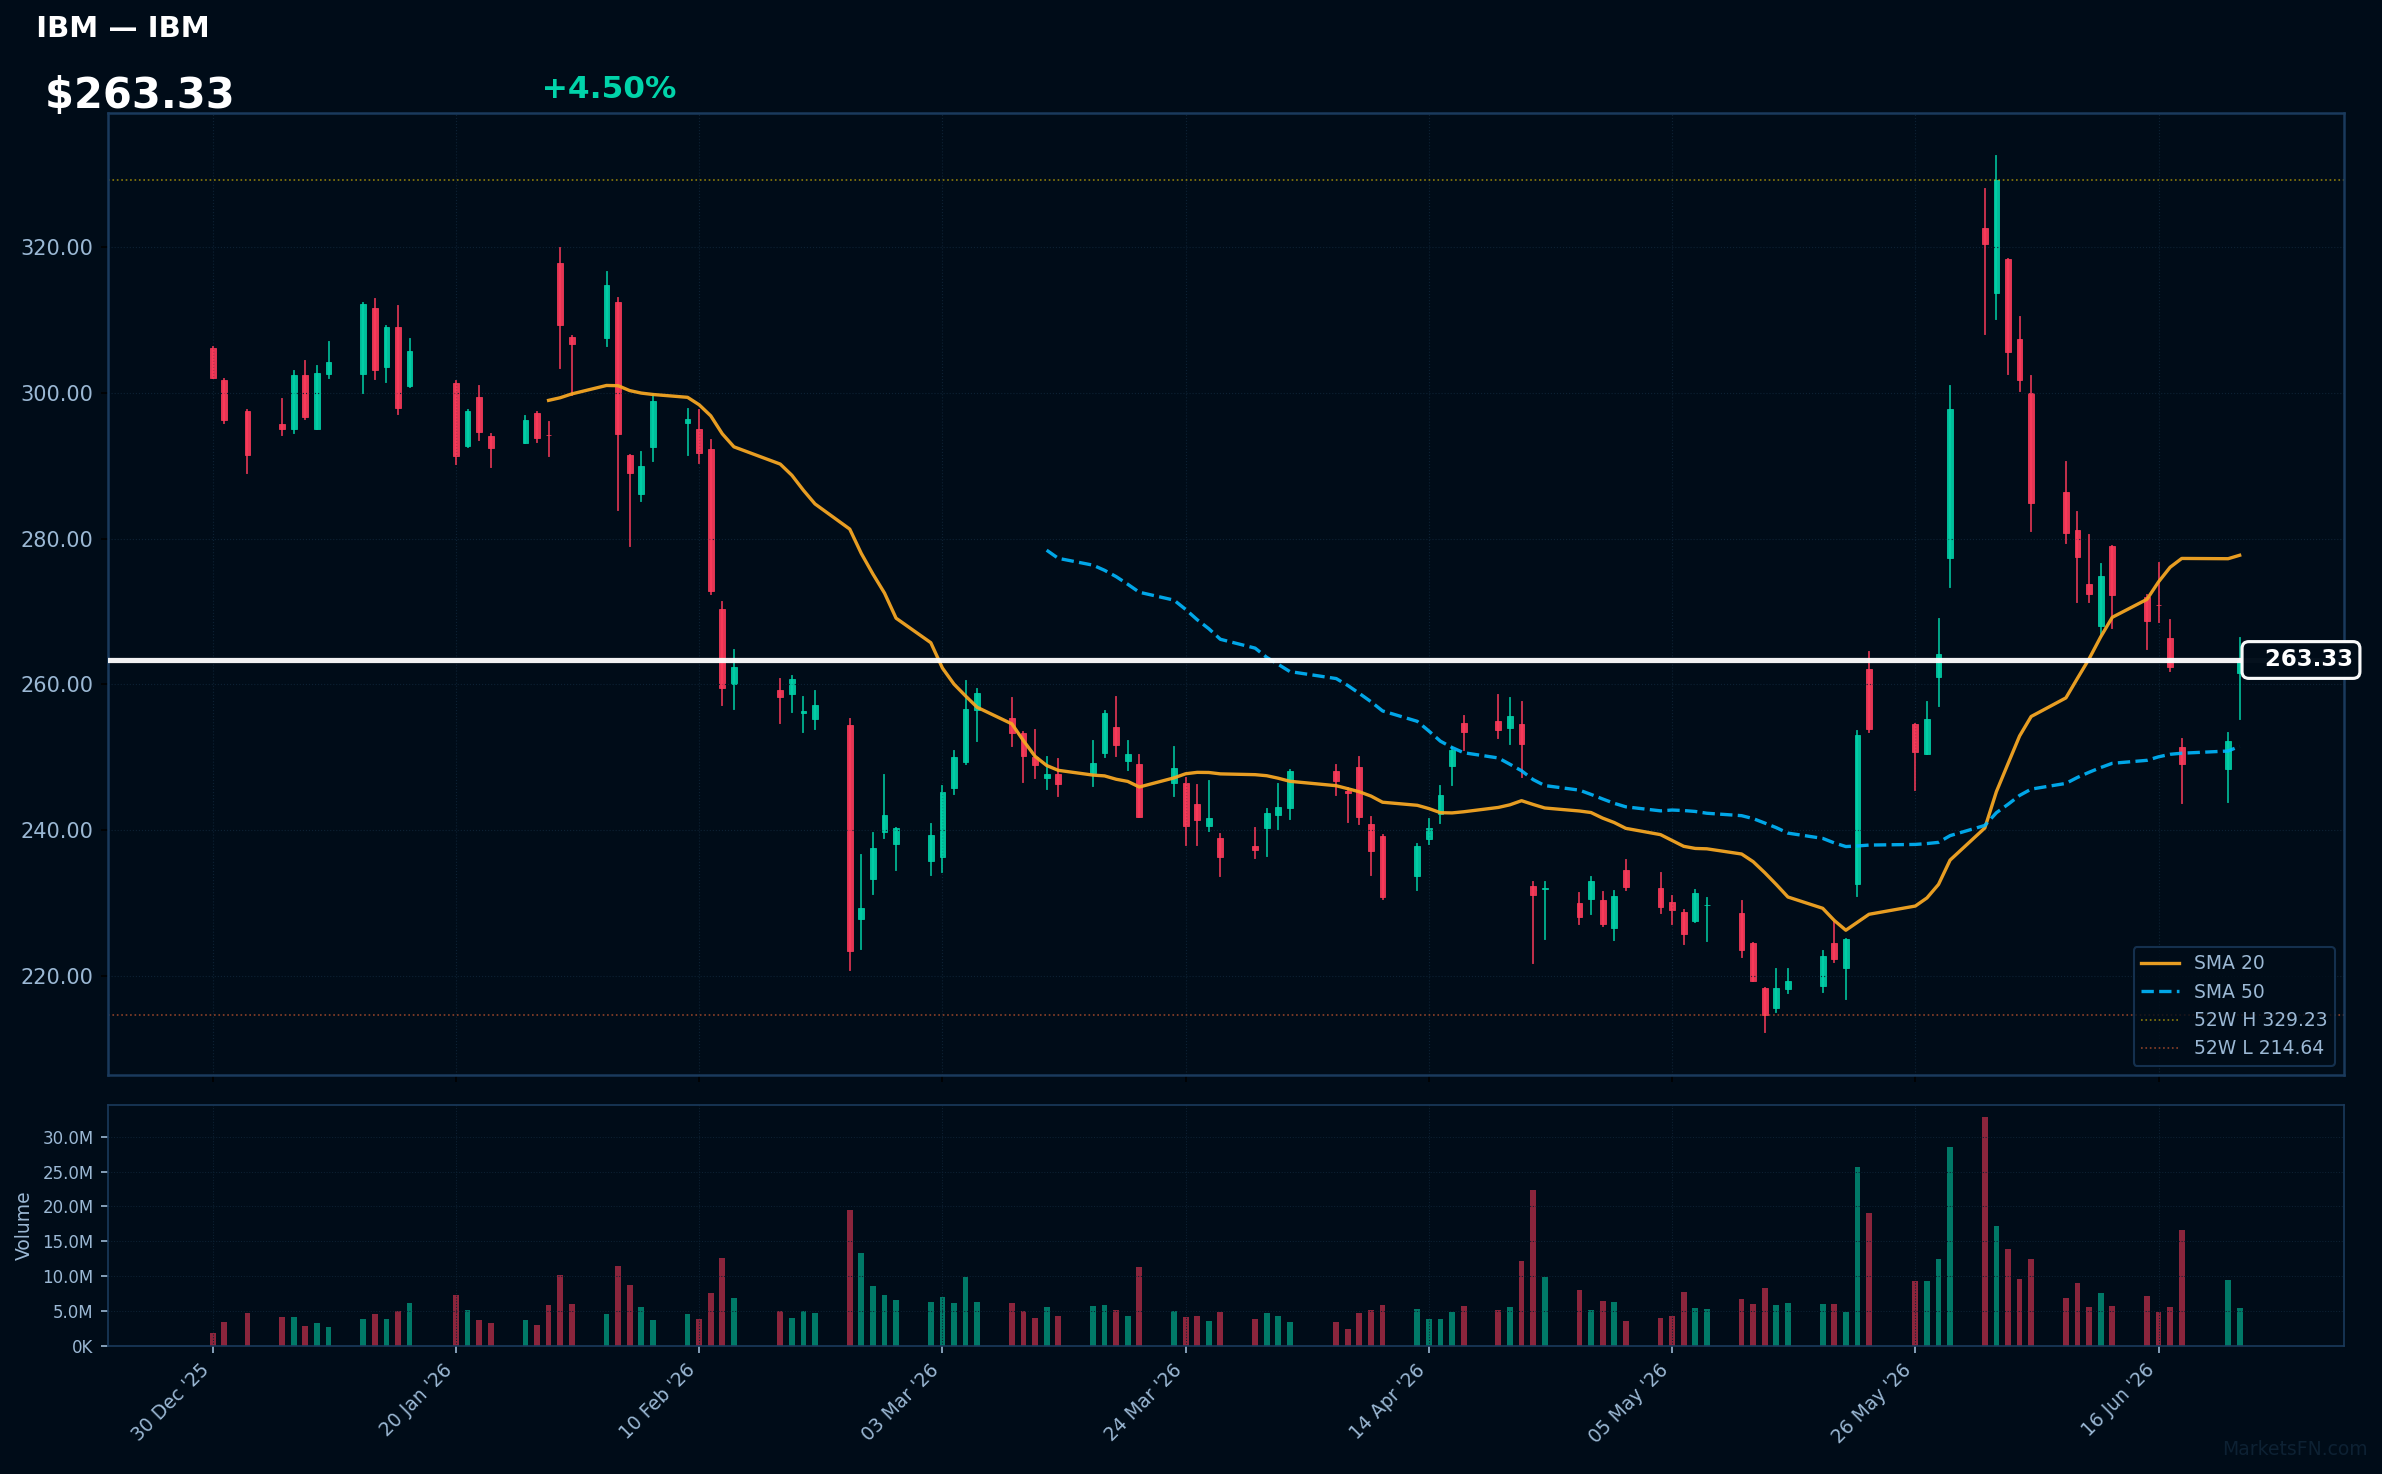
IBM | International Business Machines Corp | Technology | Price: $263.56 | Day: +4.50% | 1W: -2.00% | 1M: +4.10% | RSI: 49.6 | vs MA200: -3.7% | Trend: Above MA50 · Below MA20, MA200
Recent headlines (last 12h)
- IBM Stock Bucks Broader Tech Selloff With Upgrade
- IBM Stock Resists Tech Slump as J.P. Morgan Cheers Its Software Makeover
- IBM upgrade, SpaceX initiation among today's top calls on Wall Street
- Infleqtion, IBM, and Other Quantum Stocks Defy the Tech Selloff
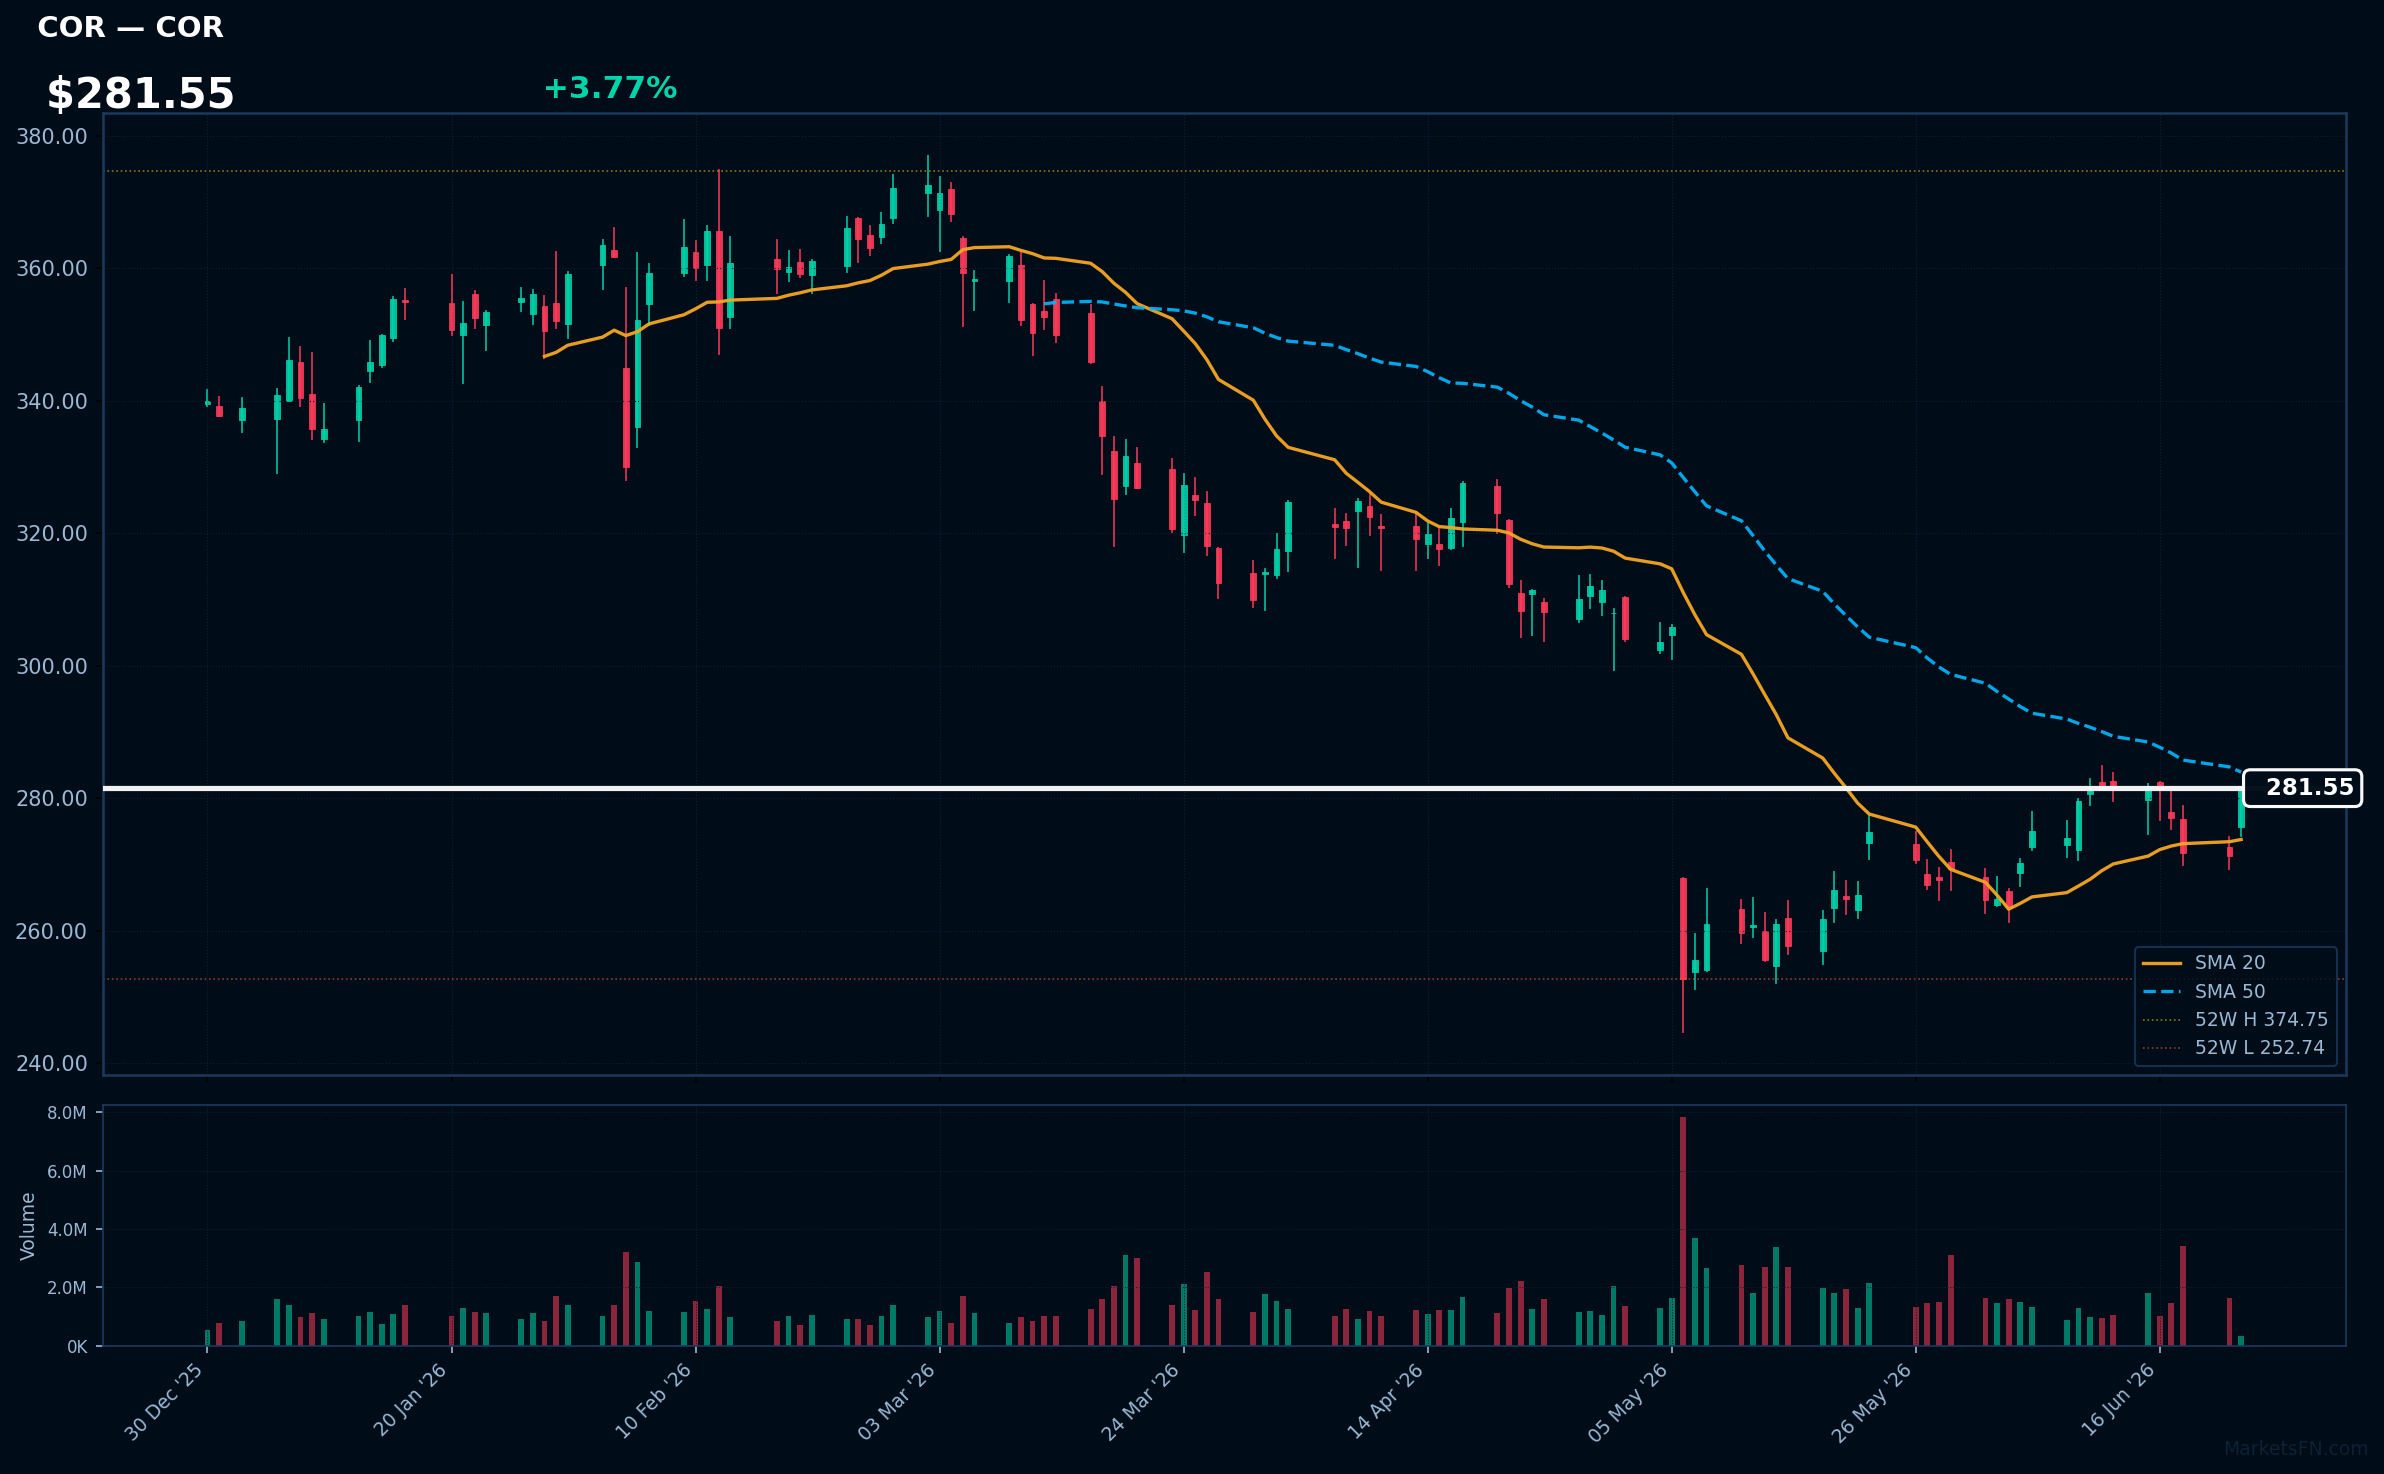
COR | Cencora Inc | Healthcare | Price: $281.51 | Day: +3.77% | 1W: +0.04% | 1M: +6.07% | RSI: 54.7 | vs MA200: -13.3% | Trend: Above MA20 · Below MA50, MA200
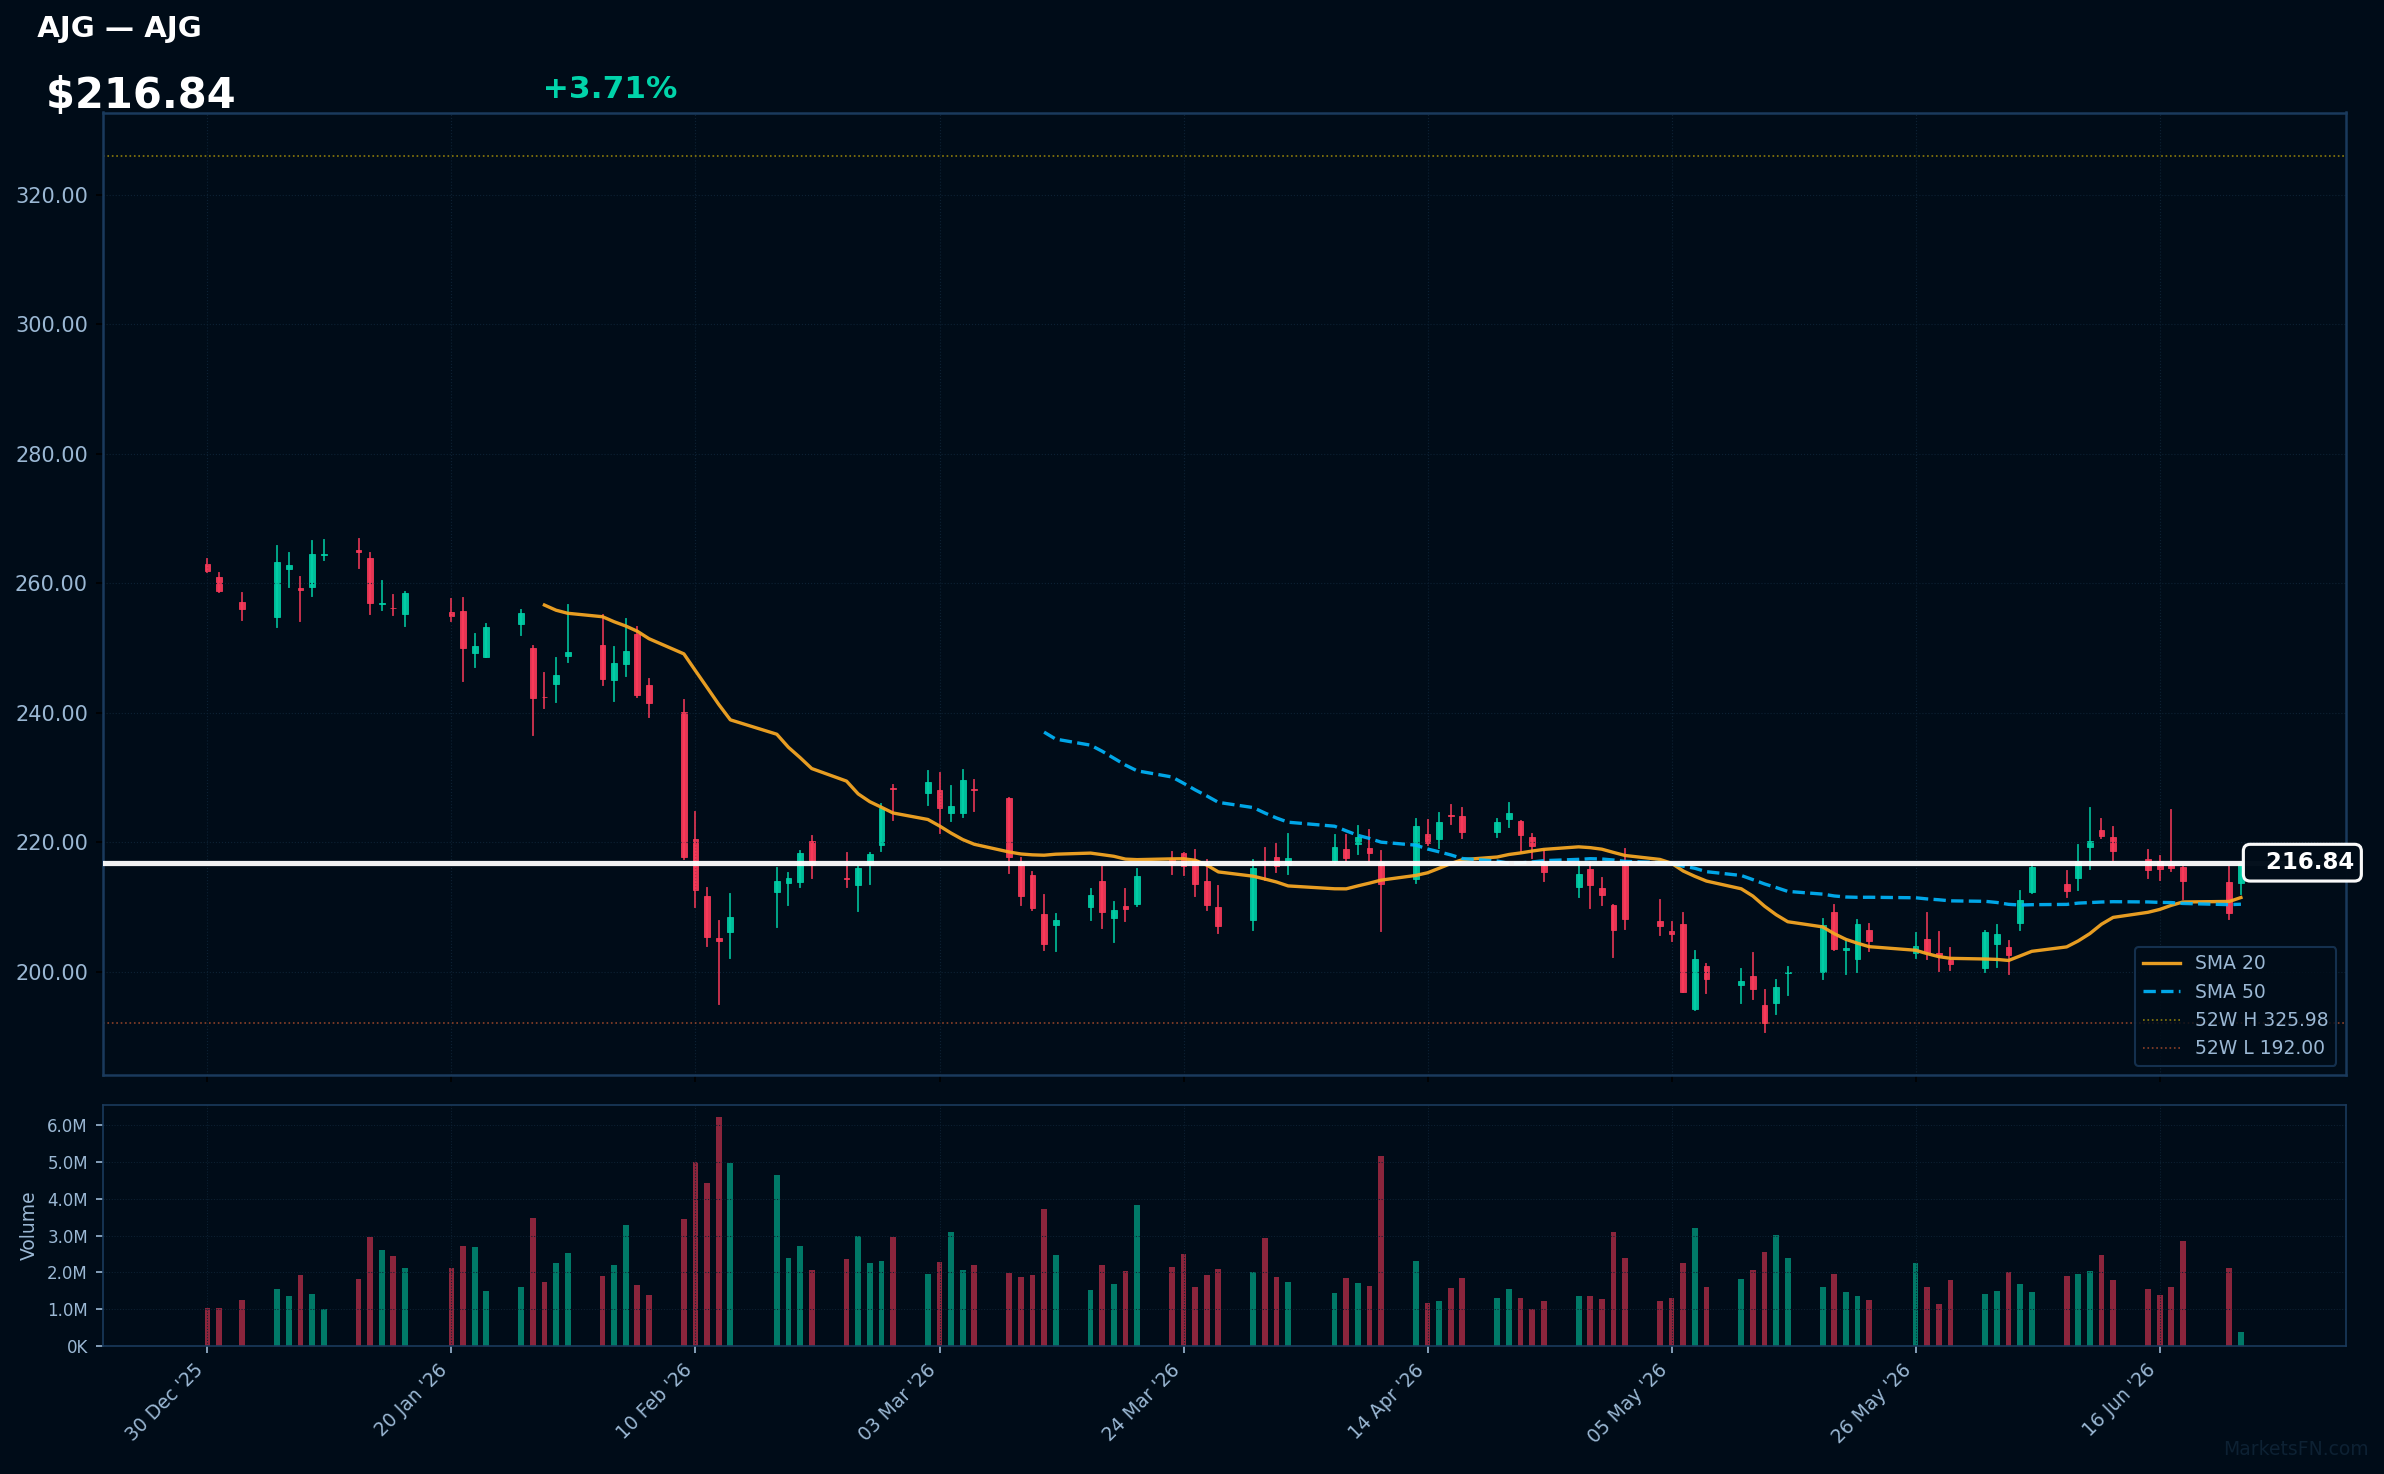
AJG | Arthur J. Gallagher & Co | Financial | Price: $216.84 | Day: +3.71% | 1W: +0.51% | 1M: +4.55% | RSI: 56.3 | vs MA200: -10.5% | Trend: Above MA20, MA50 · Below MA200
Recent headlines (last 12h)
- Arthur J. Gallagher & Co. Acquires Cincinnati Benefit Solutions, LLC
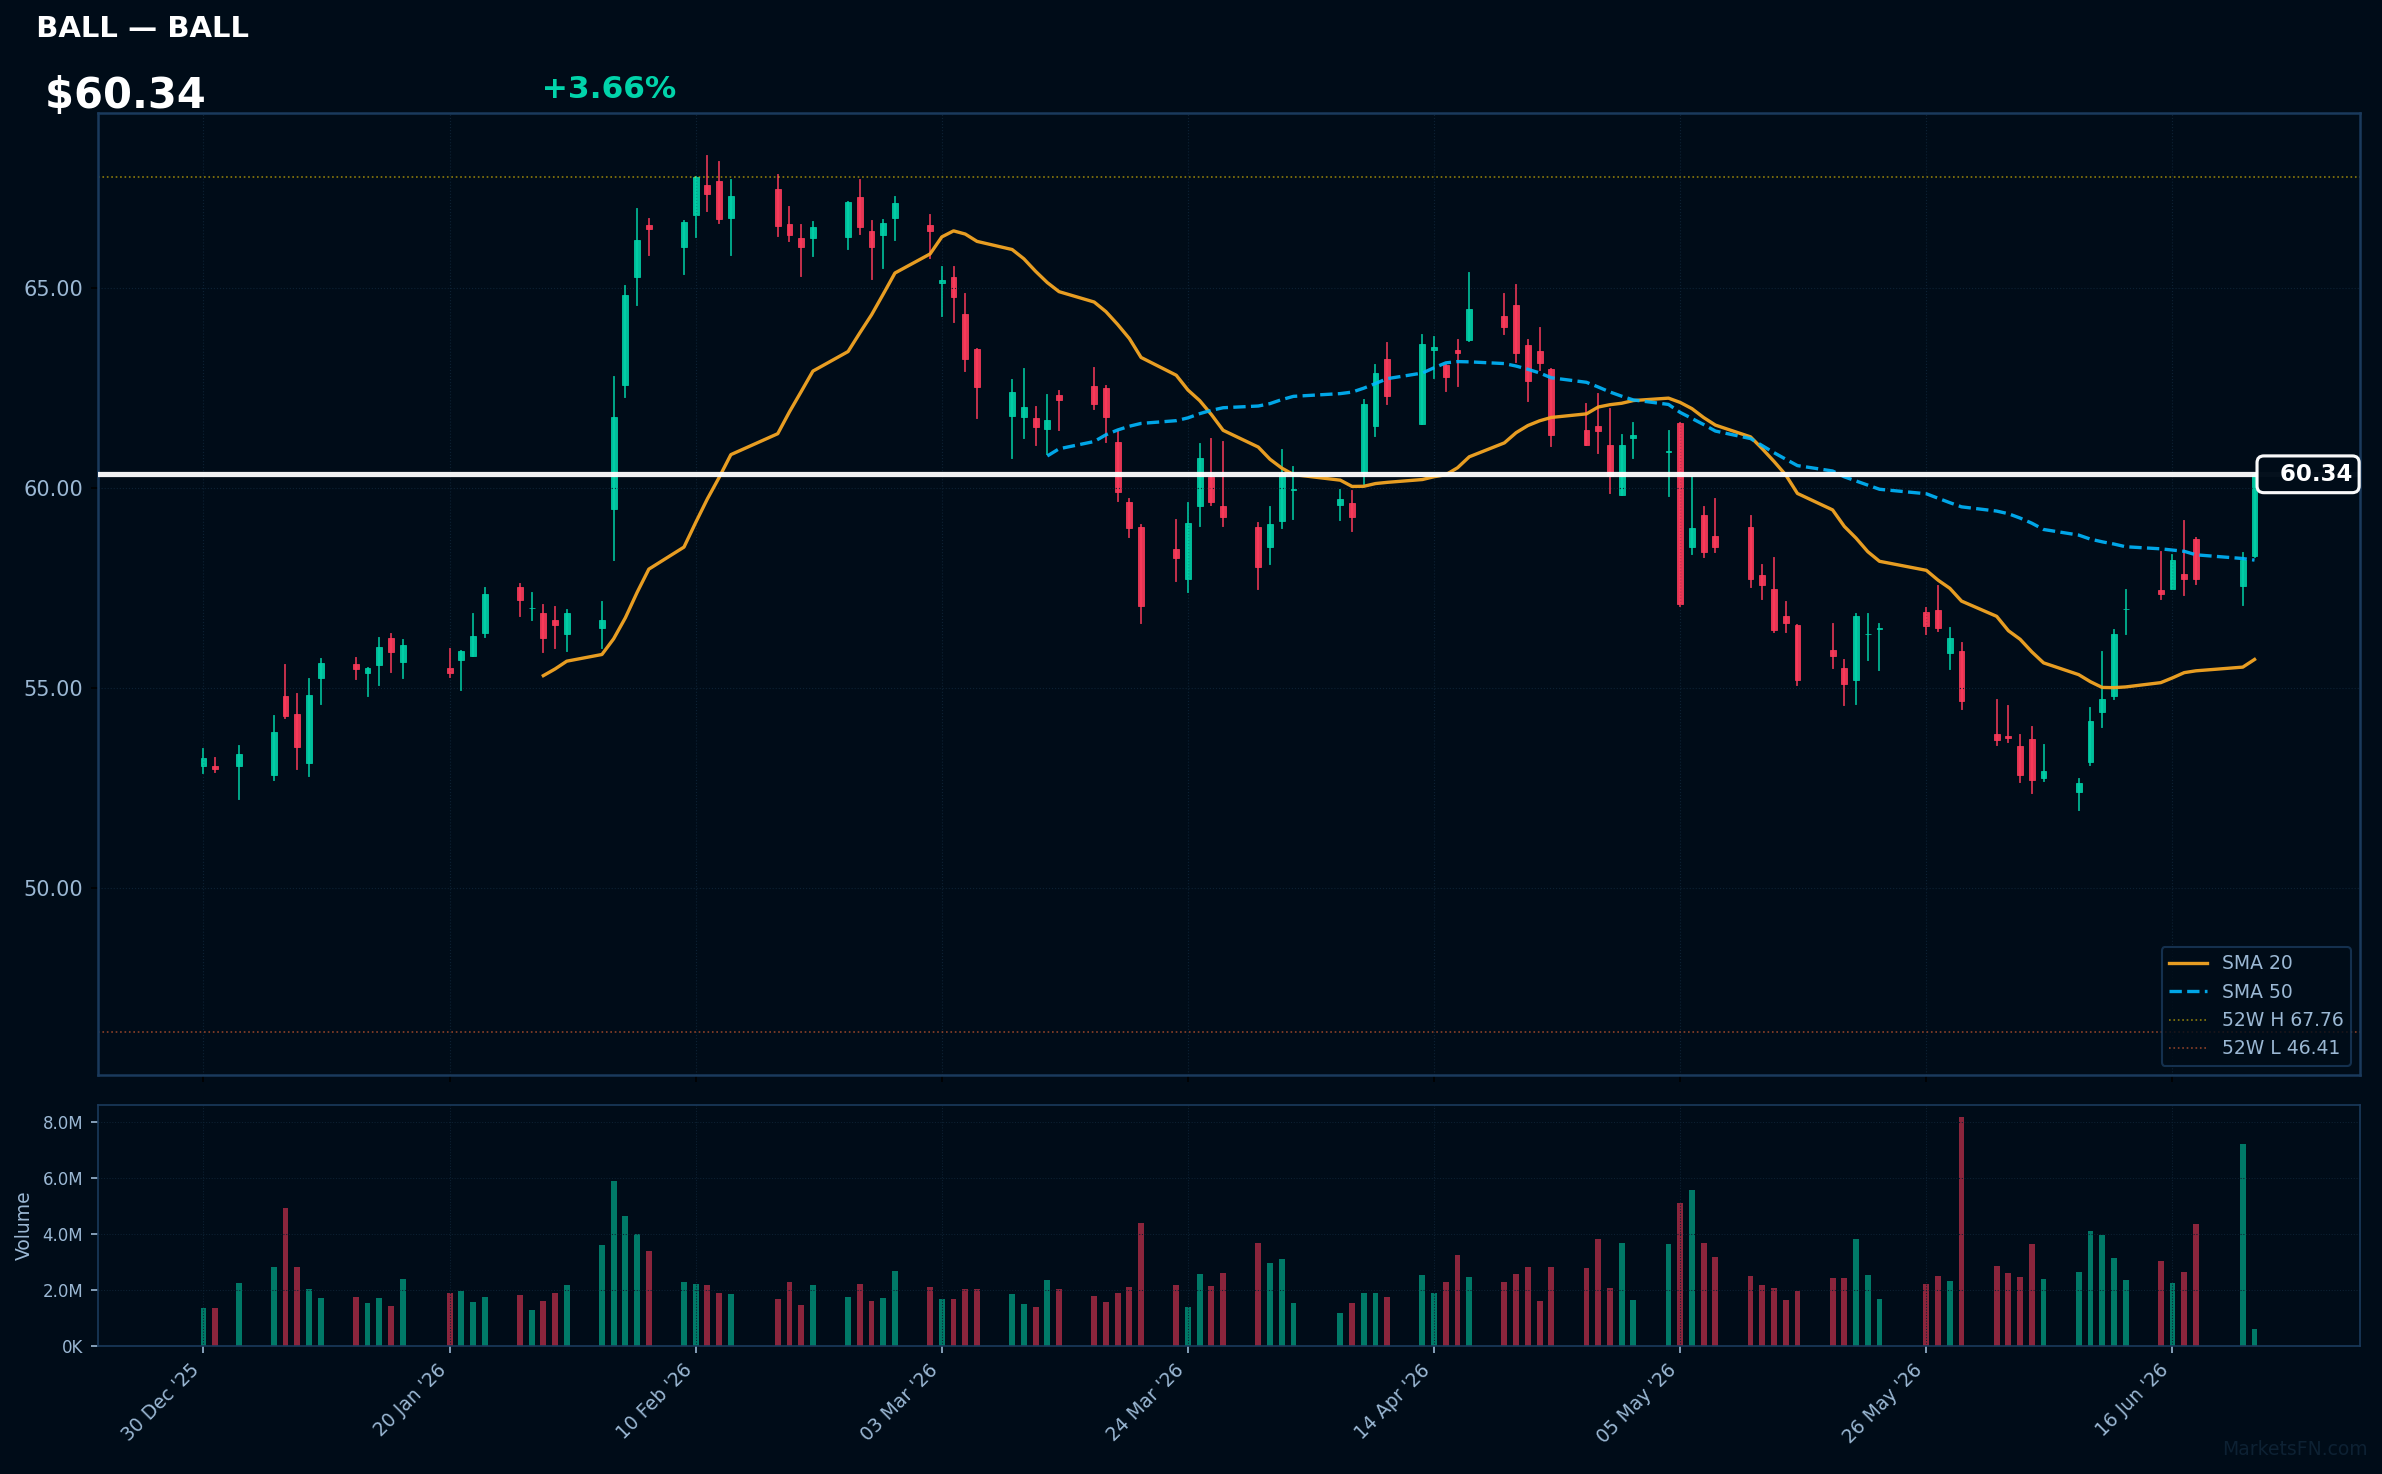
BALL | Ball Corp | Consumer Cyclical | Price: $60.33 | Day: +3.66% | 1W: +5.21% | 1M: +7.08% | RSI: 68.0 | vs MA200: +8.8% | Trend: Above MA20, MA50, MA200
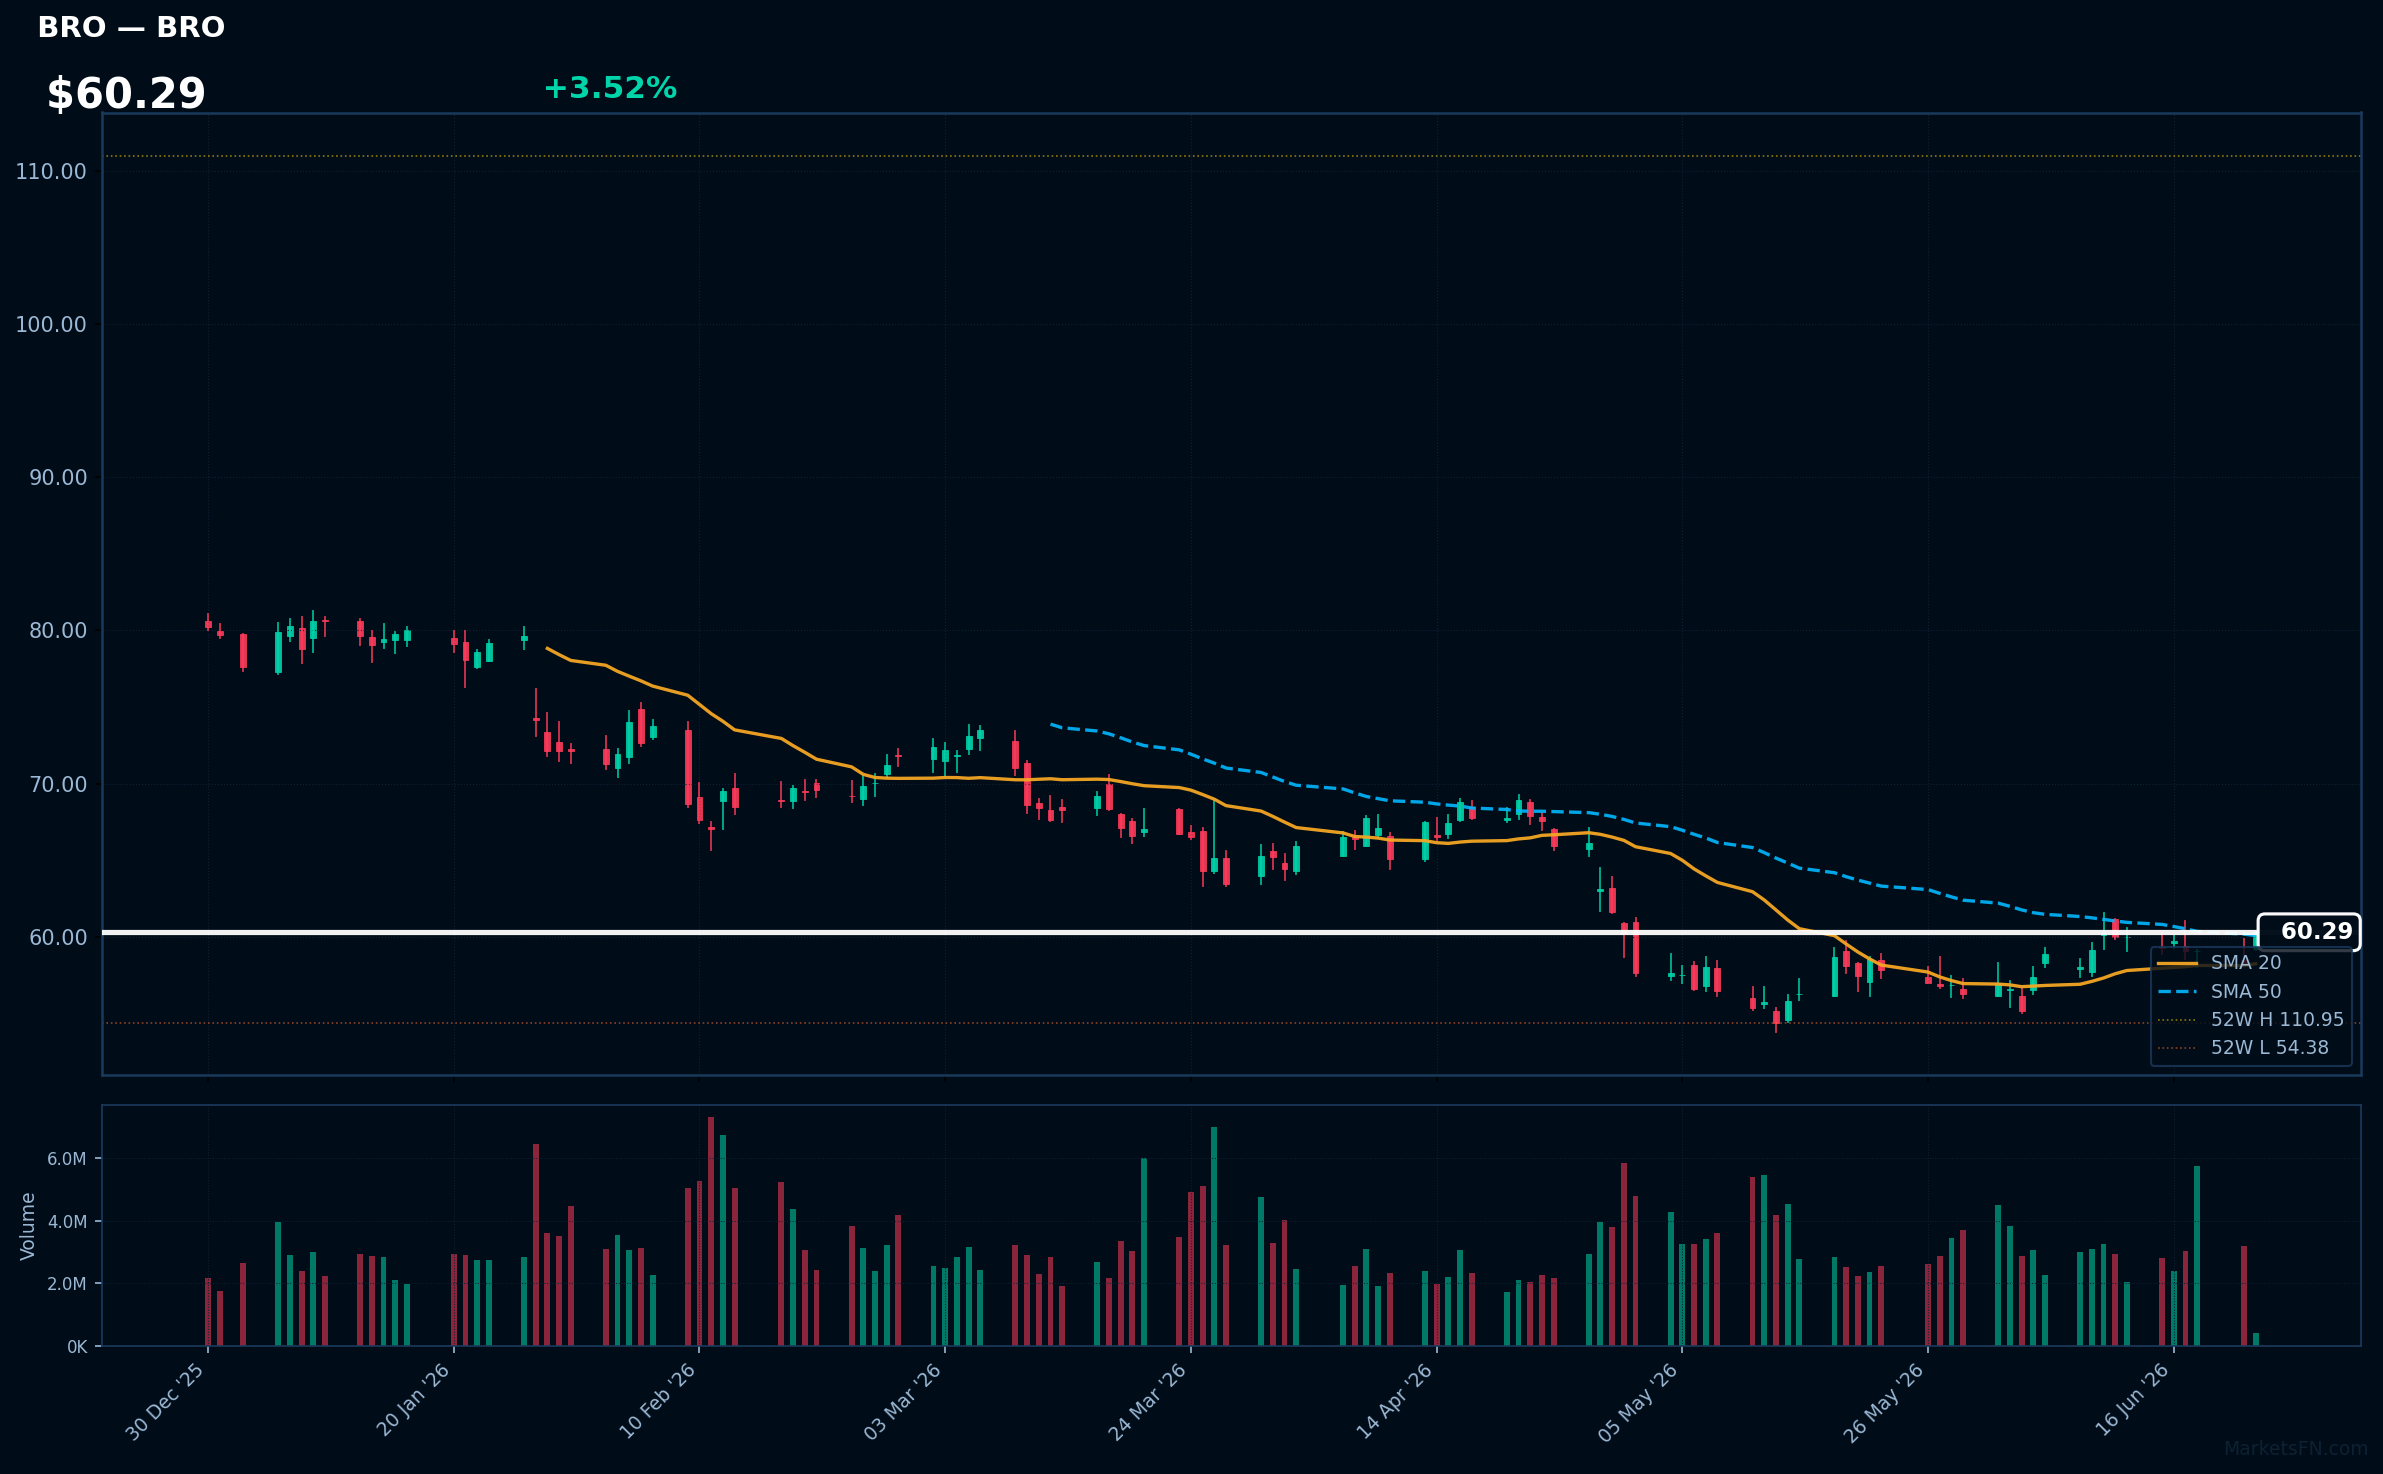
BRO | Brown & Brown, Inc | Financial | Price: $60.29 | Day: +3.52% | 1W: +1.70% | 1M: +3.02% | RSI: 55.8 | vs MA200: -18.9% | Trend: Above MA20, MA50 · Below MA200
AZO | Autozone Inc | Consumer Cyclical | Price: $3051.85 | Day: +3.49% | 1W: -1.69% | 1M: -11.21% | RSI: 42.5 | vs MA200: -16.0% | Trend: Below MA20, MA50, MA200
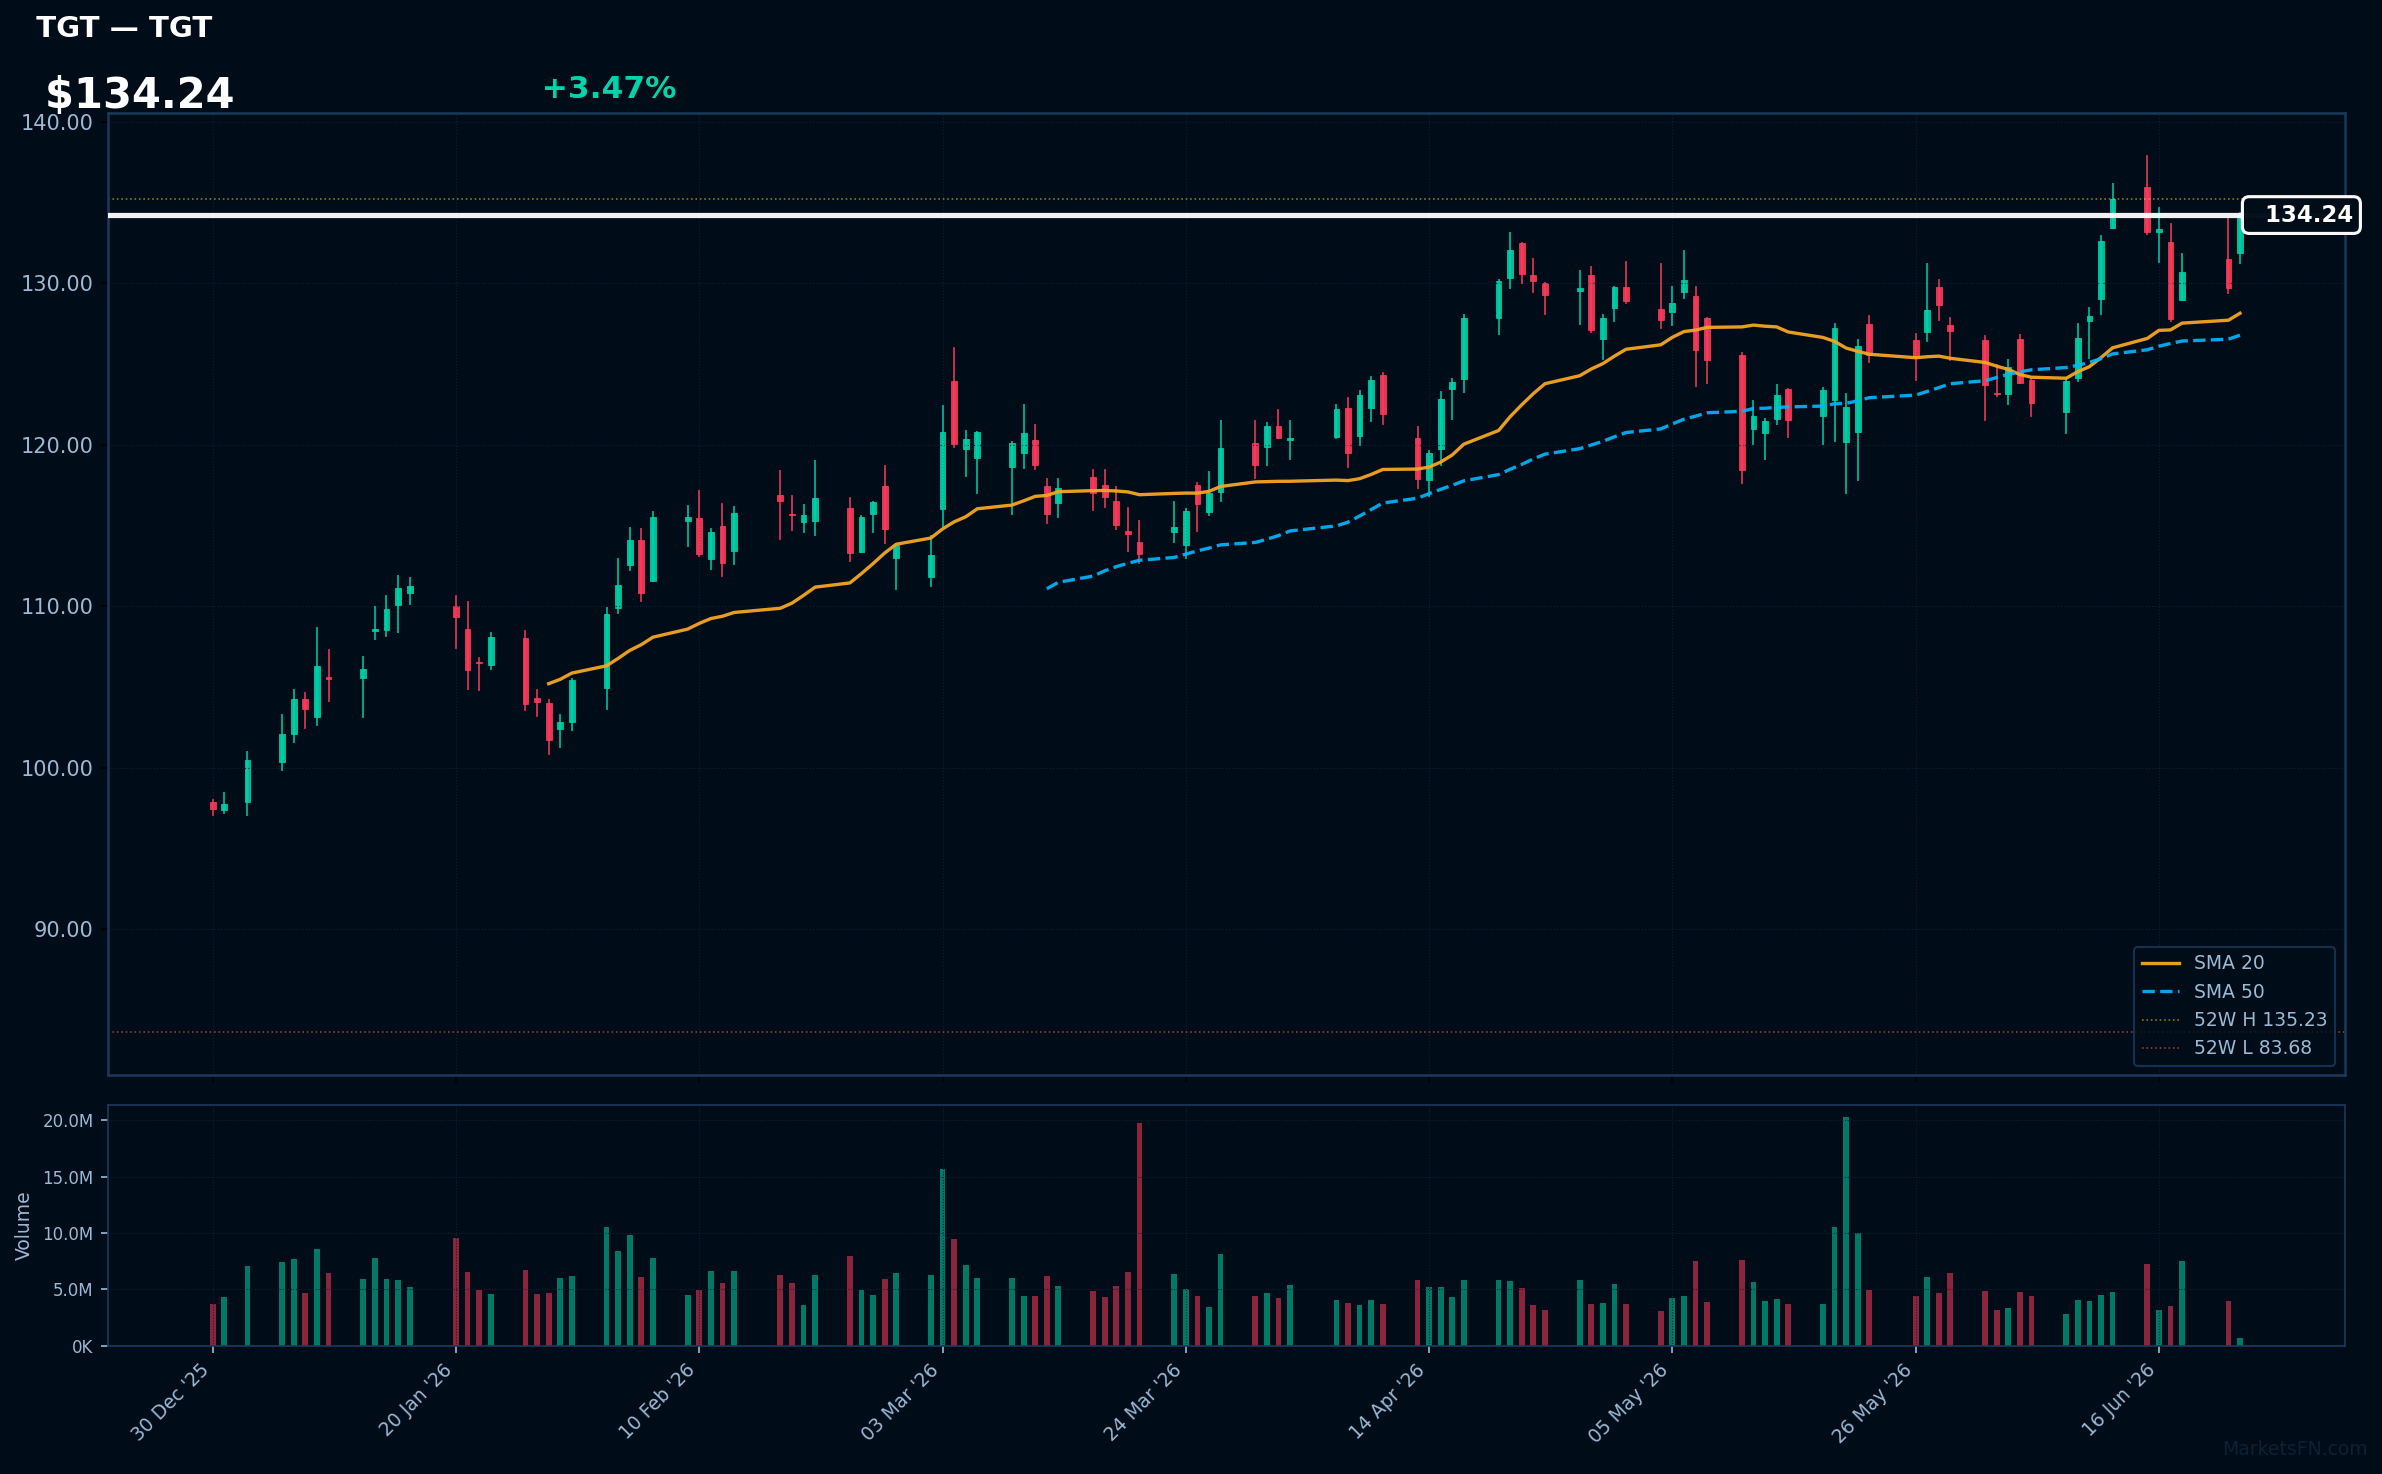
TGT | Target Corp | Consumer Defensive | Price: $134.24 | Day: +3.47% | 1W: +0.80% | 1M: +6.41% | RSI: 60.0 | vs MA200: +24.4% | Trend: Above MA20, MA50, MA200
Recent headlines (last 12h)
- Wolfe Research upgrades Target to Top Pick, downgrades Home Depot and Five Below
- IBM upgrade, SpaceX initiation among today's top calls on Wall Street
- Retailers Overstocked to Avoid Tariffs. Then Inflation Hit.
- Amazon Prime Day Shoppers Plan to Hold Out for Steep Discounts
Top 10 Losers
Today's weakest S&P 500 performers. Sector drag: Technology (10).
| Ticker | Company | Sector | Price | Day % | 1W % | 1M % | RSI | vs MA200 | Trend |
|---|---|---|---|---|---|---|---|---|---|
| TXN | Texas Instruments Inc | Technology | $307.94 | -7.33% | -1.76% | +3.16% | 53.1 | +45.5% | Above MA20, MA50, MA200 |
| QCOM | Qualcomm, Inc | Technology | $205.45 | -7.41% | -6.99% | -3.77% | 47.3 | +22.8% | Above MA50, MA200 · Below MA20 |
| AMAT | Applied Materials Inc | Technology | $589.38 | -7.94% | +0.41% | +37.63% | 63.9 | +82.8% | Above MA20, MA50, MA200 |
| TER | Teradyne, Inc | Technology | $419.00 | -8.32% | -3.10% | +18.55% | 55.6 | +63.3% | Above MA20, MA50, MA200 |
| KLAC | KLA Corp | Technology | $245.66 | -8.73% | -4.44% | +33.01% | 60.0 | +68.1% | Above MA20, MA50, MA200 |
| WDC | Western Digital Corp | Technology | $667.83 | -8.84% | +2.27% | +37.40% | 62.9 | +145.3% | Above MA20, MA50, MA200 |
| MU | Micron Technology Inc | Technology | $1103.65 | -8.89% | +1.49% | +44.88% | 60.7 | +168.4% | Above MA20, MA50, MA200 |
| LRCX | Lam Research Corp | Technology | $372.66 | -9.01% | -4.53% | +22.85% | 58.7 | +75.0% | Above MA20, MA50, MA200 |
| ON | ON Semiconductor Corp | Technology | $119.21 | -9.38% | -5.37% | +8.69% | 51.6 | +72.1% | Above MA50, MA200 · Below MA20 |
| GLW | Corning, Inc | Technology | $189.49 | -9.69% | +0.80% | -1.31% | 51.9 | +55.5% | Above MA20, MA50, MA200 |
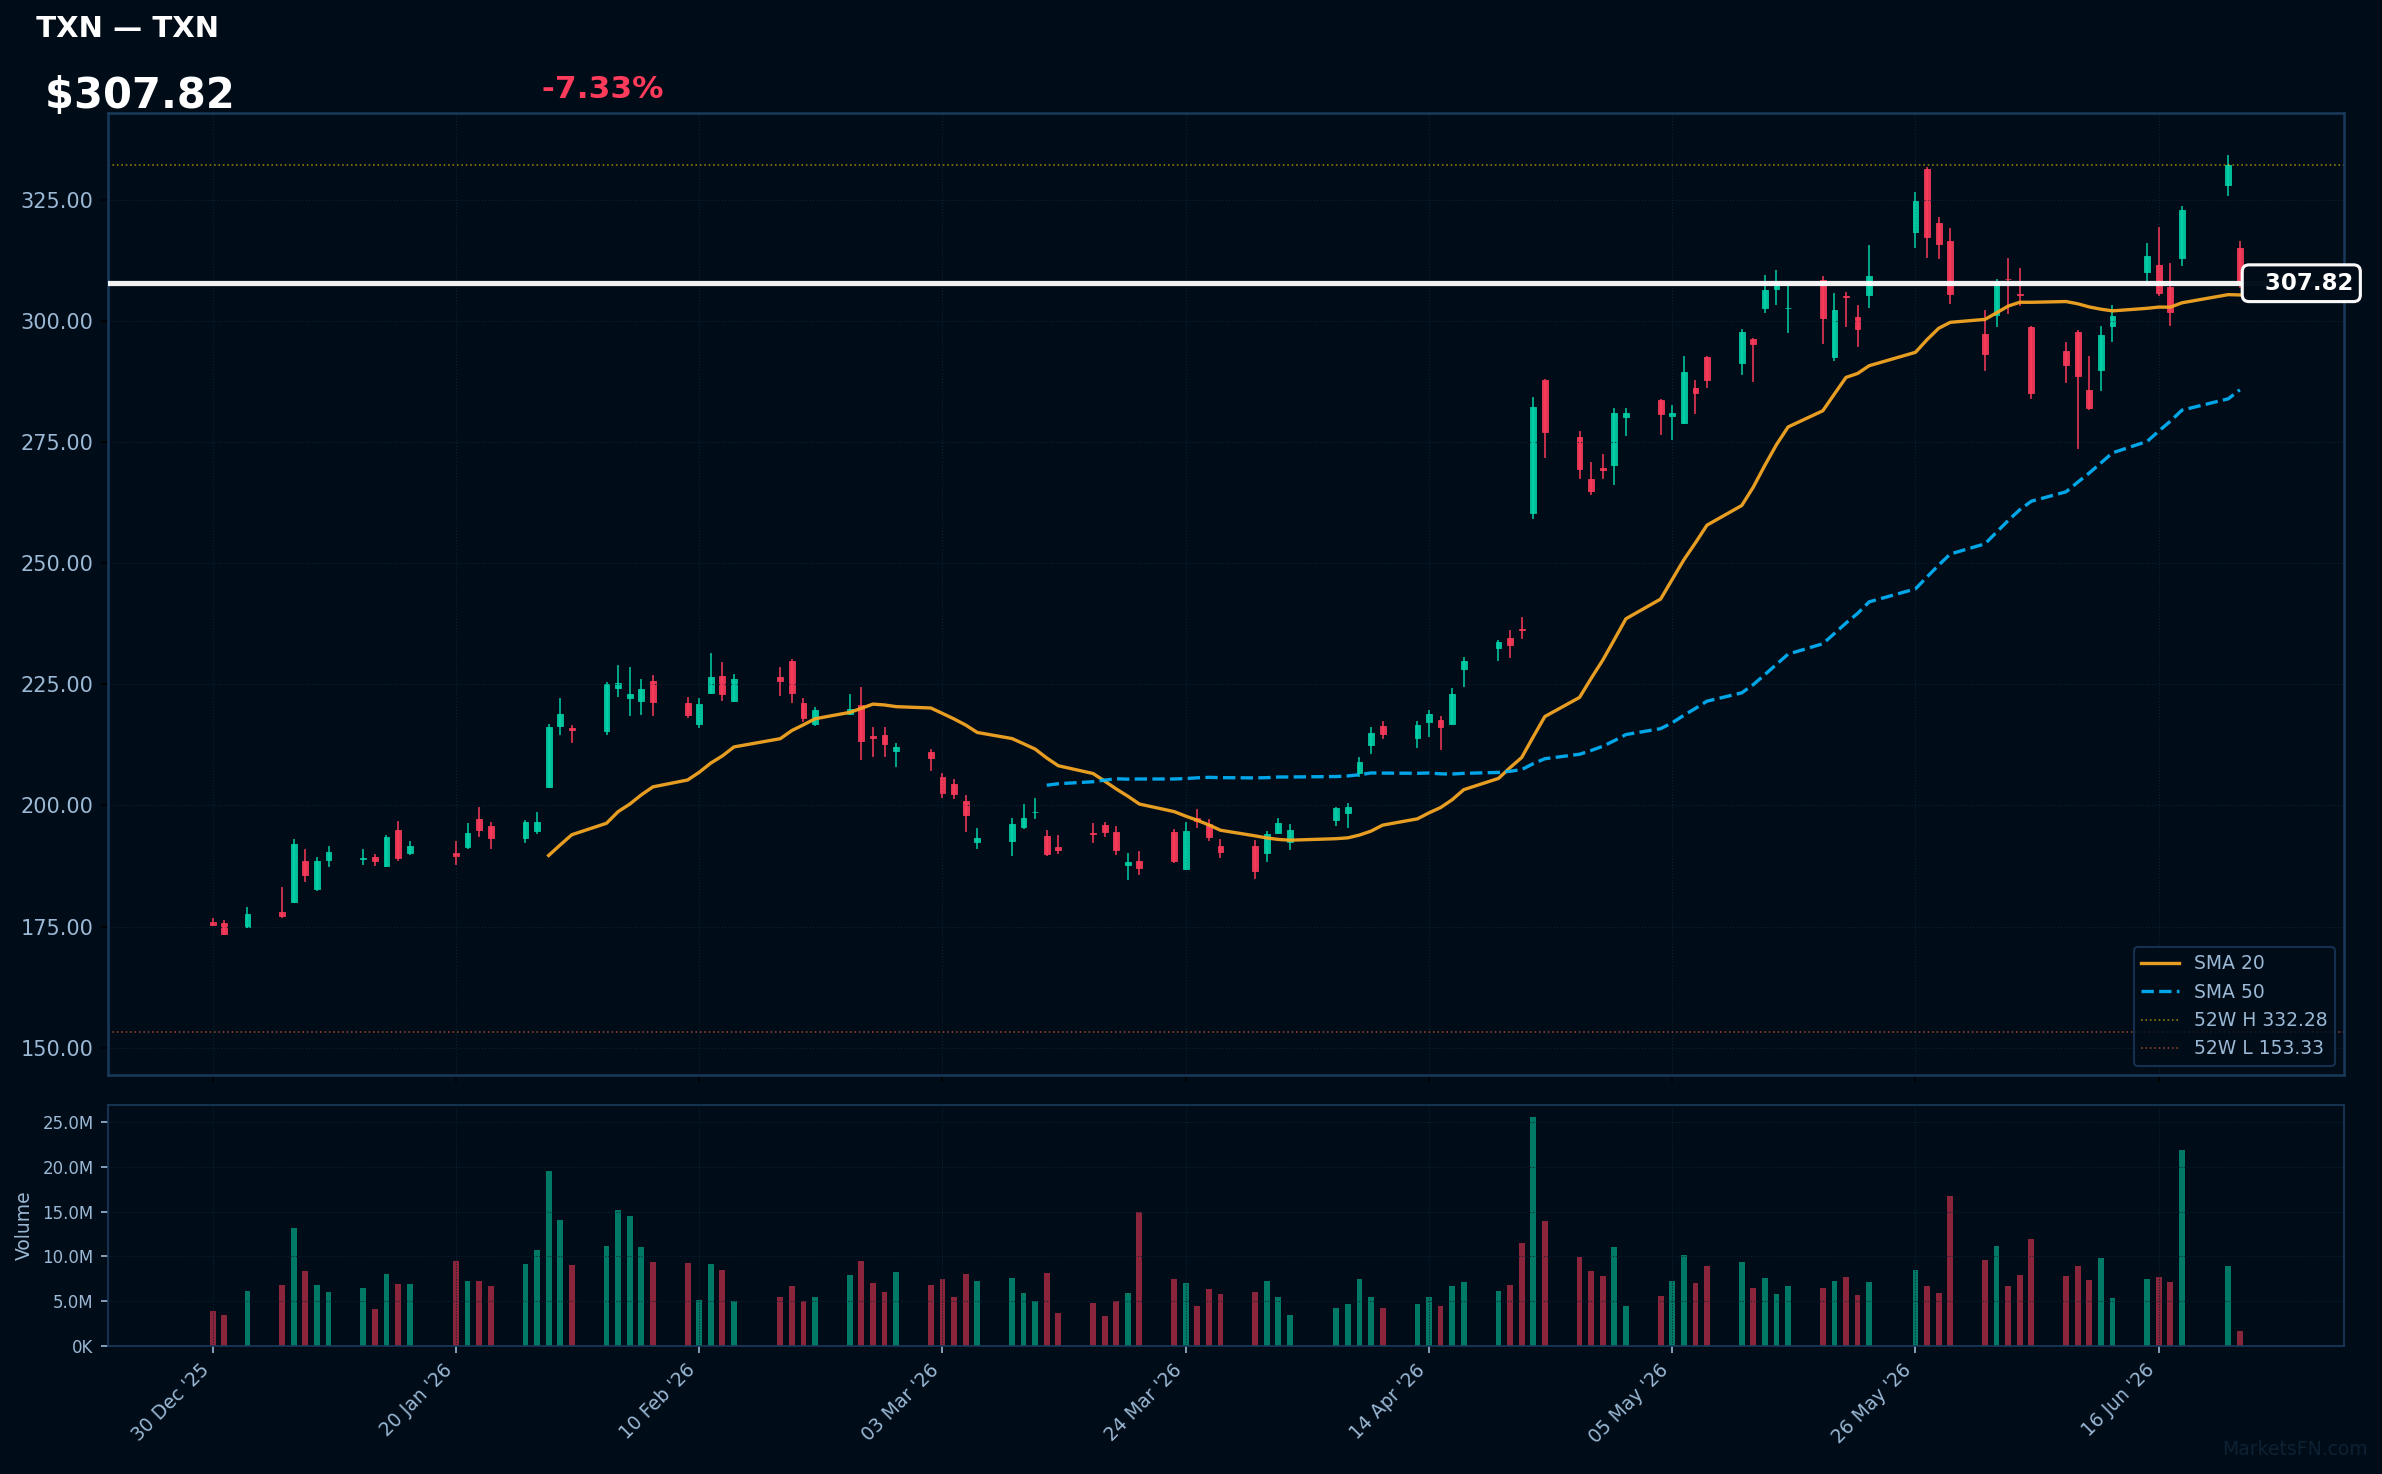
TXN | Texas Instruments Inc | Technology | Price: $307.94 | Day: -7.33% | 1W: -1.76% | 1M: +3.16% | RSI: 53.1 | vs MA200: +45.5% | Trend: Above MA20, MA50, MA200
Recent headlines (last 12h)
- Nasdaq sell-off continues as SanDisk and Western Digital lead, amid tech 'rotation not liquidation'
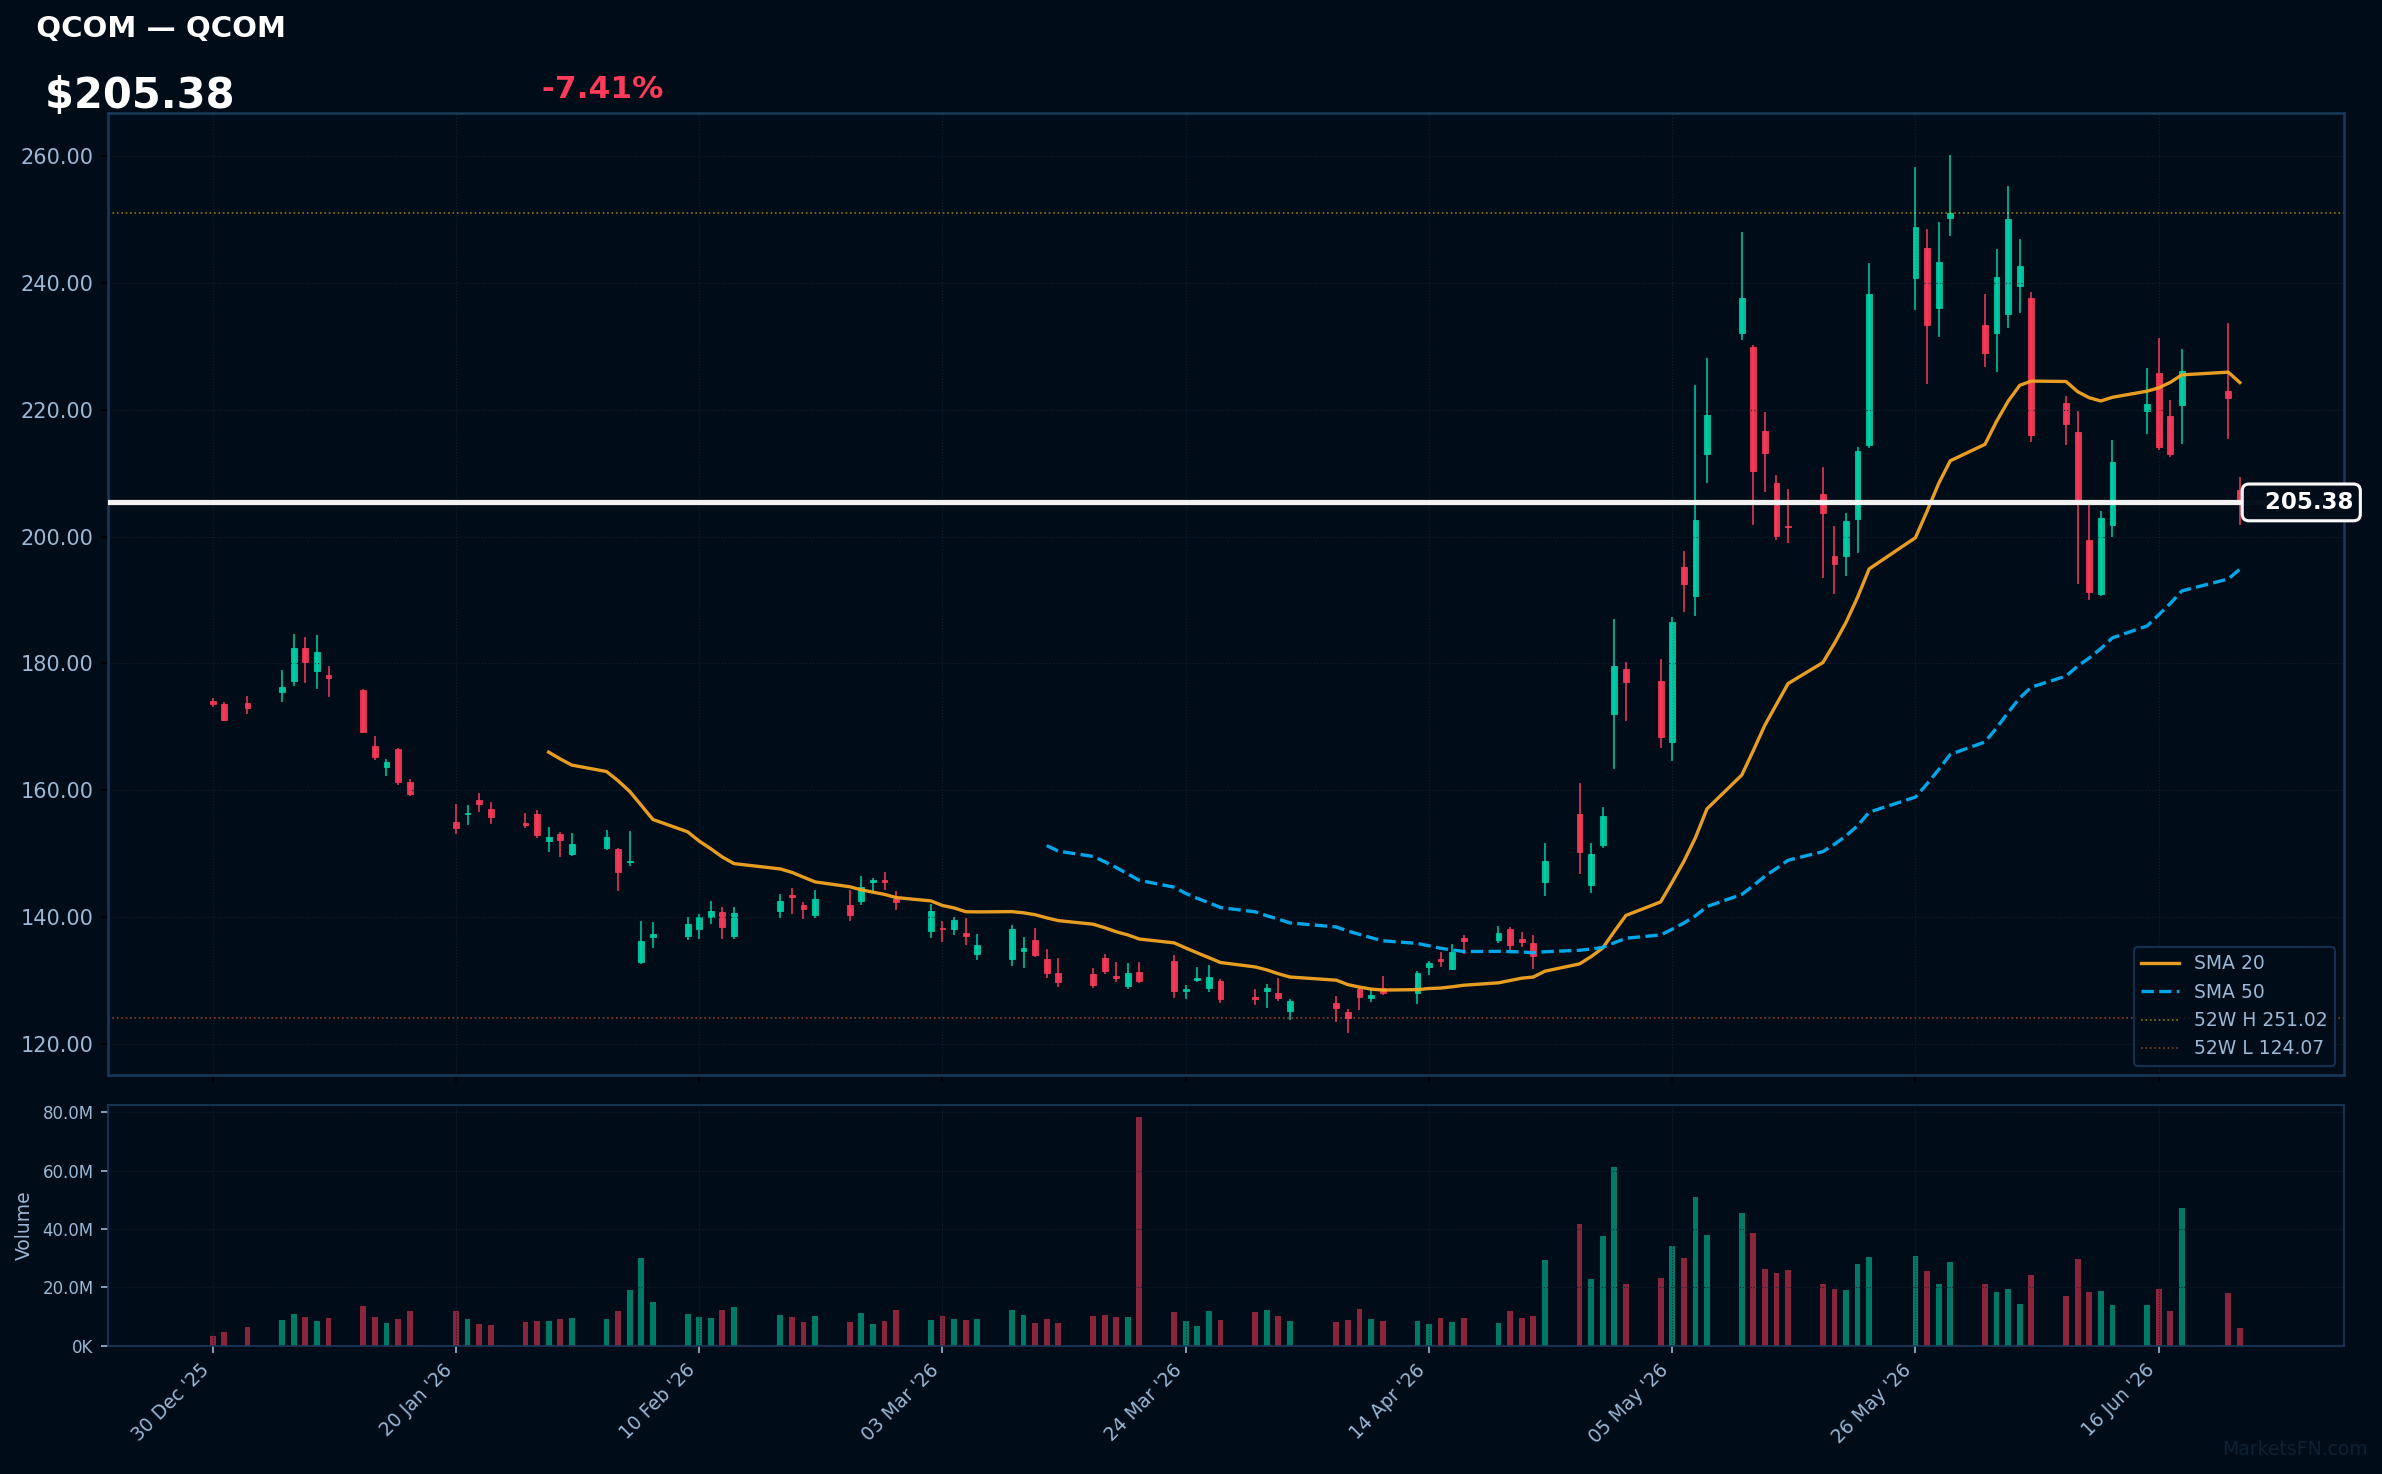
QCOM | Qualcomm, Inc | Technology | Price: $205.45 | Day: -7.41% | 1W: -6.99% | 1M: -3.77% | RSI: 47.3 | vs MA200: +22.8% | Trend: Above MA50, MA200 · Below MA20
Recent headlines (last 12h)
- Qualcomm's AI Pivot: Smarter Than It Looks
- Qualcomm Stock Slides Amid Modular Acquisition Talks
- Qualcomm's $4 Billion AI Deal Talks Put Nvidia Rivalry in Focus
- Nasdaq sell-off continues as SanDisk and Western Digital lead, amid tech 'rotation not liquidation'
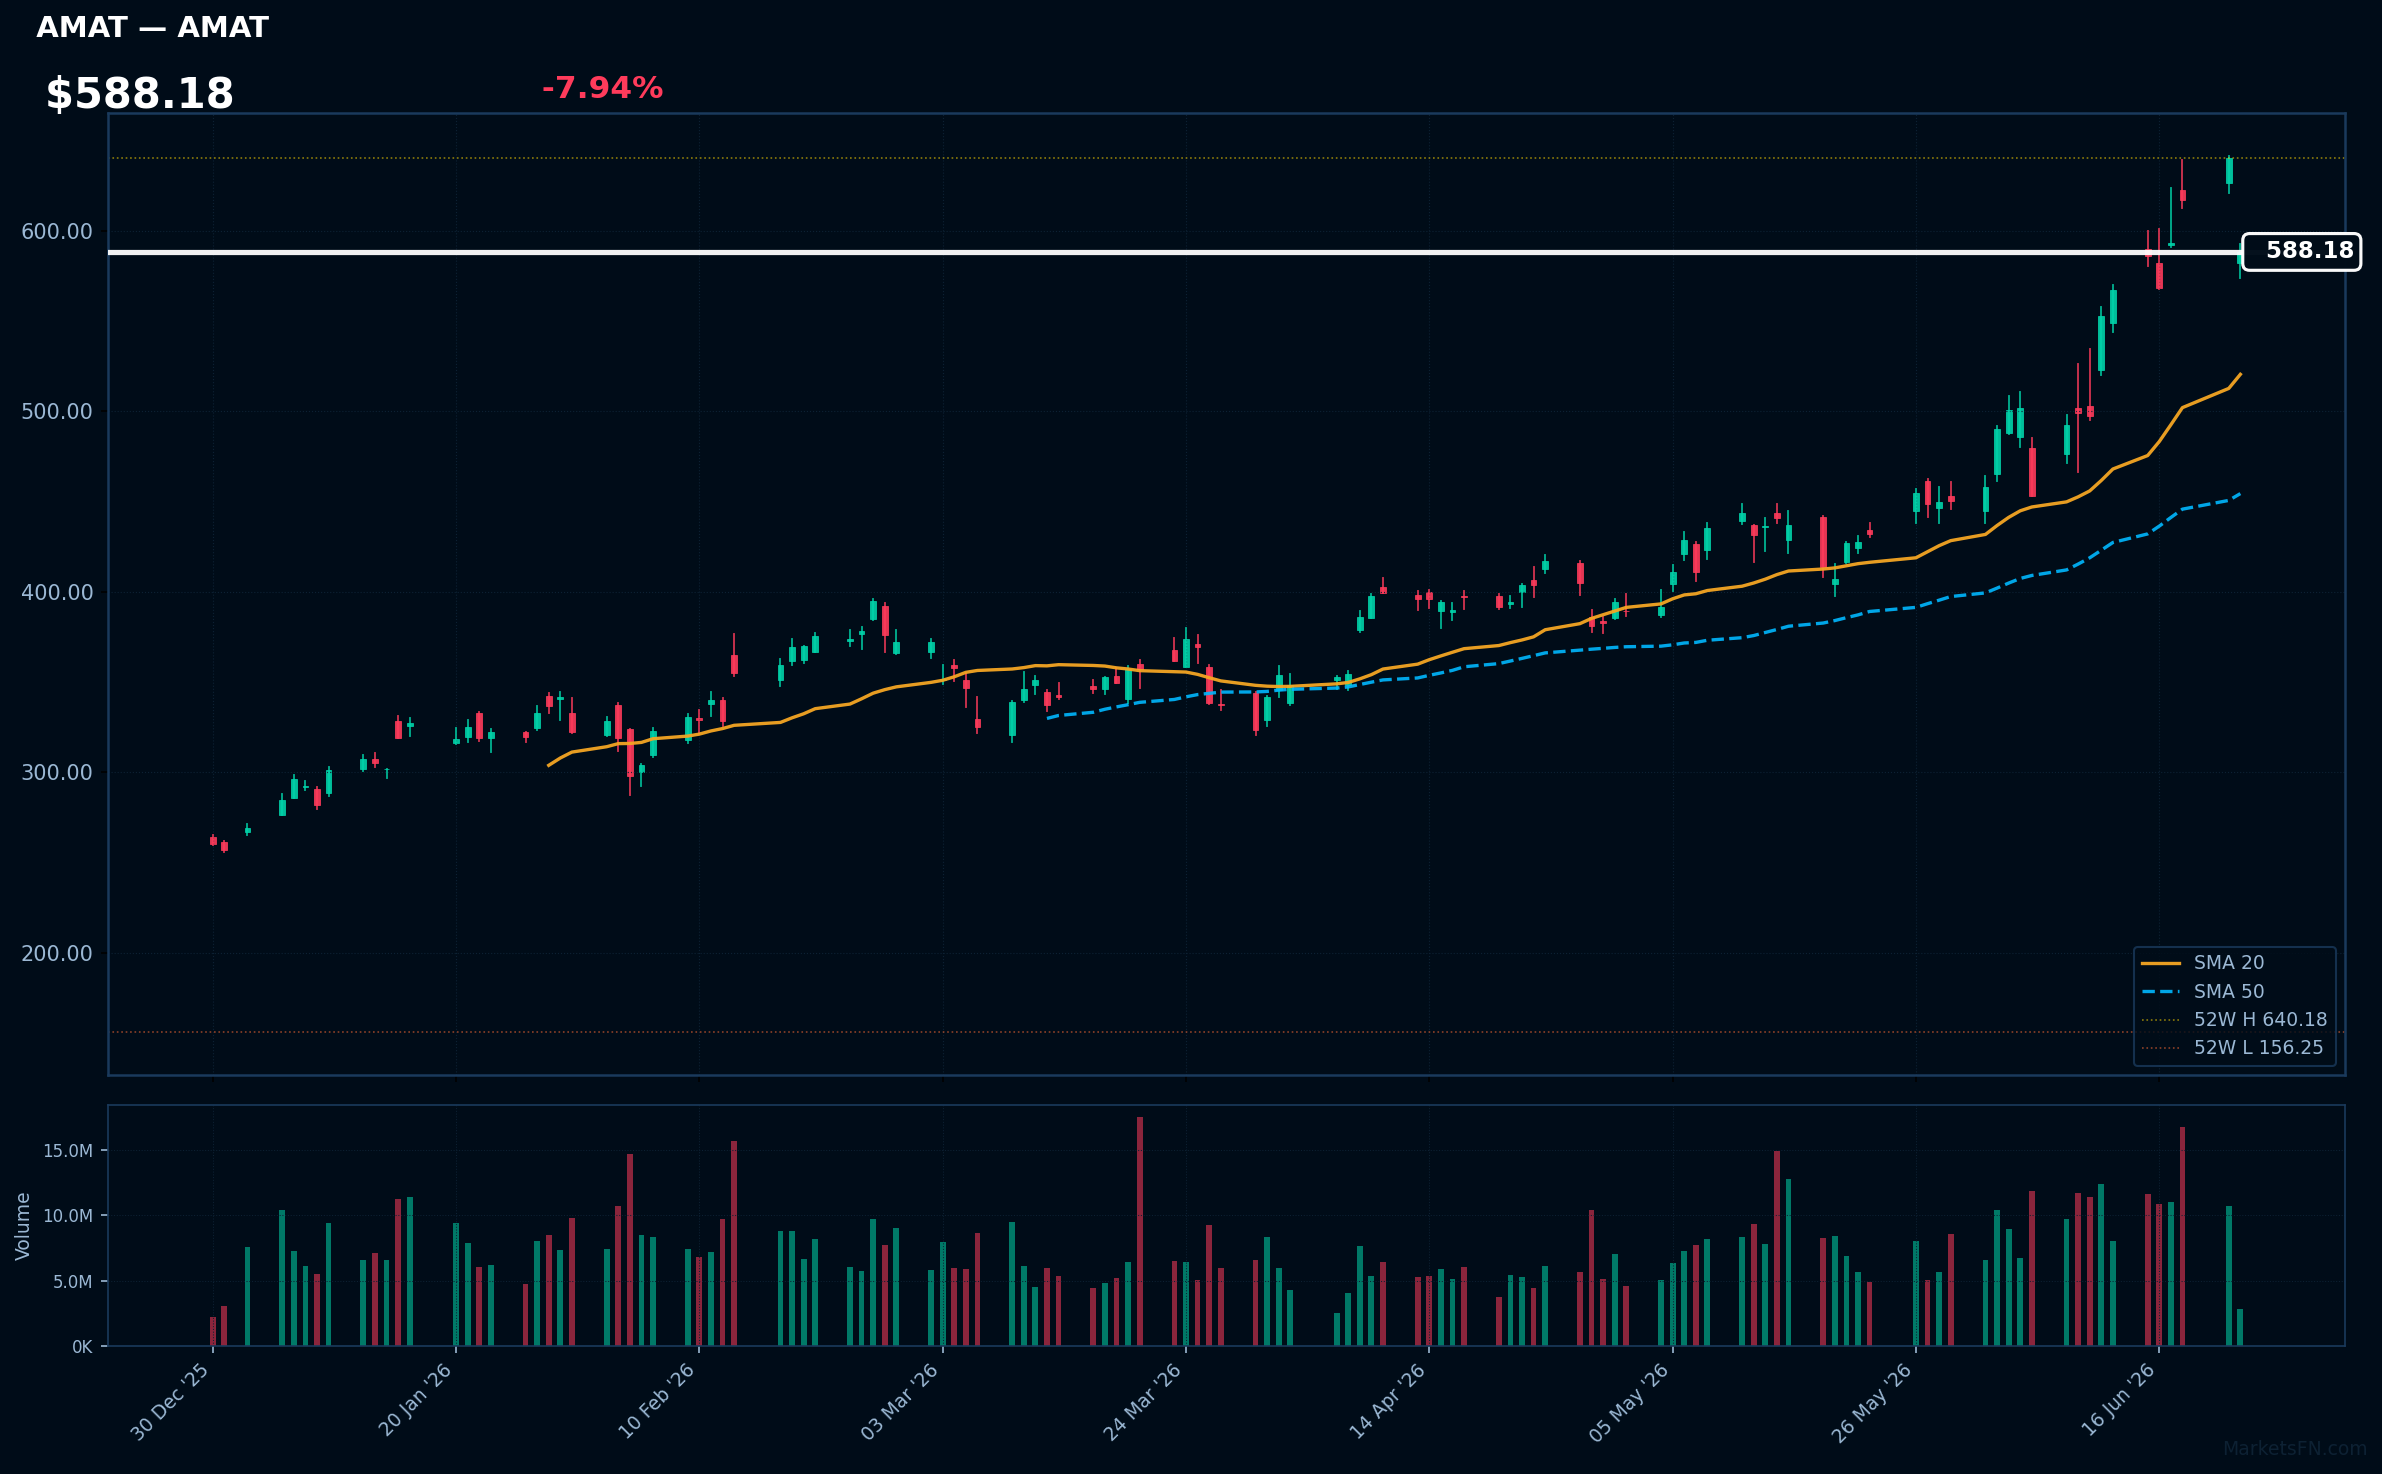
AMAT | Applied Materials Inc | Technology | Price: $589.38 | Day: -7.94% | 1W: +0.41% | 1M: +37.63% | RSI: 63.9 | vs MA200: +82.8% | Trend: Above MA20, MA50, MA200
Recent headlines (last 12h)
- Nasdaq sell-off continues as SanDisk and Western Digital lead, amid tech 'rotation not liquidation'
- BofA lists top 5 themes driving next $1tn in incremental semi sales
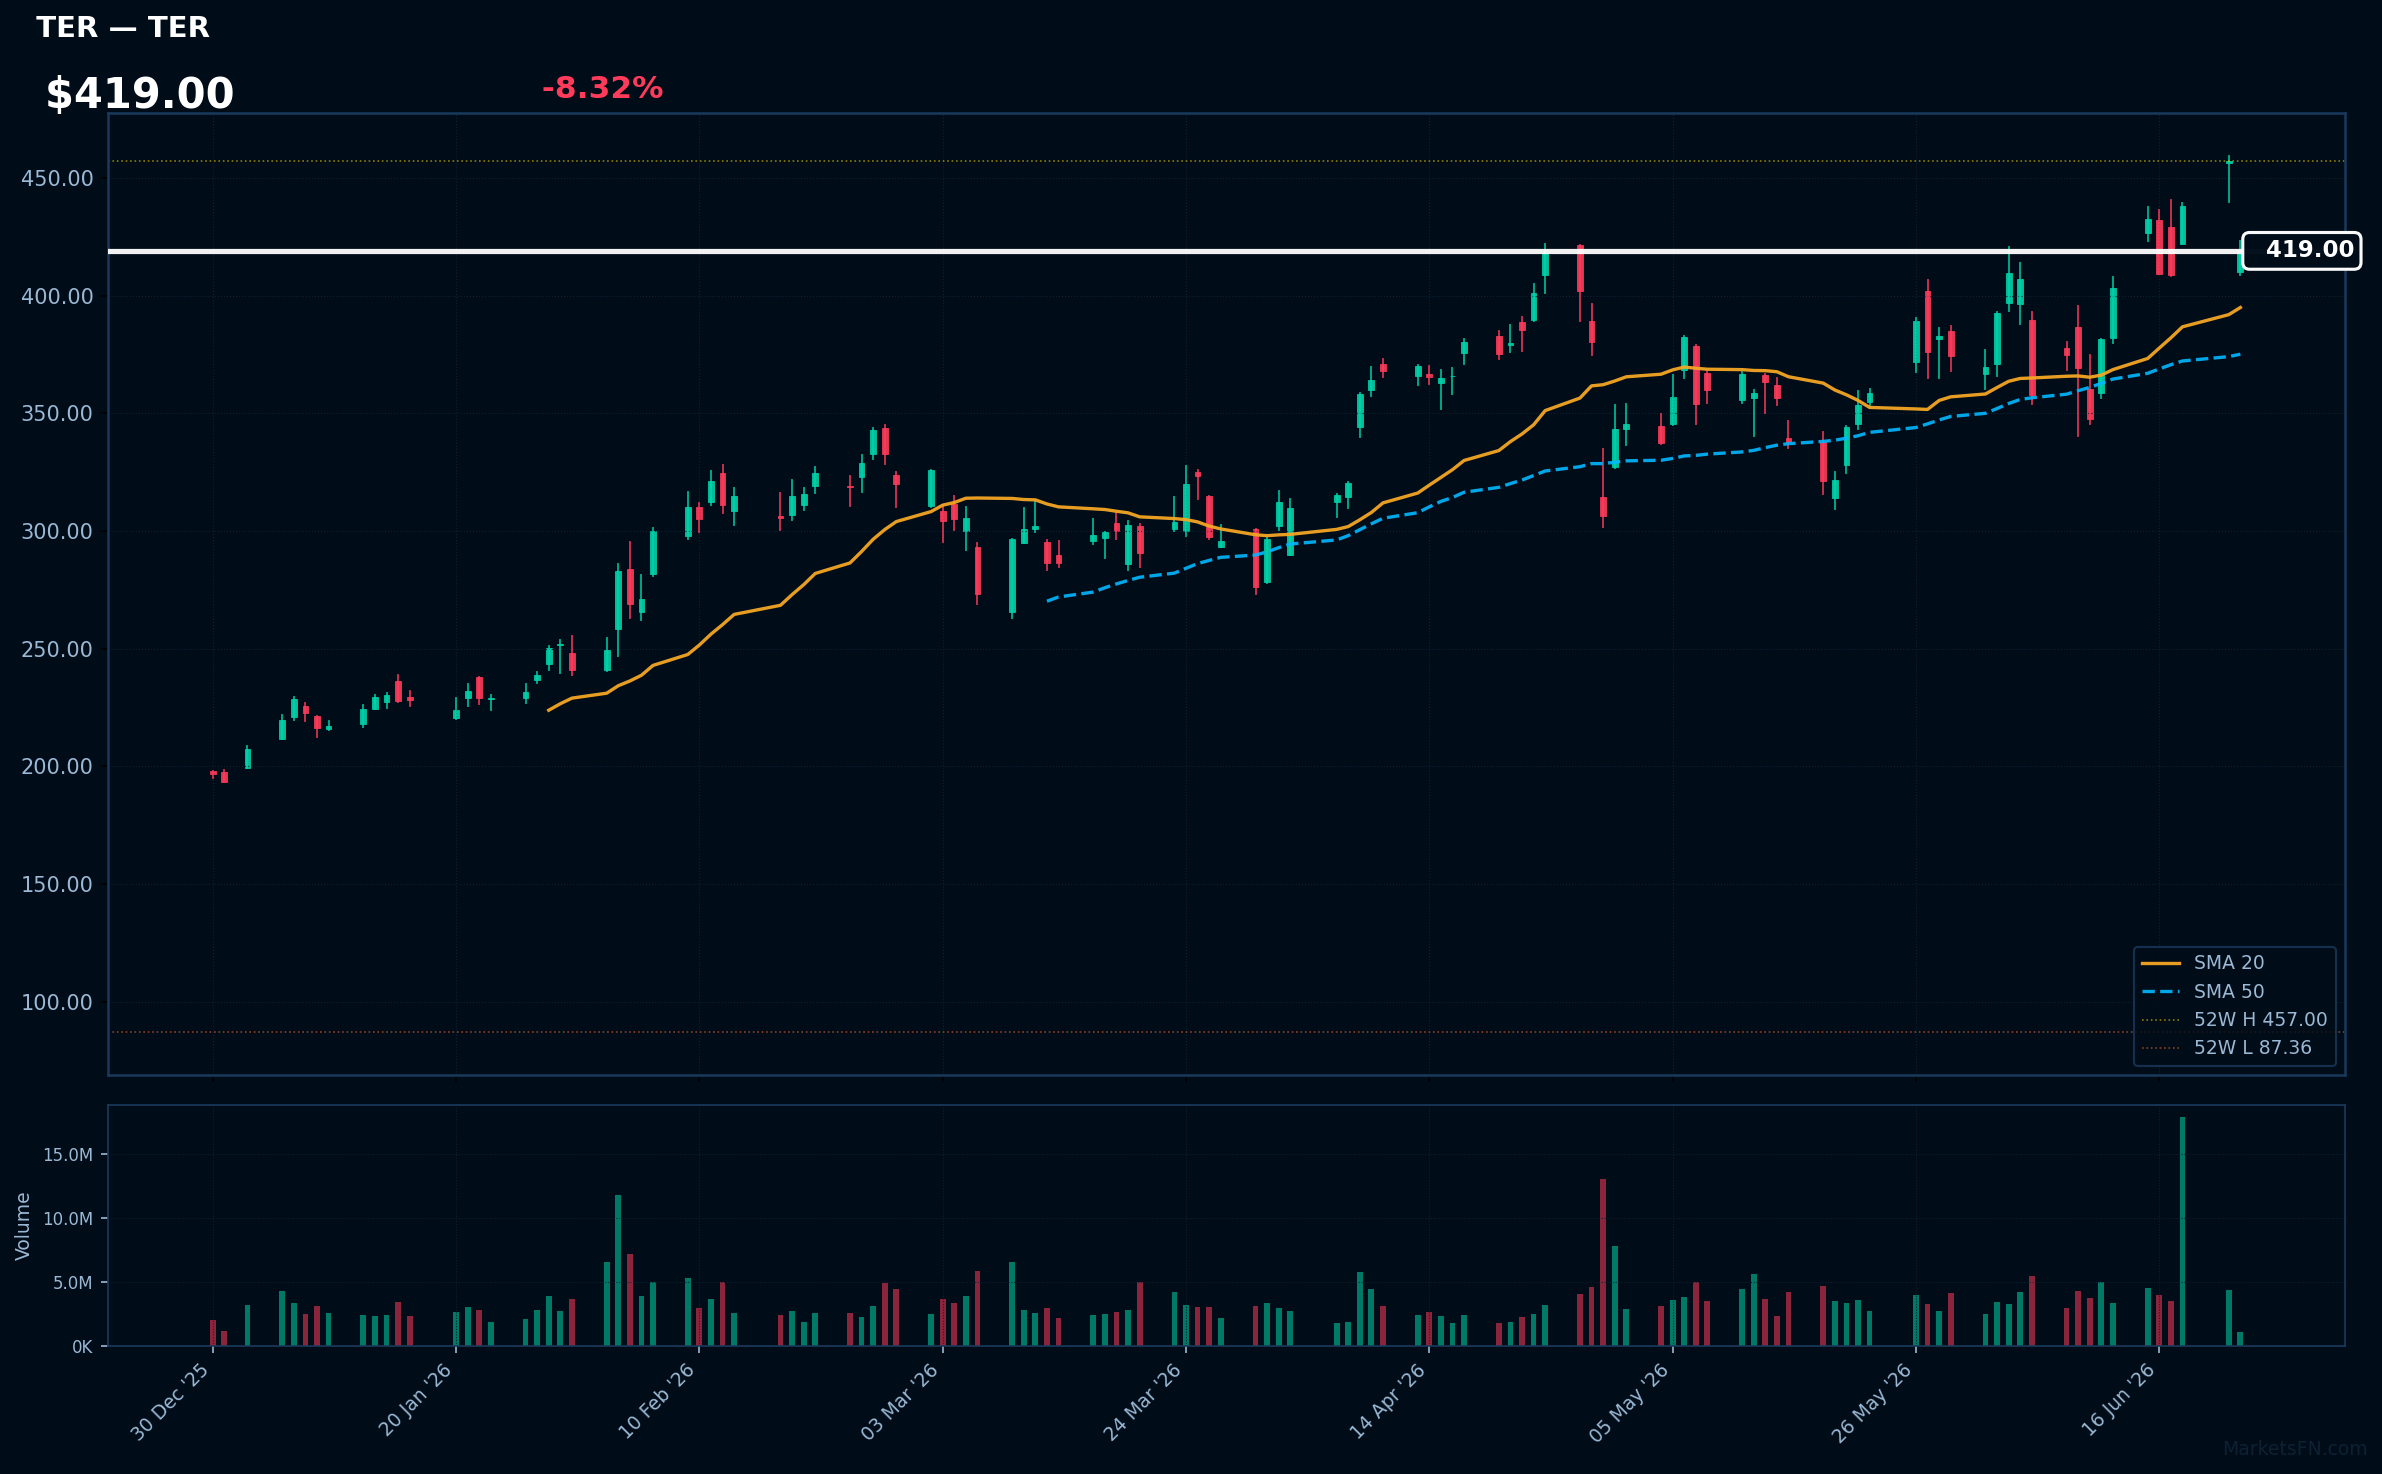
TER | Teradyne, Inc | Technology | Price: $419.00 | Day: -8.32% | 1W: -3.10% | 1M: +18.55% | RSI: 55.6 | vs MA200: +63.3% | Trend: Above MA20, MA50, MA200
Recent headlines (last 12h)
- Nasdaq sell-off continues as SanDisk and Western Digital lead, amid tech 'rotation not liquidation'
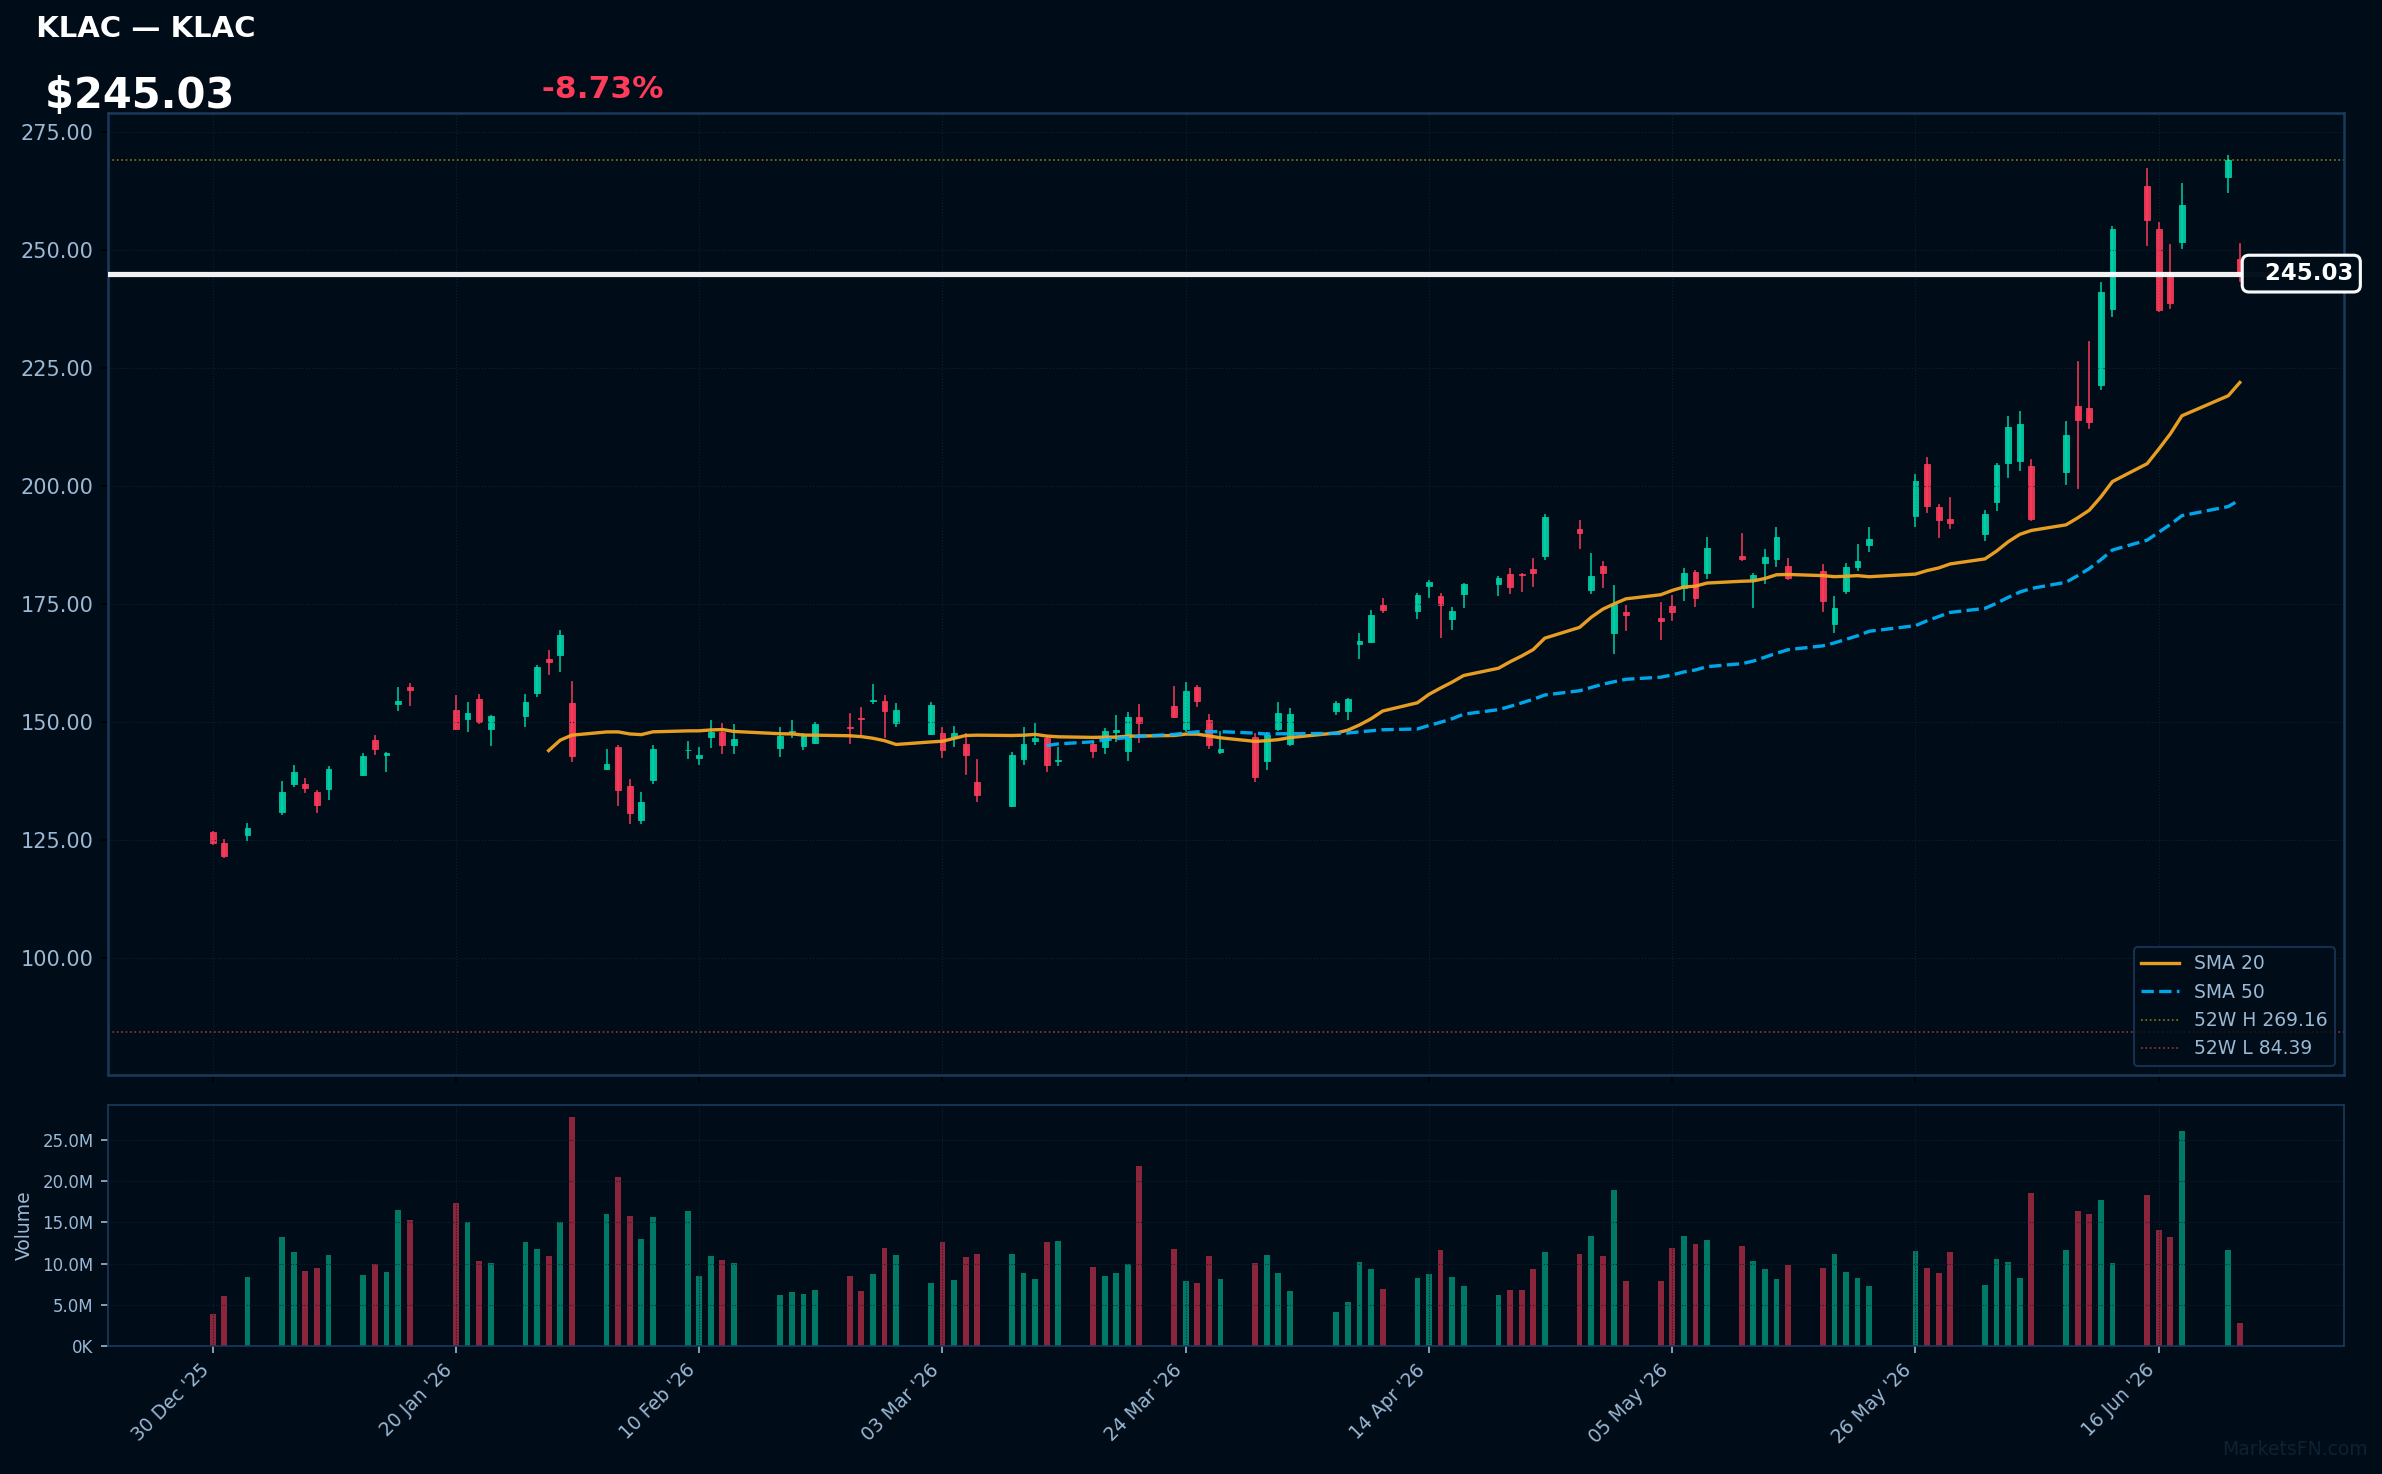
KLAC | KLA Corp | Technology | Price: $245.66 | Day: -8.73% | 1W: -4.44% | 1M: +33.01% | RSI: 60.0 | vs MA200: +68.1% | Trend: Above MA20, MA50, MA200
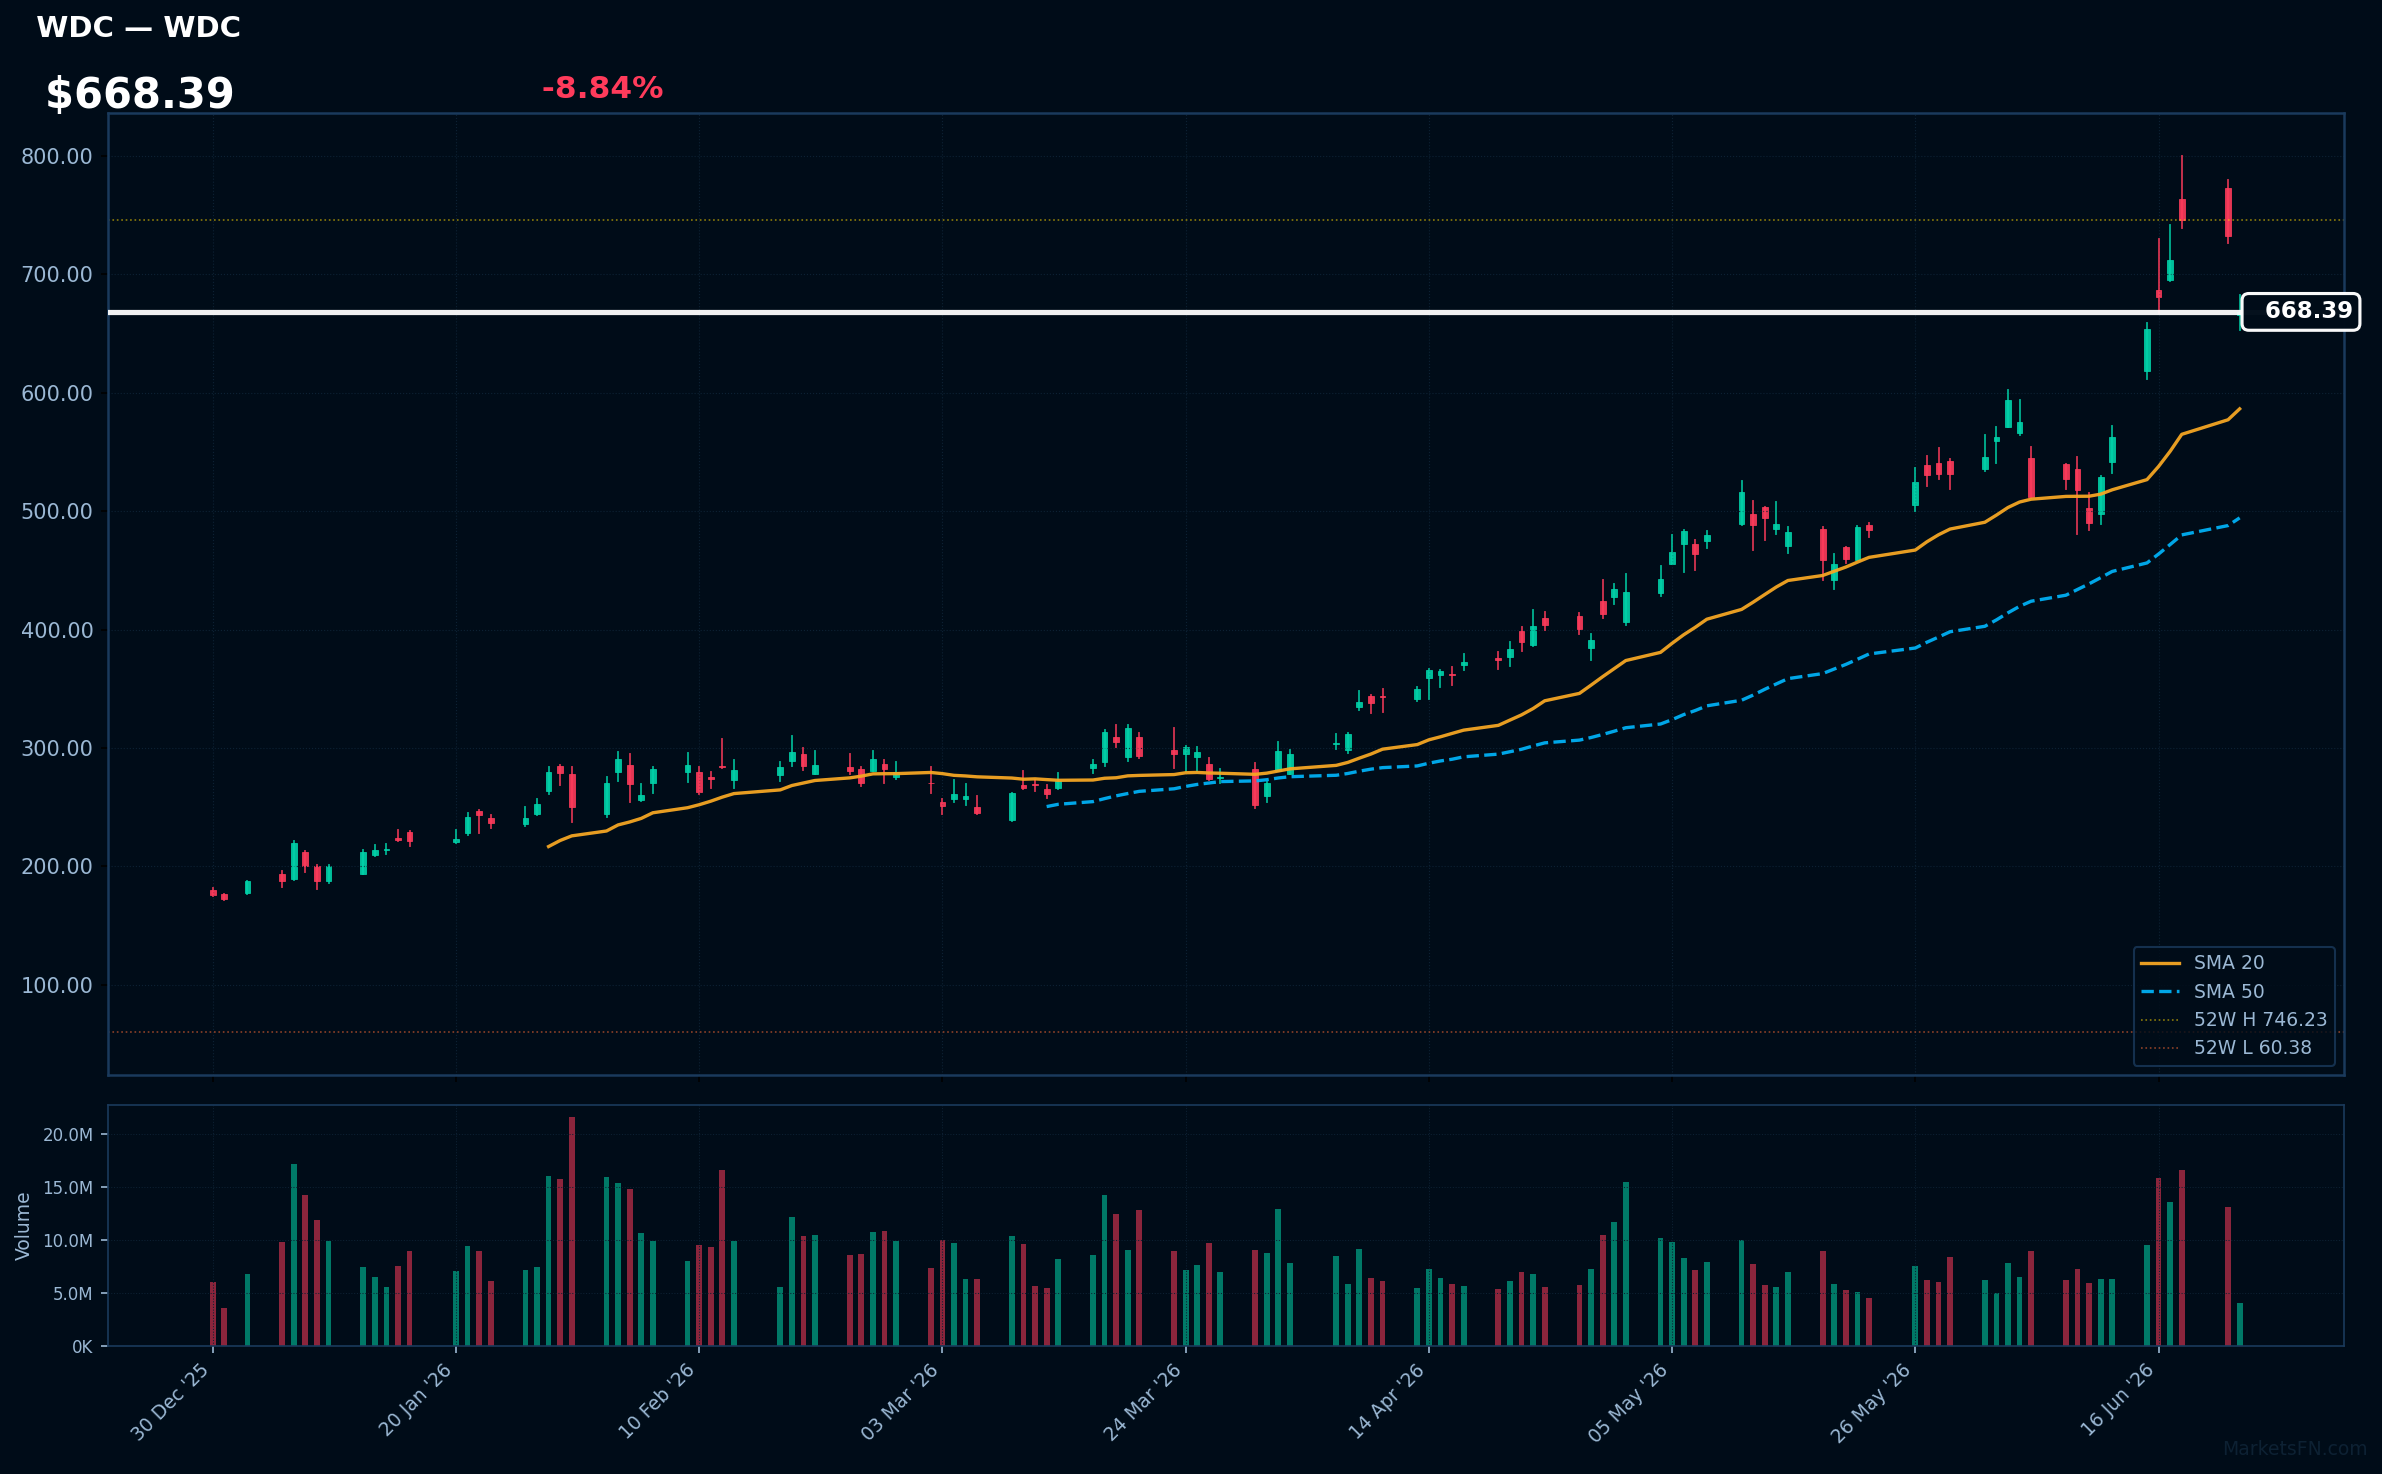
WDC | Western Digital Corp | Technology | Price: $667.83 | Day: -8.84% | 1W: +2.27% | 1M: +37.40% | RSI: 62.9 | vs MA200: +145.3% | Trend: Above MA20, MA50, MA200
Recent headlines (last 12h)
- AI bubble fears send tech stocks plunging
- Nasdaq sell-off continues as SanDisk and Western Digital lead, amid tech 'rotation not liquidation'
- MU, SNDK, DRAM Fall Sharply From Record Highs: Korean Market Crashes 10% Crash On SK Hynix, Samsung Pullback
MU | Micron Technology Inc | Technology | Price: $1103.65 | Day: -8.89% | 1W: +1.49% | 1M: +44.88% | RSI: 60.7 | vs MA200: +168.4% | Trend: Above MA20, MA50, MA200
Recent headlines (last 12h)
- AI bubble fears send tech stocks plunging
- SpaceX succumbs to gravity as its stock price briefly dips below its IPO trading debut
- Tech sell-off: Market is in tug-of-war between AI euphoria & AI phobia
- Stocks to Watch: Intel, Micron, SpaceX, Oracle
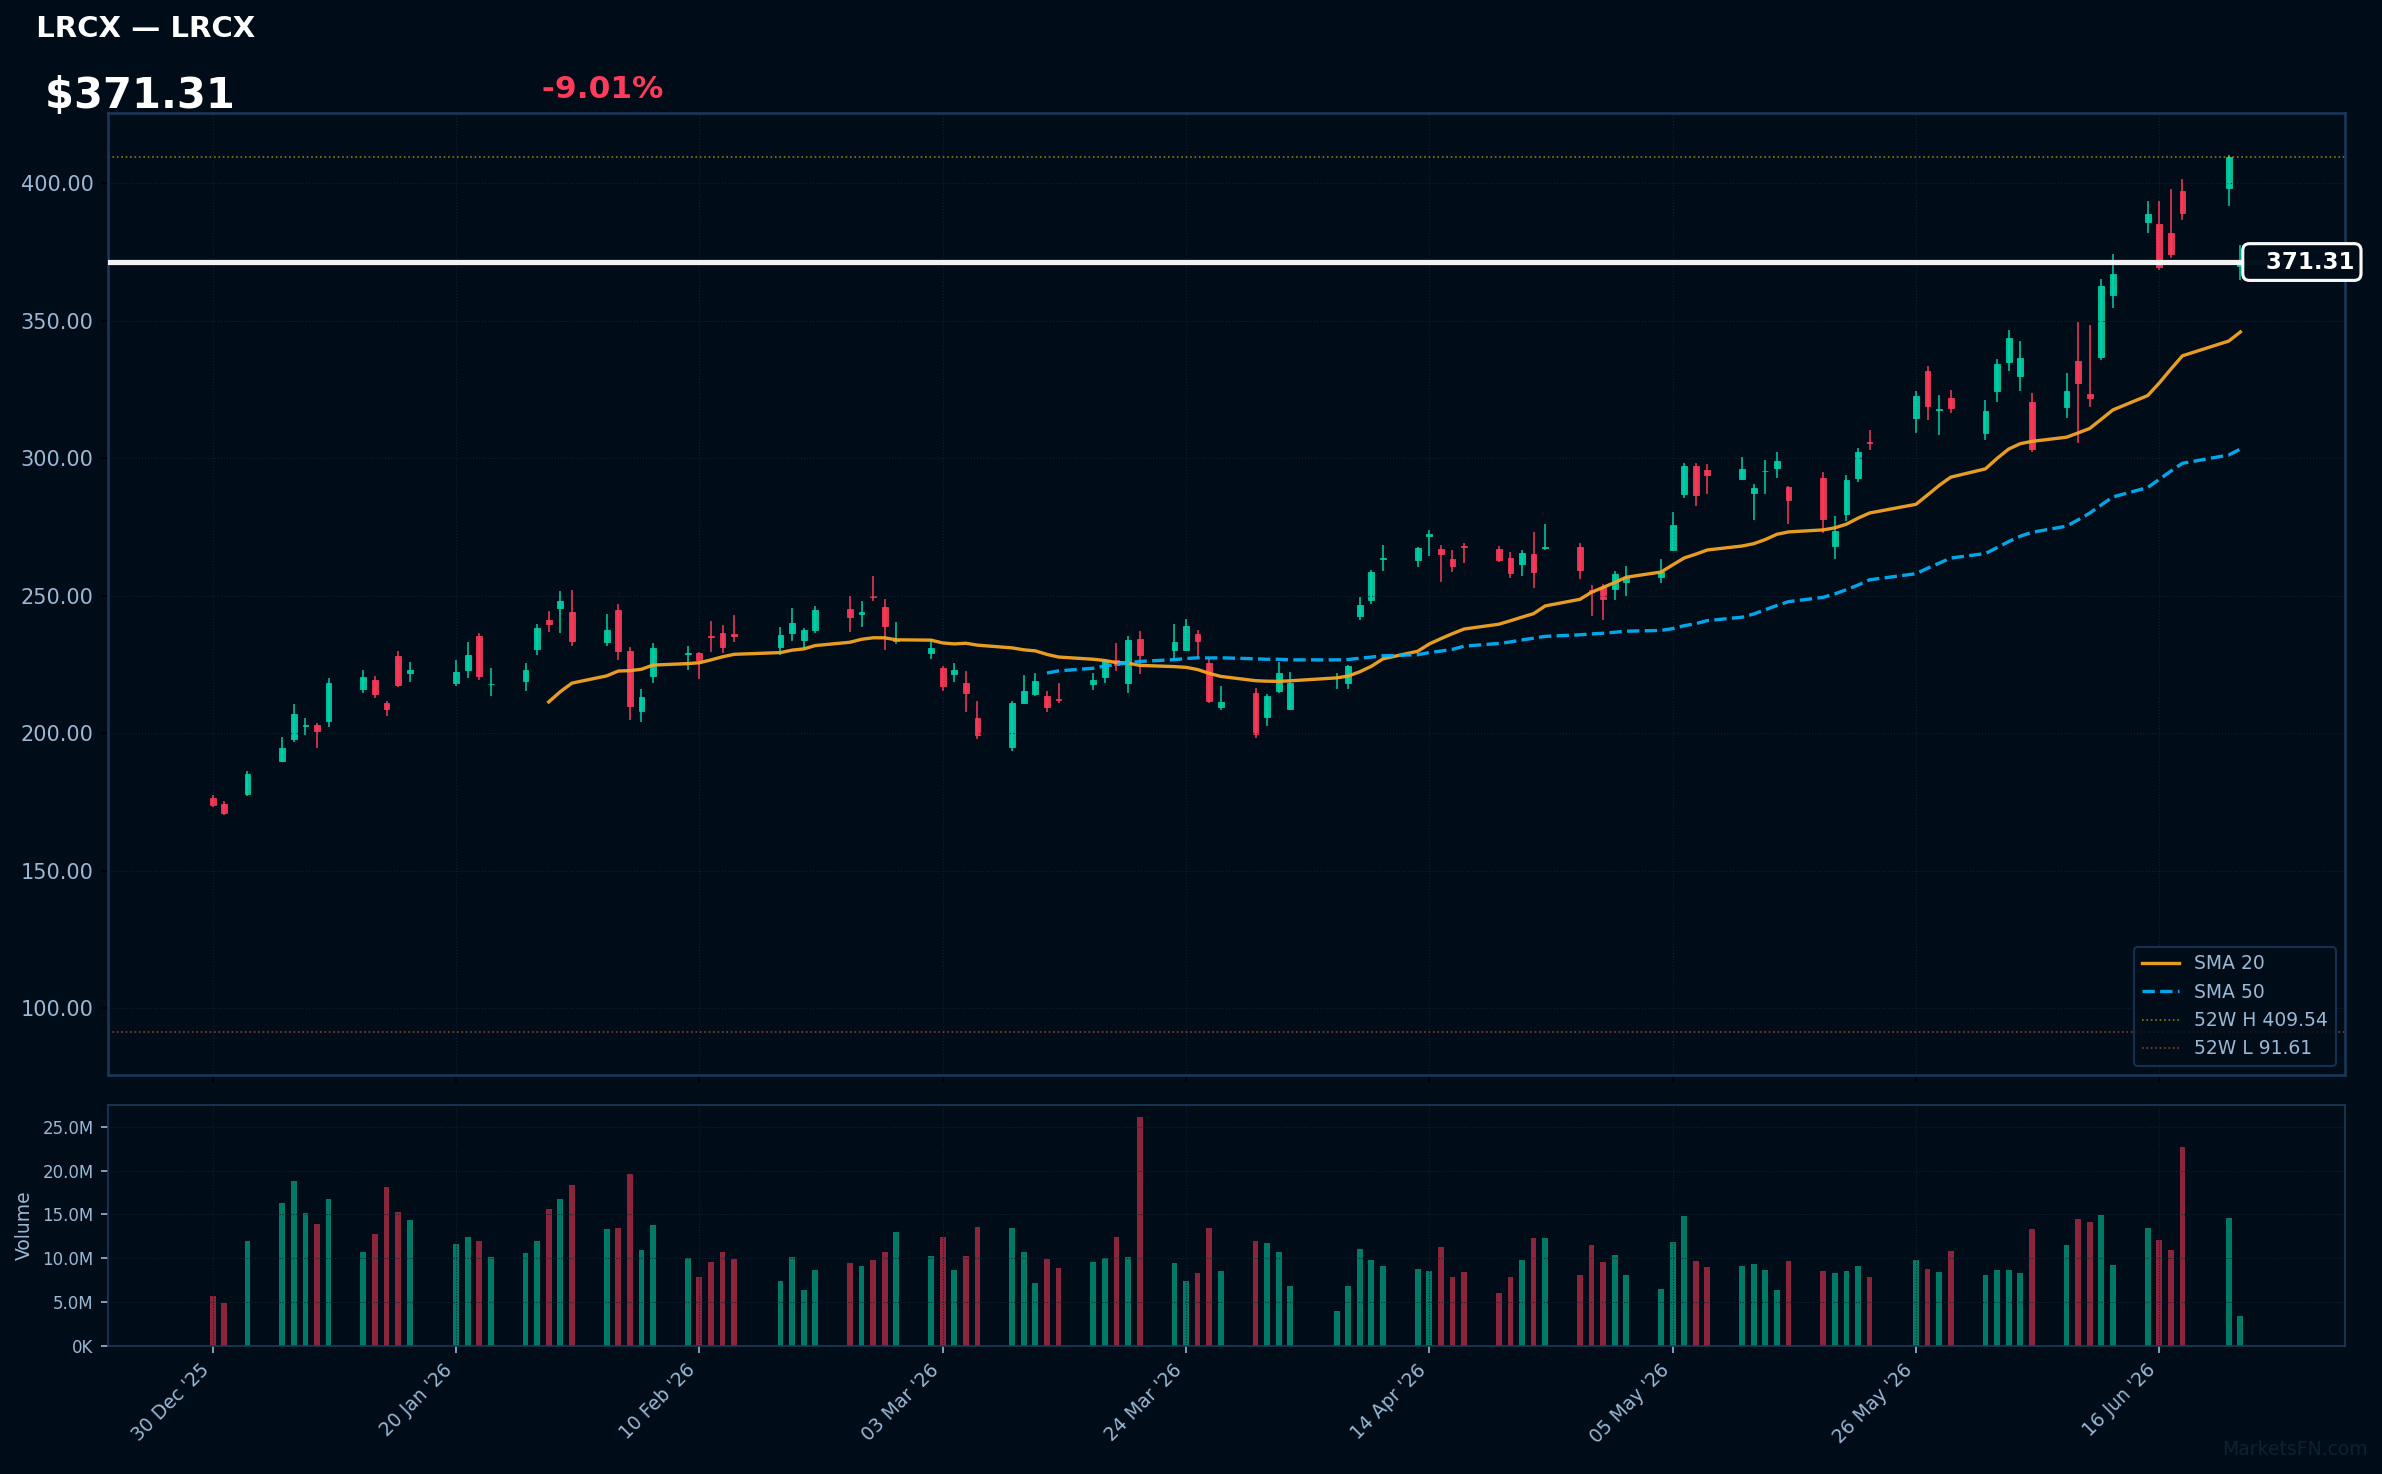
LRCX | Lam Research Corp | Technology | Price: $372.66 | Day: -9.01% | 1W: -4.53% | 1M: +22.85% | RSI: 58.7 | vs MA200: +75.0% | Trend: Above MA20, MA50, MA200
Recent headlines (last 12h)
- Nasdaq sell-off continues as SanDisk and Western Digital lead, amid tech 'rotation not liquidation'
- BofA lists top 5 themes driving next $1tn in incremental semi sales
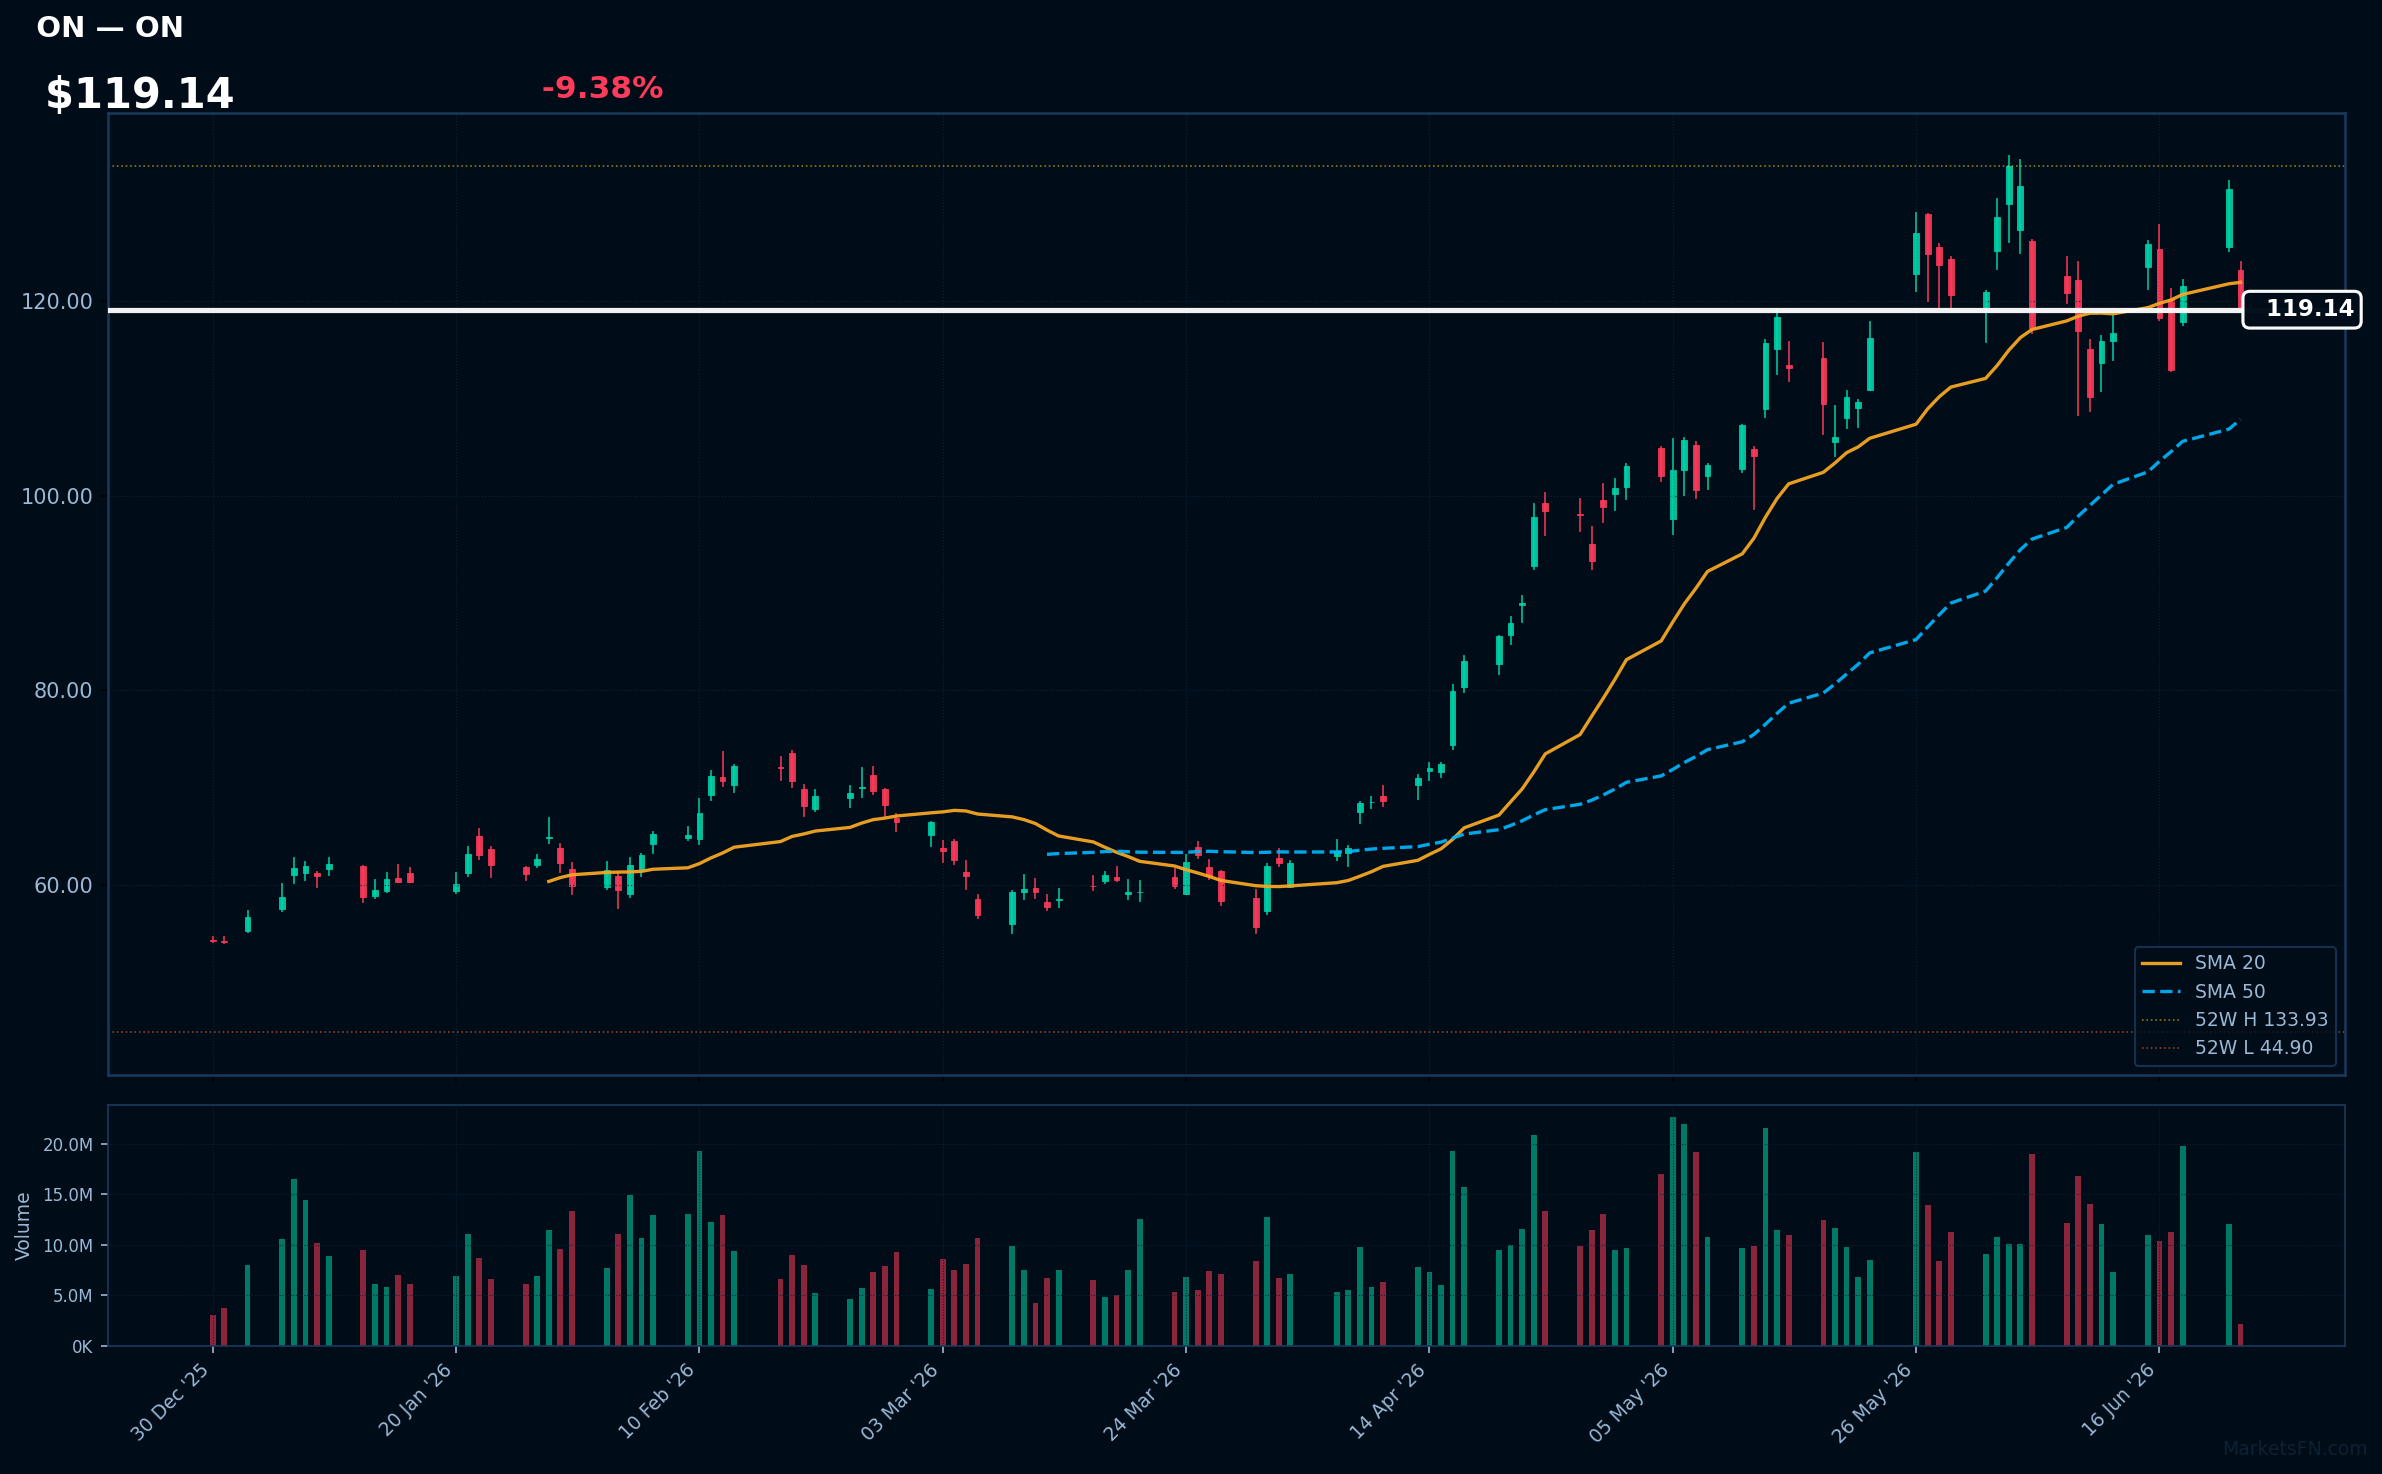
ON | ON Semiconductor Corp | Technology | Price: $119.21 | Day: -9.38% | 1W: -5.37% | 1M: +8.69% | RSI: 51.6 | vs MA200: +72.1% | Trend: Above MA50, MA200 · Below MA20
Recent headlines (last 12h)
- Nasdaq sell-off continues as SanDisk and Western Digital lead, amid tech 'rotation not liquidation'
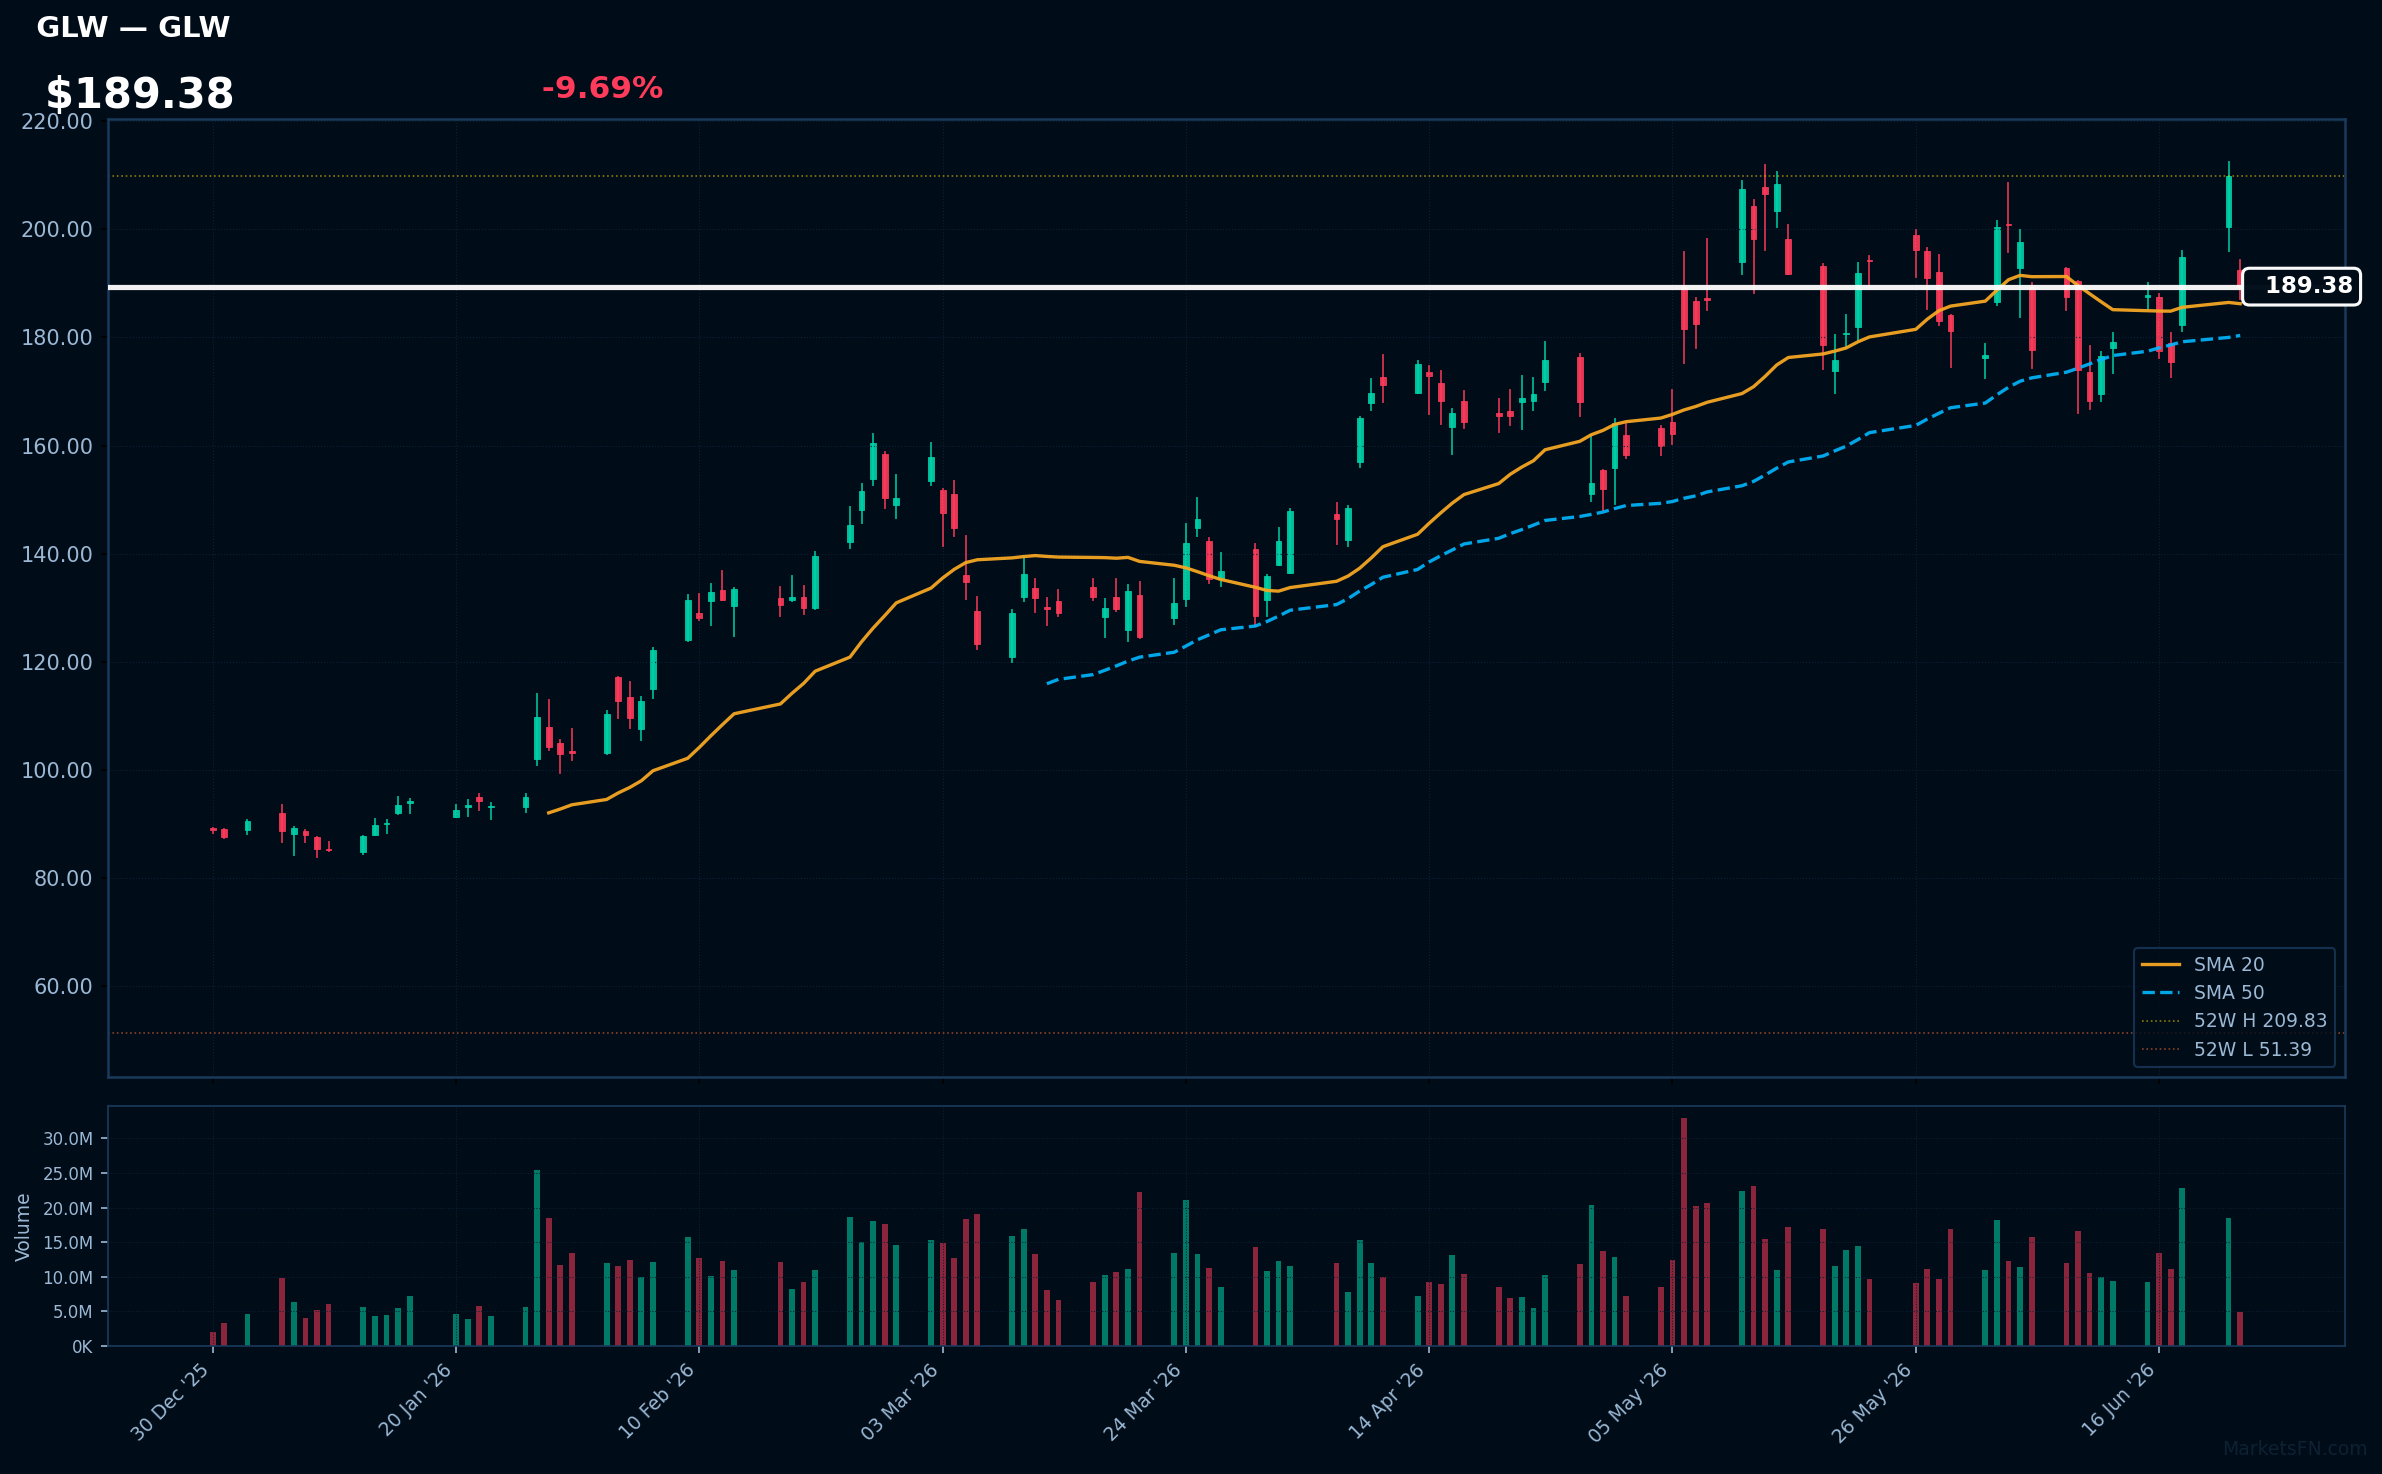
GLW | Corning, Inc | Technology | Price: $189.49 | Day: -9.69% | 1W: +0.80% | 1M: -1.31% | RSI: 51.9 | vs MA200: +55.5% | Trend: Above MA20, MA50, MA200
Recent headlines (last 12h)
- Nasdaq sell-off continues as SanDisk and Western Digital lead, amid tech 'rotation not liquidation'
Market Commentary
The S&P 500 session on June 23, 2026, showed broad-based gains with 63.3% of constituents advancing, indicating a positive tone. The average daily change was +0.09%, suggesting a modest but widespread rally.
Sector rotation is evident in the top gainers and losers. Technology stocks were under pressure, with 6 out of 10 losers hailing from this sector, including TXN, QCOM, and AMAT. Conversely, the top gainers were diversified across sectors, with notable representation from Consumer Cyclical (TGT, AZO, BALL), Healthcare (MRNA), and Financial (AJG, BRO). This rotation may indicate a shift in investor sentiment towards more defensive or cyclical sectors.
Traders should monitor the MA200, as only 2.6% of stocks are currently trading above this key level. A sustained move above MA200 for a larger proportion of constituents could signal a stronger uptrend. Conversely, a failure to break through this level may indicate continued consolidation. The next catalyst will be the upcoming earnings reports from key Technology sector players, which may validate or invalidate the current sector rotation trend.
Methodology
Daily ranking uses the latest session close versus the prior close. RSI (14-day EWM), MA20, MA50, and MA200 are computed from 12 months of daily OHLCV data sourced from Yahoo Finance. Charts show the last 120 trading sessions with SMA 20/50, 52-week H/L markers, and volume. Recent news (last 12 h) is sourced from FinViz. Updated every trading day.
Disclaimer
The content on MarketsFN.com is provided for educational and informational purposes only. It does not constitute financial advice, investment recommendations, or trading guidance. All investments involve risks, and past performance does not guarantee future results. You are solely responsible for your investment decisions and should conduct independent research and consult a qualified financial advisor before acting. MarketsFN.com and its authors are not liable for any losses or damages arising from your use of this information.
Related Articles
- Carnival Corporation (CCL) Q2 2026 Financial Results Summary — Carnival Corporation (CCL) Q2 2026: Record Revenues and Earnings Growth — Strong Performance Carnival Corporation…
- S&P 500 Bull & Bear Radar — June 22, 2026 — S&P 500 Bull & Bear Radar — June 22, 2026 A daily technical sweep of 496 S&P 500 constituents ranked by session…
- Nasdaq 100 Bull & Bear Radar — June 22, 2026 — Nasdaq 100 Bull & Bear Radar — June 22, 2026 A daily technical sweep of 100 Nasdaq 100 constituents ranked by session…
- S&P 500 52-Week Highs & Lows Radar: GE Aerospace (GE), Palantir (PLTR) and more — S&P 500 stocks nearest to their 52-week high and low. Bloomberg-style charts, RSI/MA analysis and Grok commentary.
- S&P 500 52-Week Highs & Lows Radar: GE Aerospace (GE), Salesforce (CRM) and more — S&P 500 stocks nearest to their 52-week high and low. Bloomberg-style charts, RSI/MA analysis and Grok commentary.