S&P 500 Bull & Bear Radar — June 22, 2026
· Stocks · QuoteReporter
S&P 500 Bull & Bear Radar — June 22, 2026
A daily technical sweep of 496 S&P 500 constituents ranked by session performance, enriched with RSI, MA20/MA50/MA200 trend signals, Bloomberg-style charts, and recent news.
Index-Wide Breadth
| Constituents tracked | 496 |
| Advancing | 296 (59.7%) |
| Declining | 198 (39.9%) |
| Average daily change | +0.30% |
| Above MA200 | 11 (2.2%) |
Top 10 Gainers
Today's strongest S&P 500 performers. Sector leadership: Technology (6), Financial (2), Industrials (1), Healthcare (1).
| Ticker | Company | Sector | Price | Day % | 1W % | 1M % | RSI | vs MA200 | Trend |
|---|---|---|---|---|---|---|---|---|---|
| SMCI | Super Micro Computer Inc | Technology | $34.42 | +12.28% | +12.36% | +2.29% | 49.2 | -3.1% | Above MA50 · Below MA20, MA200 |
| ON | ON Semiconductor Corp | Technology | $131.77 | +8.35% | +12.60% | +19.33% | 60.5 | +91.2% | Above MA20, MA50, MA200 |
| SWKS | Skyworks Solutions, Inc | Technology | $77.26 | +6.64% | +4.37% | +3.83% | 55.7 | +16.3% | Above MA20, MA50, MA200 |
| GNRC | Generac Holdings Inc | Industrials | $295.24 | +5.76% | +12.57% | +20.45% | 63.8 | +50.5% | Above MA20, MA50, MA200 |
| COIN | Coinbase Global Inc | Financial | $171.93 | +5.31% | +7.47% | -10.23% | 49.0 | -27.6% | Above MA20 · Below MA50, MA200 |
| DELL | Dell Technologies Inc | Technology | $429.99 | +5.00% | +8.38% | +76.47% | 67.6 | +145.5% | Above MA20, MA50, MA200 |
| MU | Micron Technology Inc | Technology | $1189.19 | +4.87% | +21.06% | +62.34% | 68.8 | +192.8% | Above MA20, MA50, MA200 |
| AIG | American International Group Inc | Financial | $77.61 | +4.86% | +2.44% | -0.56% | 58.7 | -0.1% | Above MA20, MA50 · Below MA200 |
| STX | Seagate Technology Holdings Plc | Technology | $1121.98 | +4.84% | +19.96% | +48.71% | 76.8 | +163.0% | Above MA20, MA50, MA200 |
| ABBV | Abbvie Inc | Healthcare | $226.84 | +4.78% | -0.56% | +6.67% | 59.3 | +2.8% | Above MA20, MA50, MA200 |
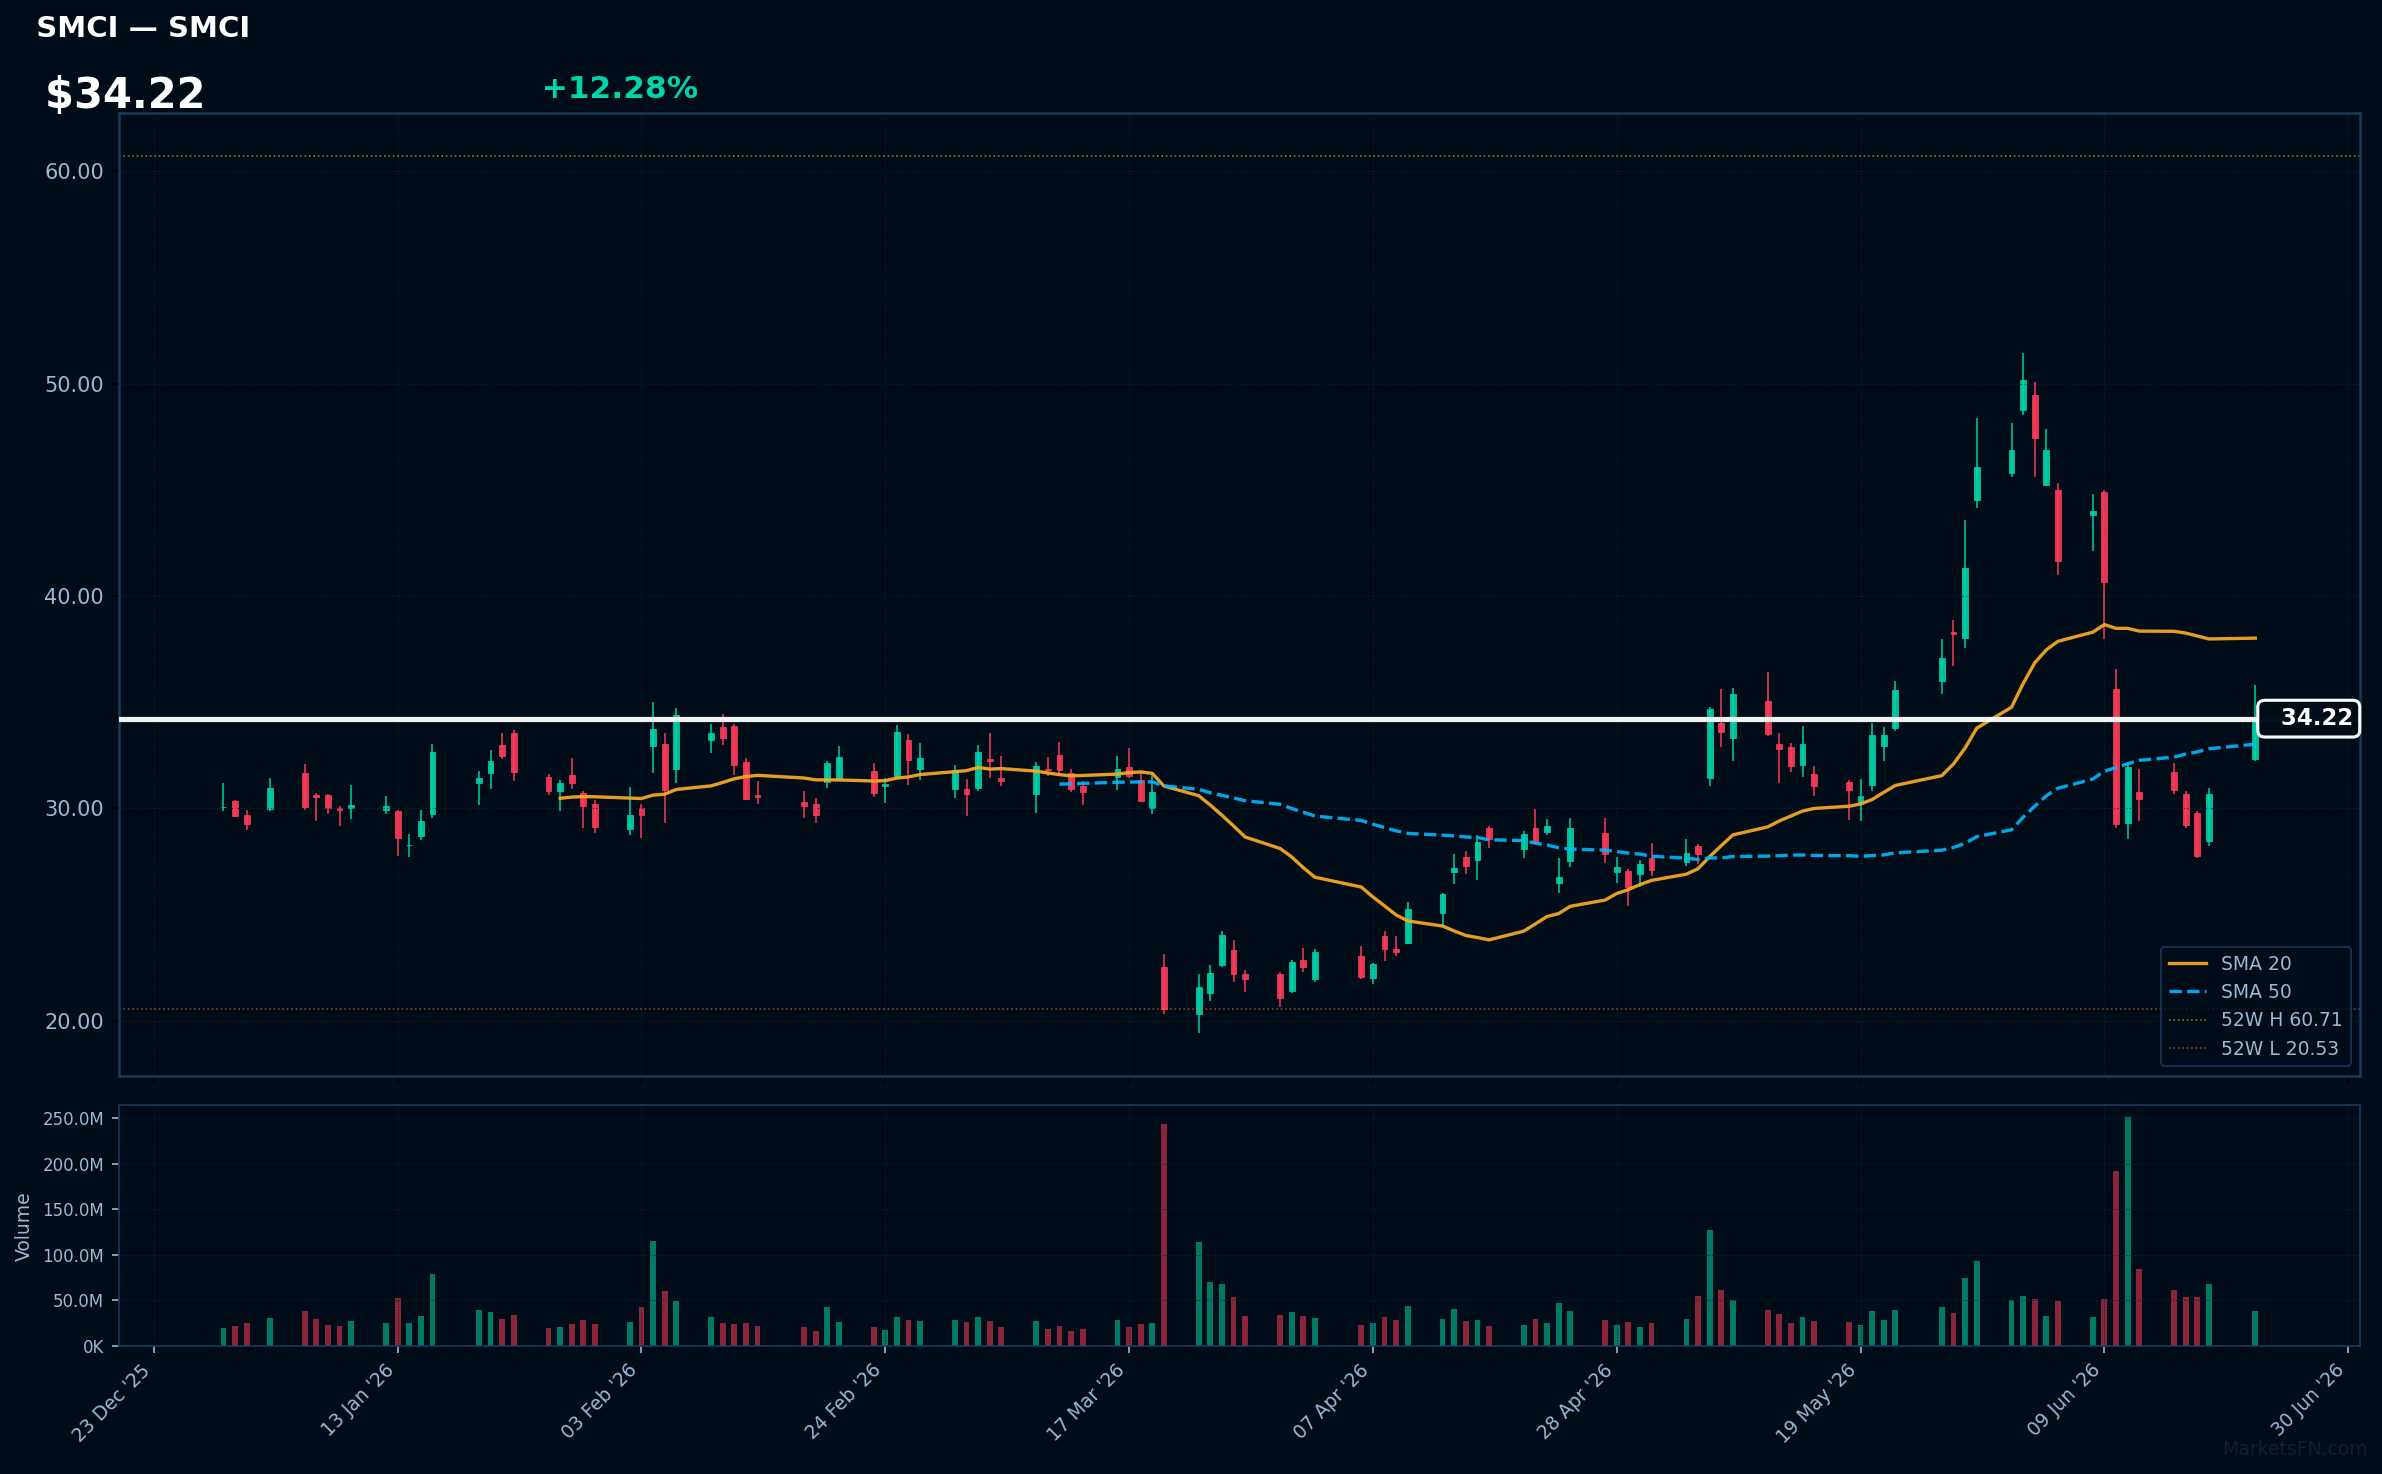
SMCI | Super Micro Computer Inc | Technology | Price: $34.42 | Day: +12.28% | 1W: +12.36% | 1M: +2.29% | RSI: 49.2 | vs MA200: -3.1% | Trend: Above MA50 · Below MA20, MA200
Recent headlines (last 12h)
- Supermicro Delivers NVIDIA Vera Rubin NVL4 End-to-End DCBBS Blueprint with Native FP64 Performance for Converged HPC and AI Infrastructure
- Dow Jones opens higher but Nasdaq flat as hawkish Fed still looms
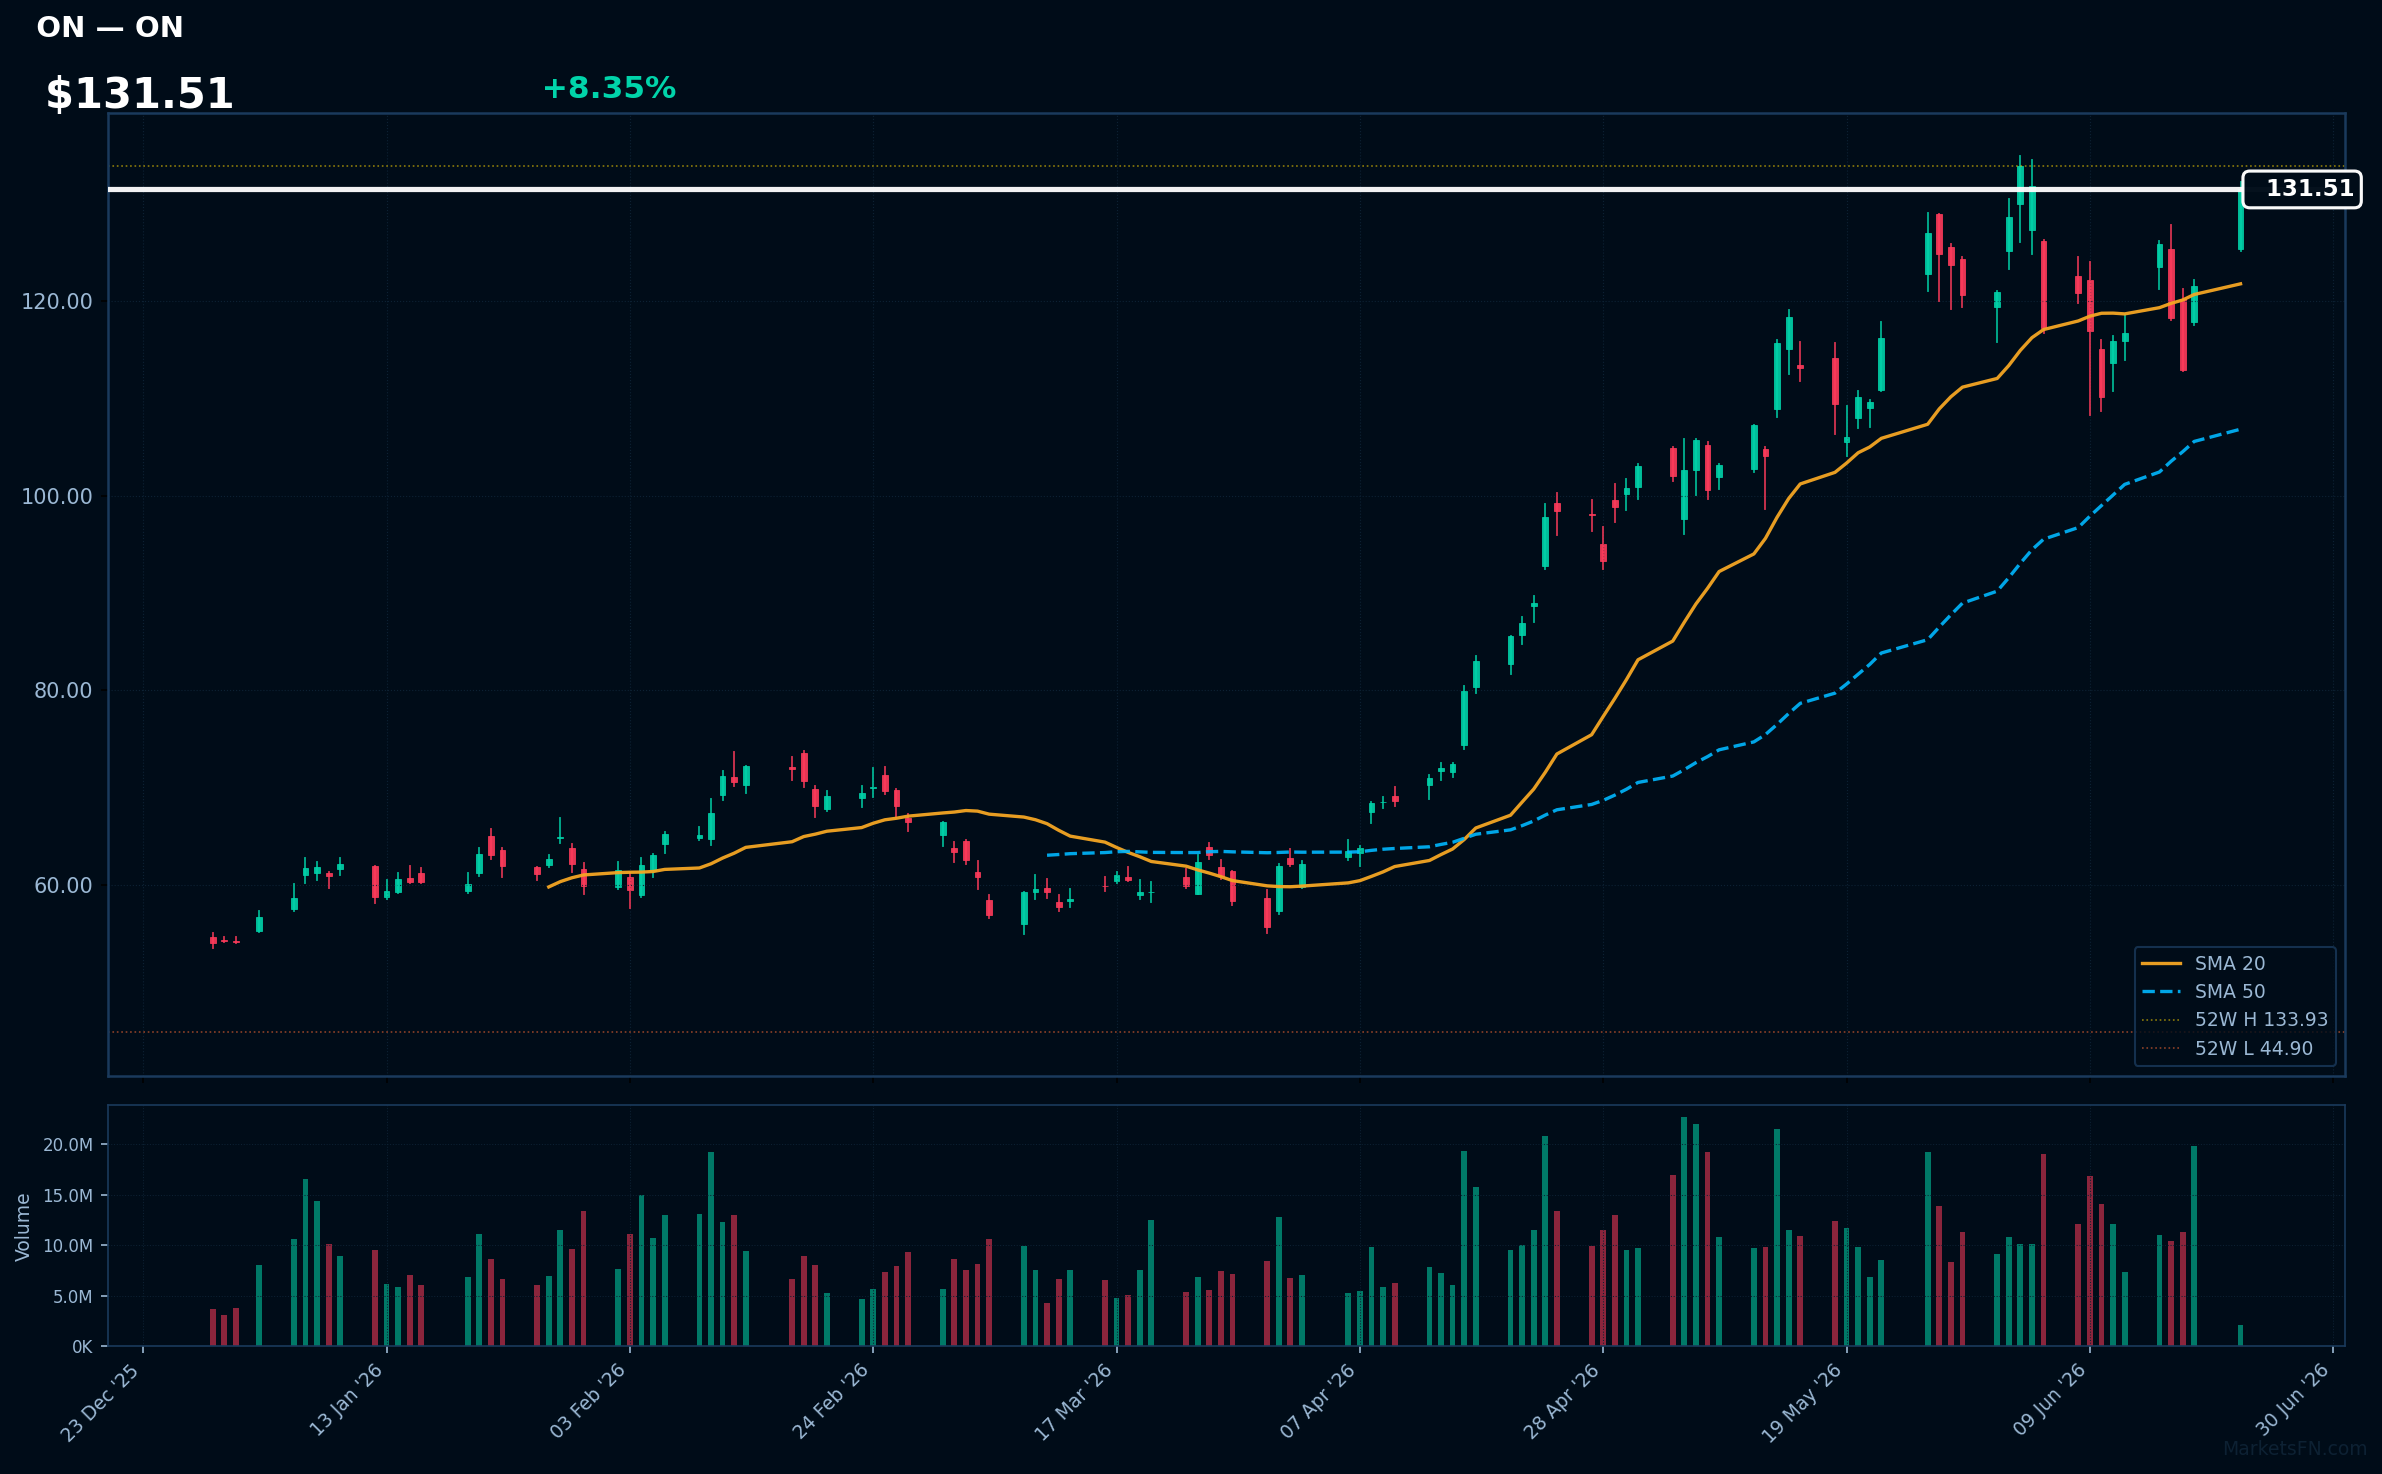
ON | ON Semiconductor Corp | Technology | Price: $131.77 | Day: +8.35% | 1W: +12.60% | 1M: +19.33% | RSI: 60.5 | vs MA200: +91.2% | Trend: Above MA20, MA50, MA200
Recent headlines (last 12h)
- Monday shaping up to be another big day for semiconductor names
- Dow Jones opens higher but Nasdaq flat as hawkish Fed still looms
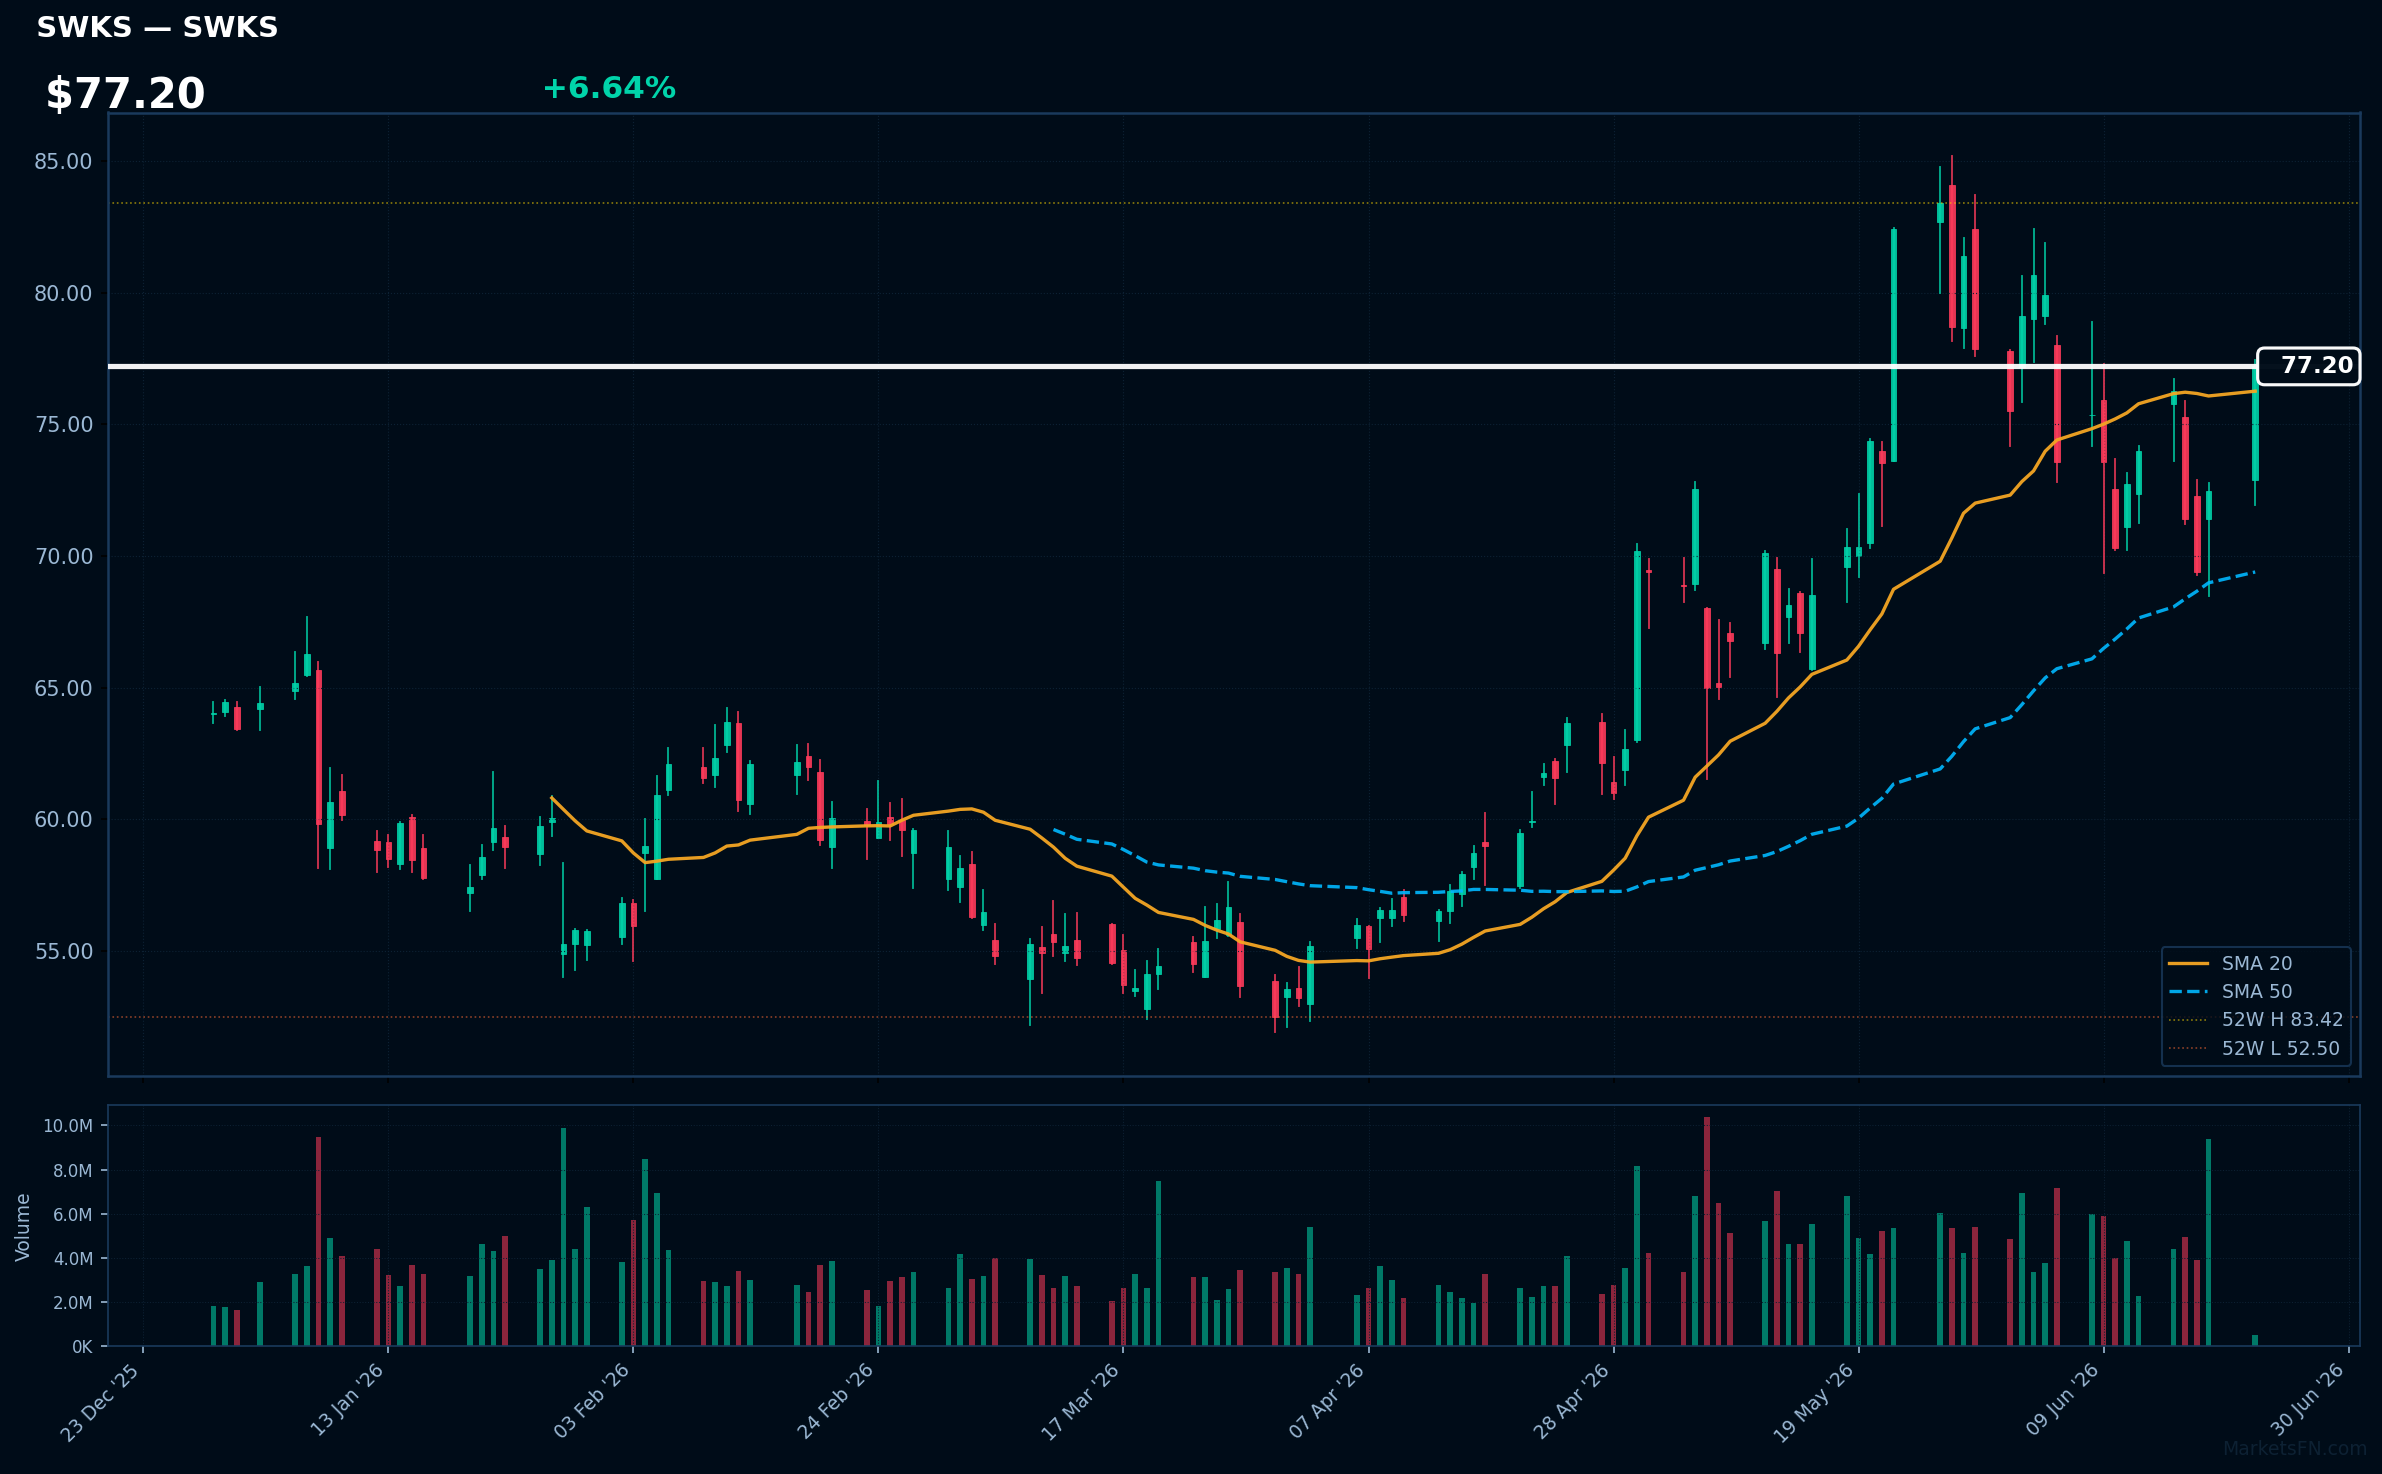
SWKS | Skyworks Solutions, Inc | Technology | Price: $77.26 | Day: +6.64% | 1W: +4.37% | 1M: +3.83% | RSI: 55.7 | vs MA200: +16.3% | Trend: Above MA20, MA50, MA200
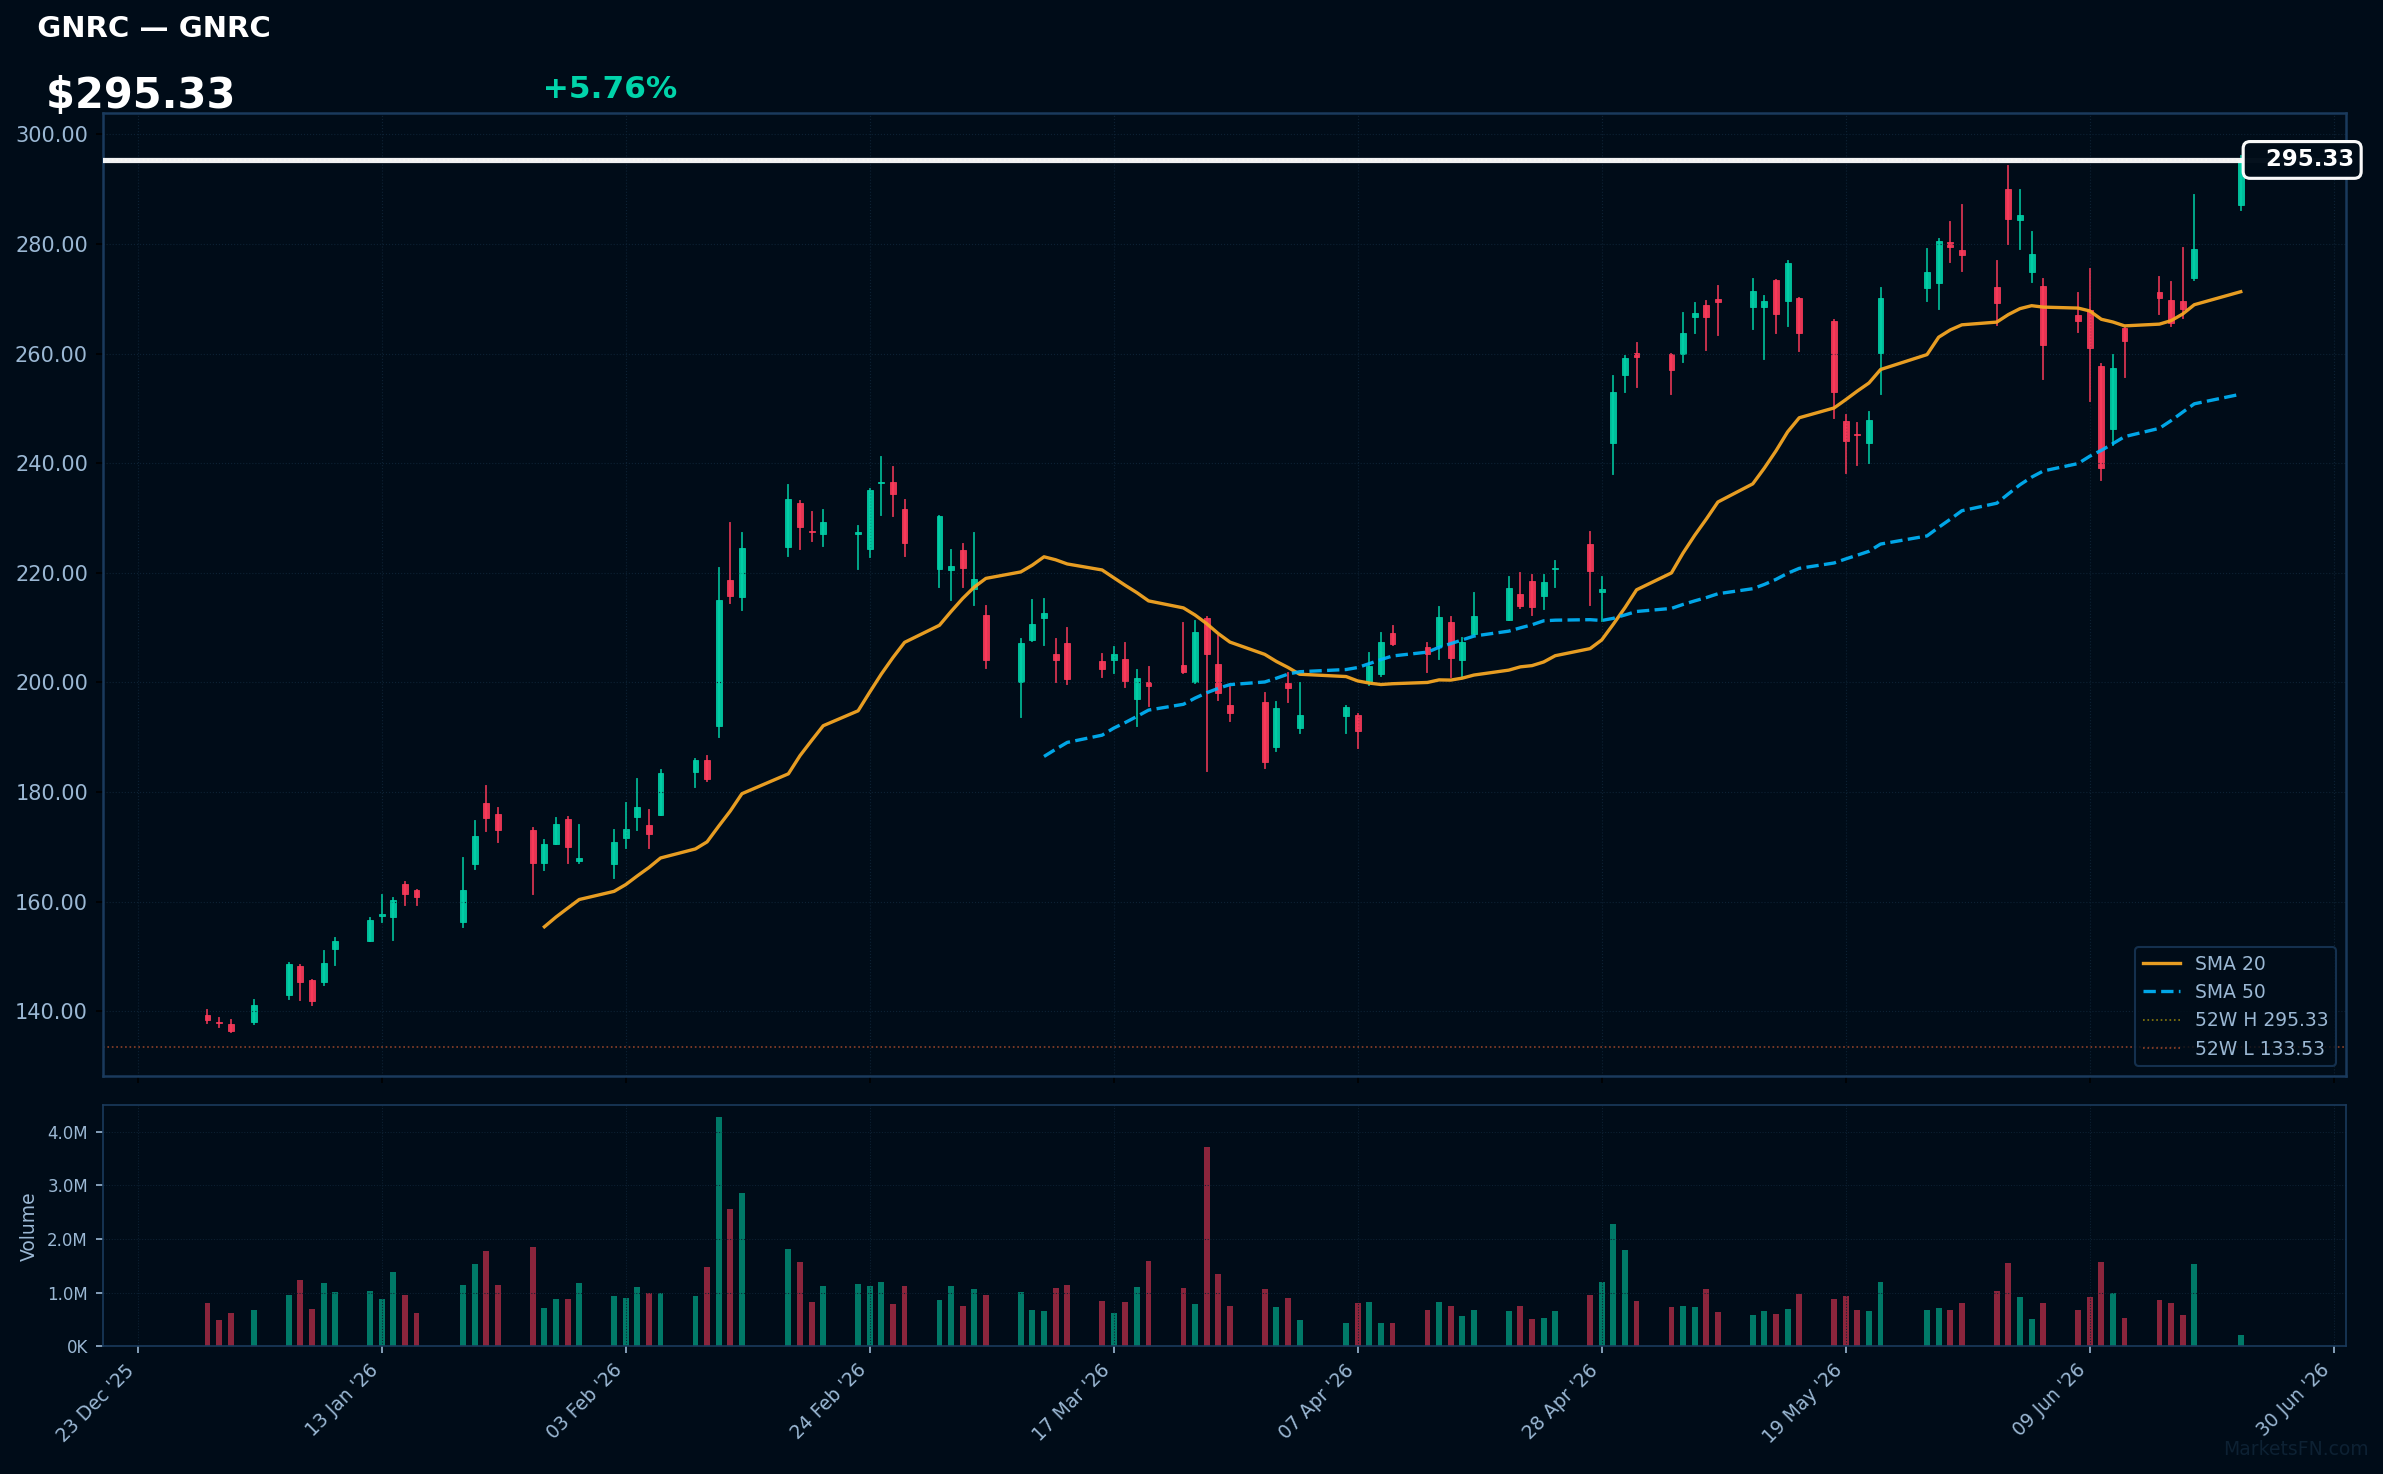
GNRC | Generac Holdings Inc | Industrials | Price: $295.24 | Day: +5.76% | 1W: +12.57% | 1M: +20.45% | RSI: 63.8 | vs MA200: +50.5% | Trend: Above MA20, MA50, MA200
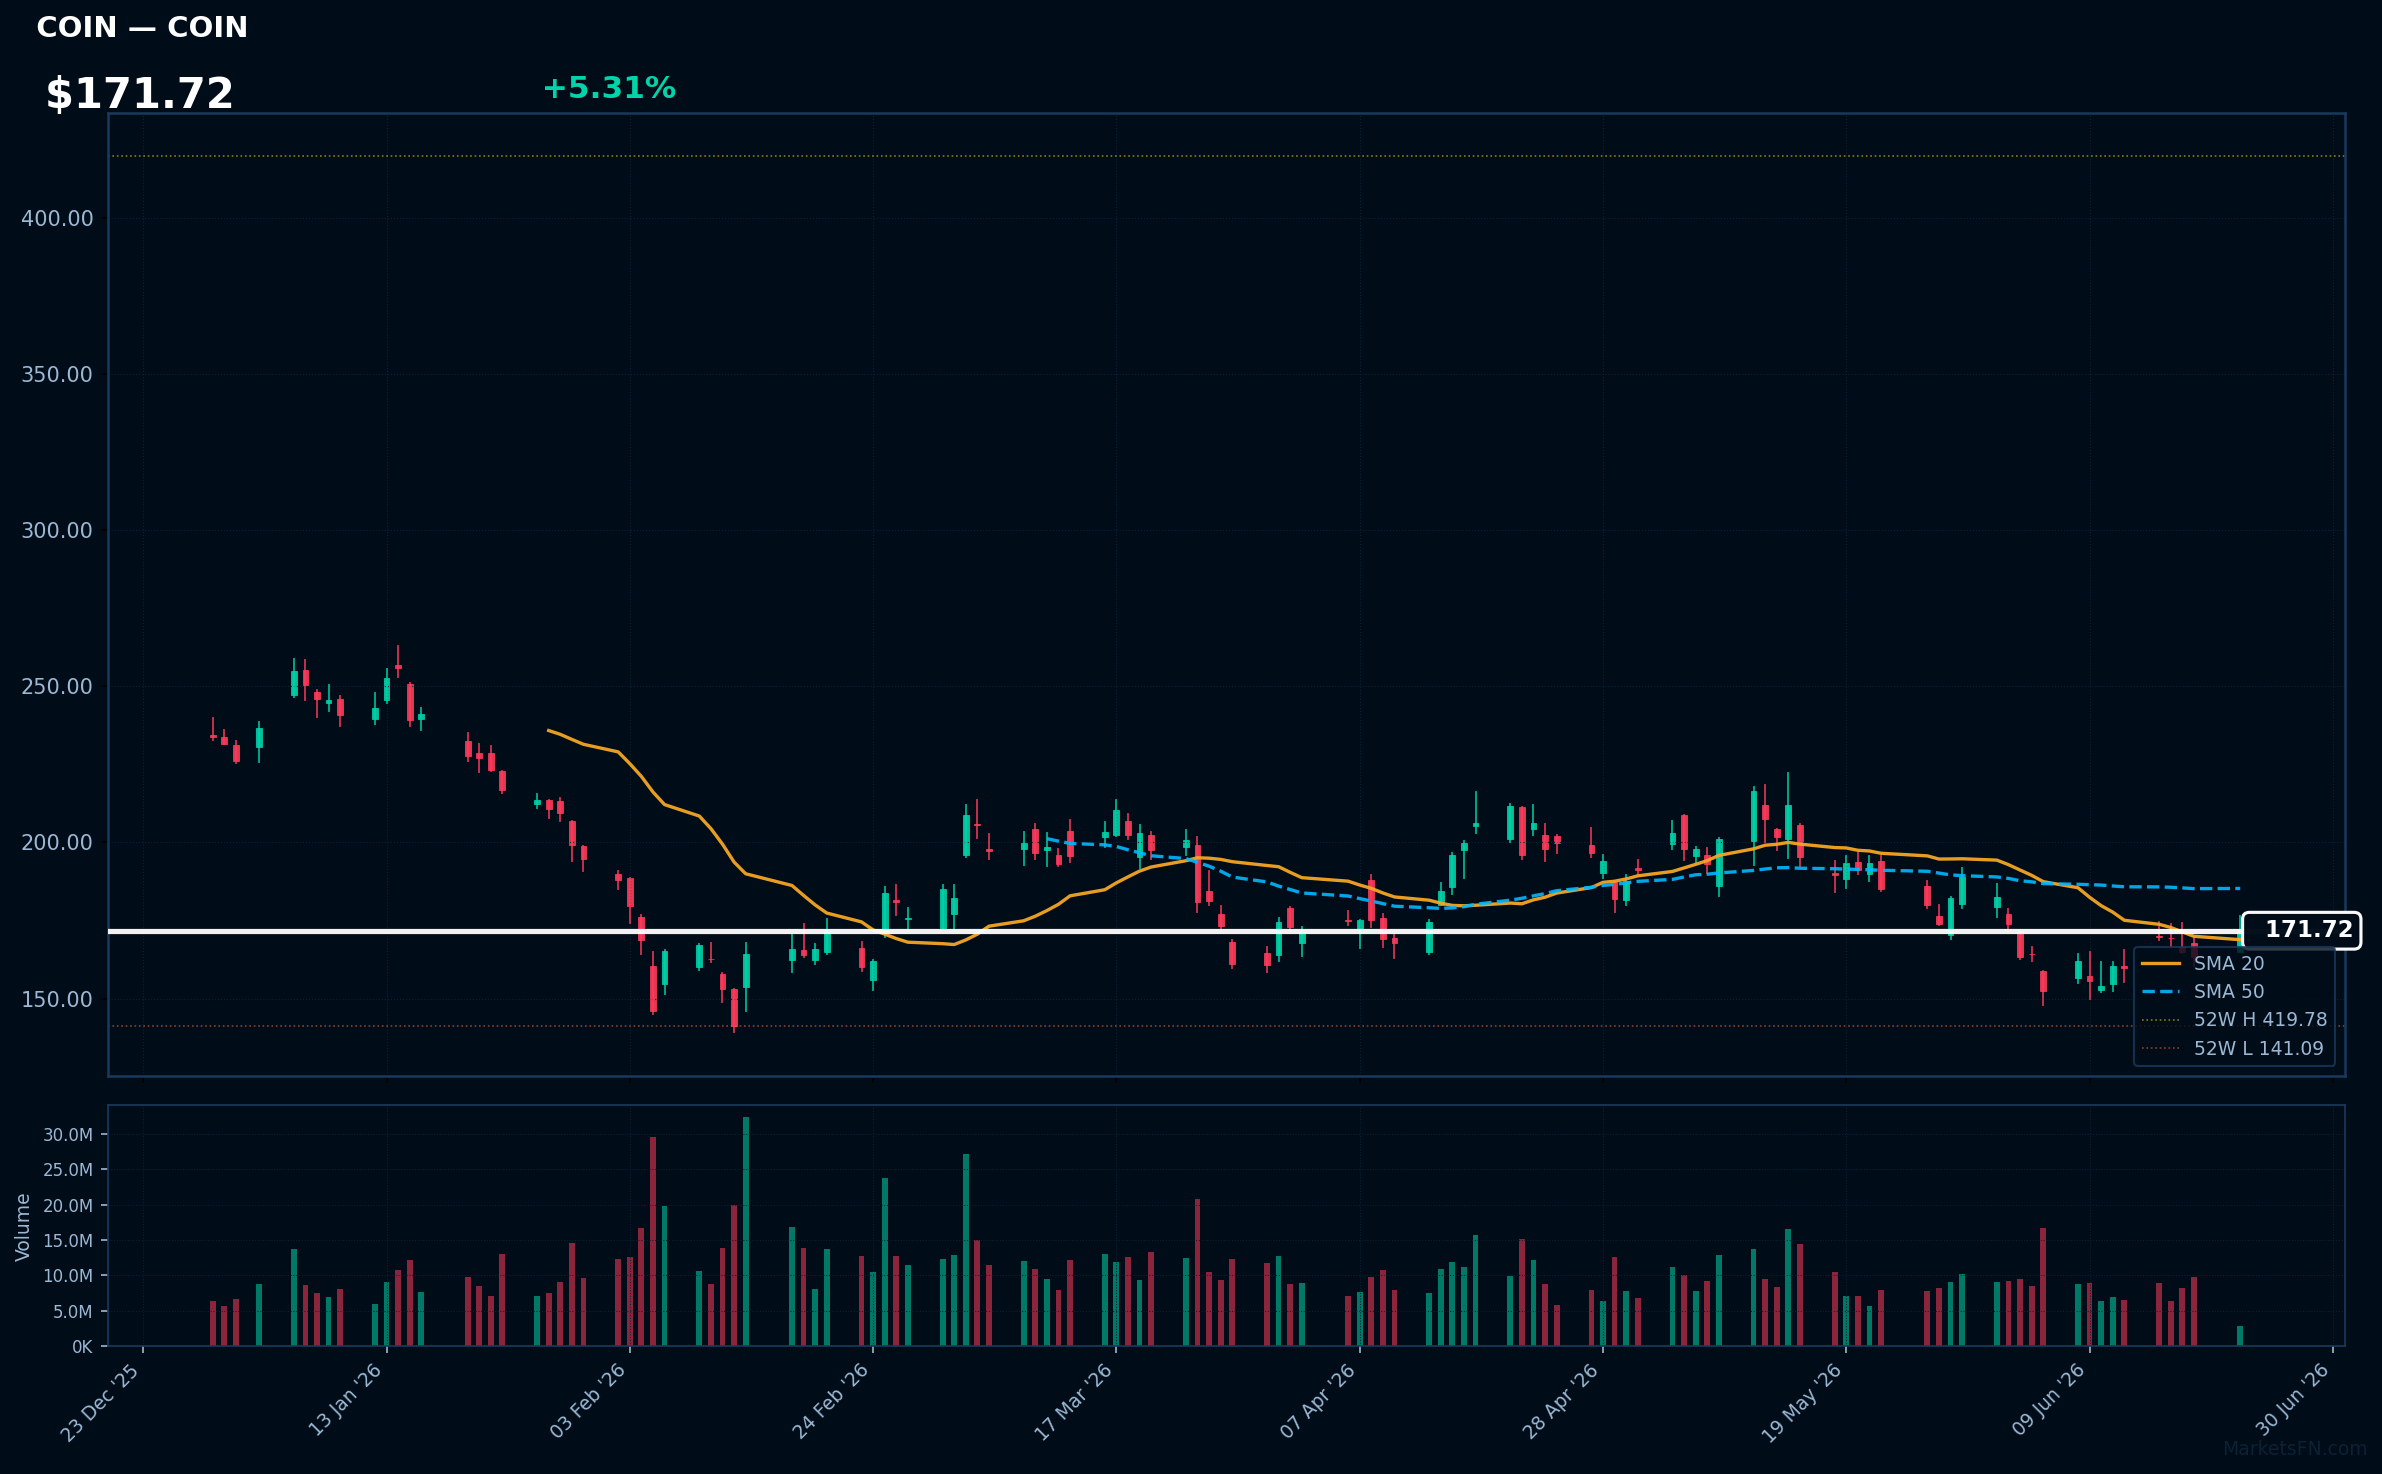
COIN | Coinbase Global Inc | Financial | Price: $171.93 | Day: +5.31% | 1W: +7.47% | 1M: -10.23% | RSI: 49.0 | vs MA200: -27.6% | Trend: Above MA20 · Below MA50, MA200
Recent headlines (last 12h)
- Bitmine Immersion Technologies (BMNR) Announces ETH Holdings Reach 5.67 Million Tokens, and Total Crypto and Total Cash Holdings of $10.7 Billion
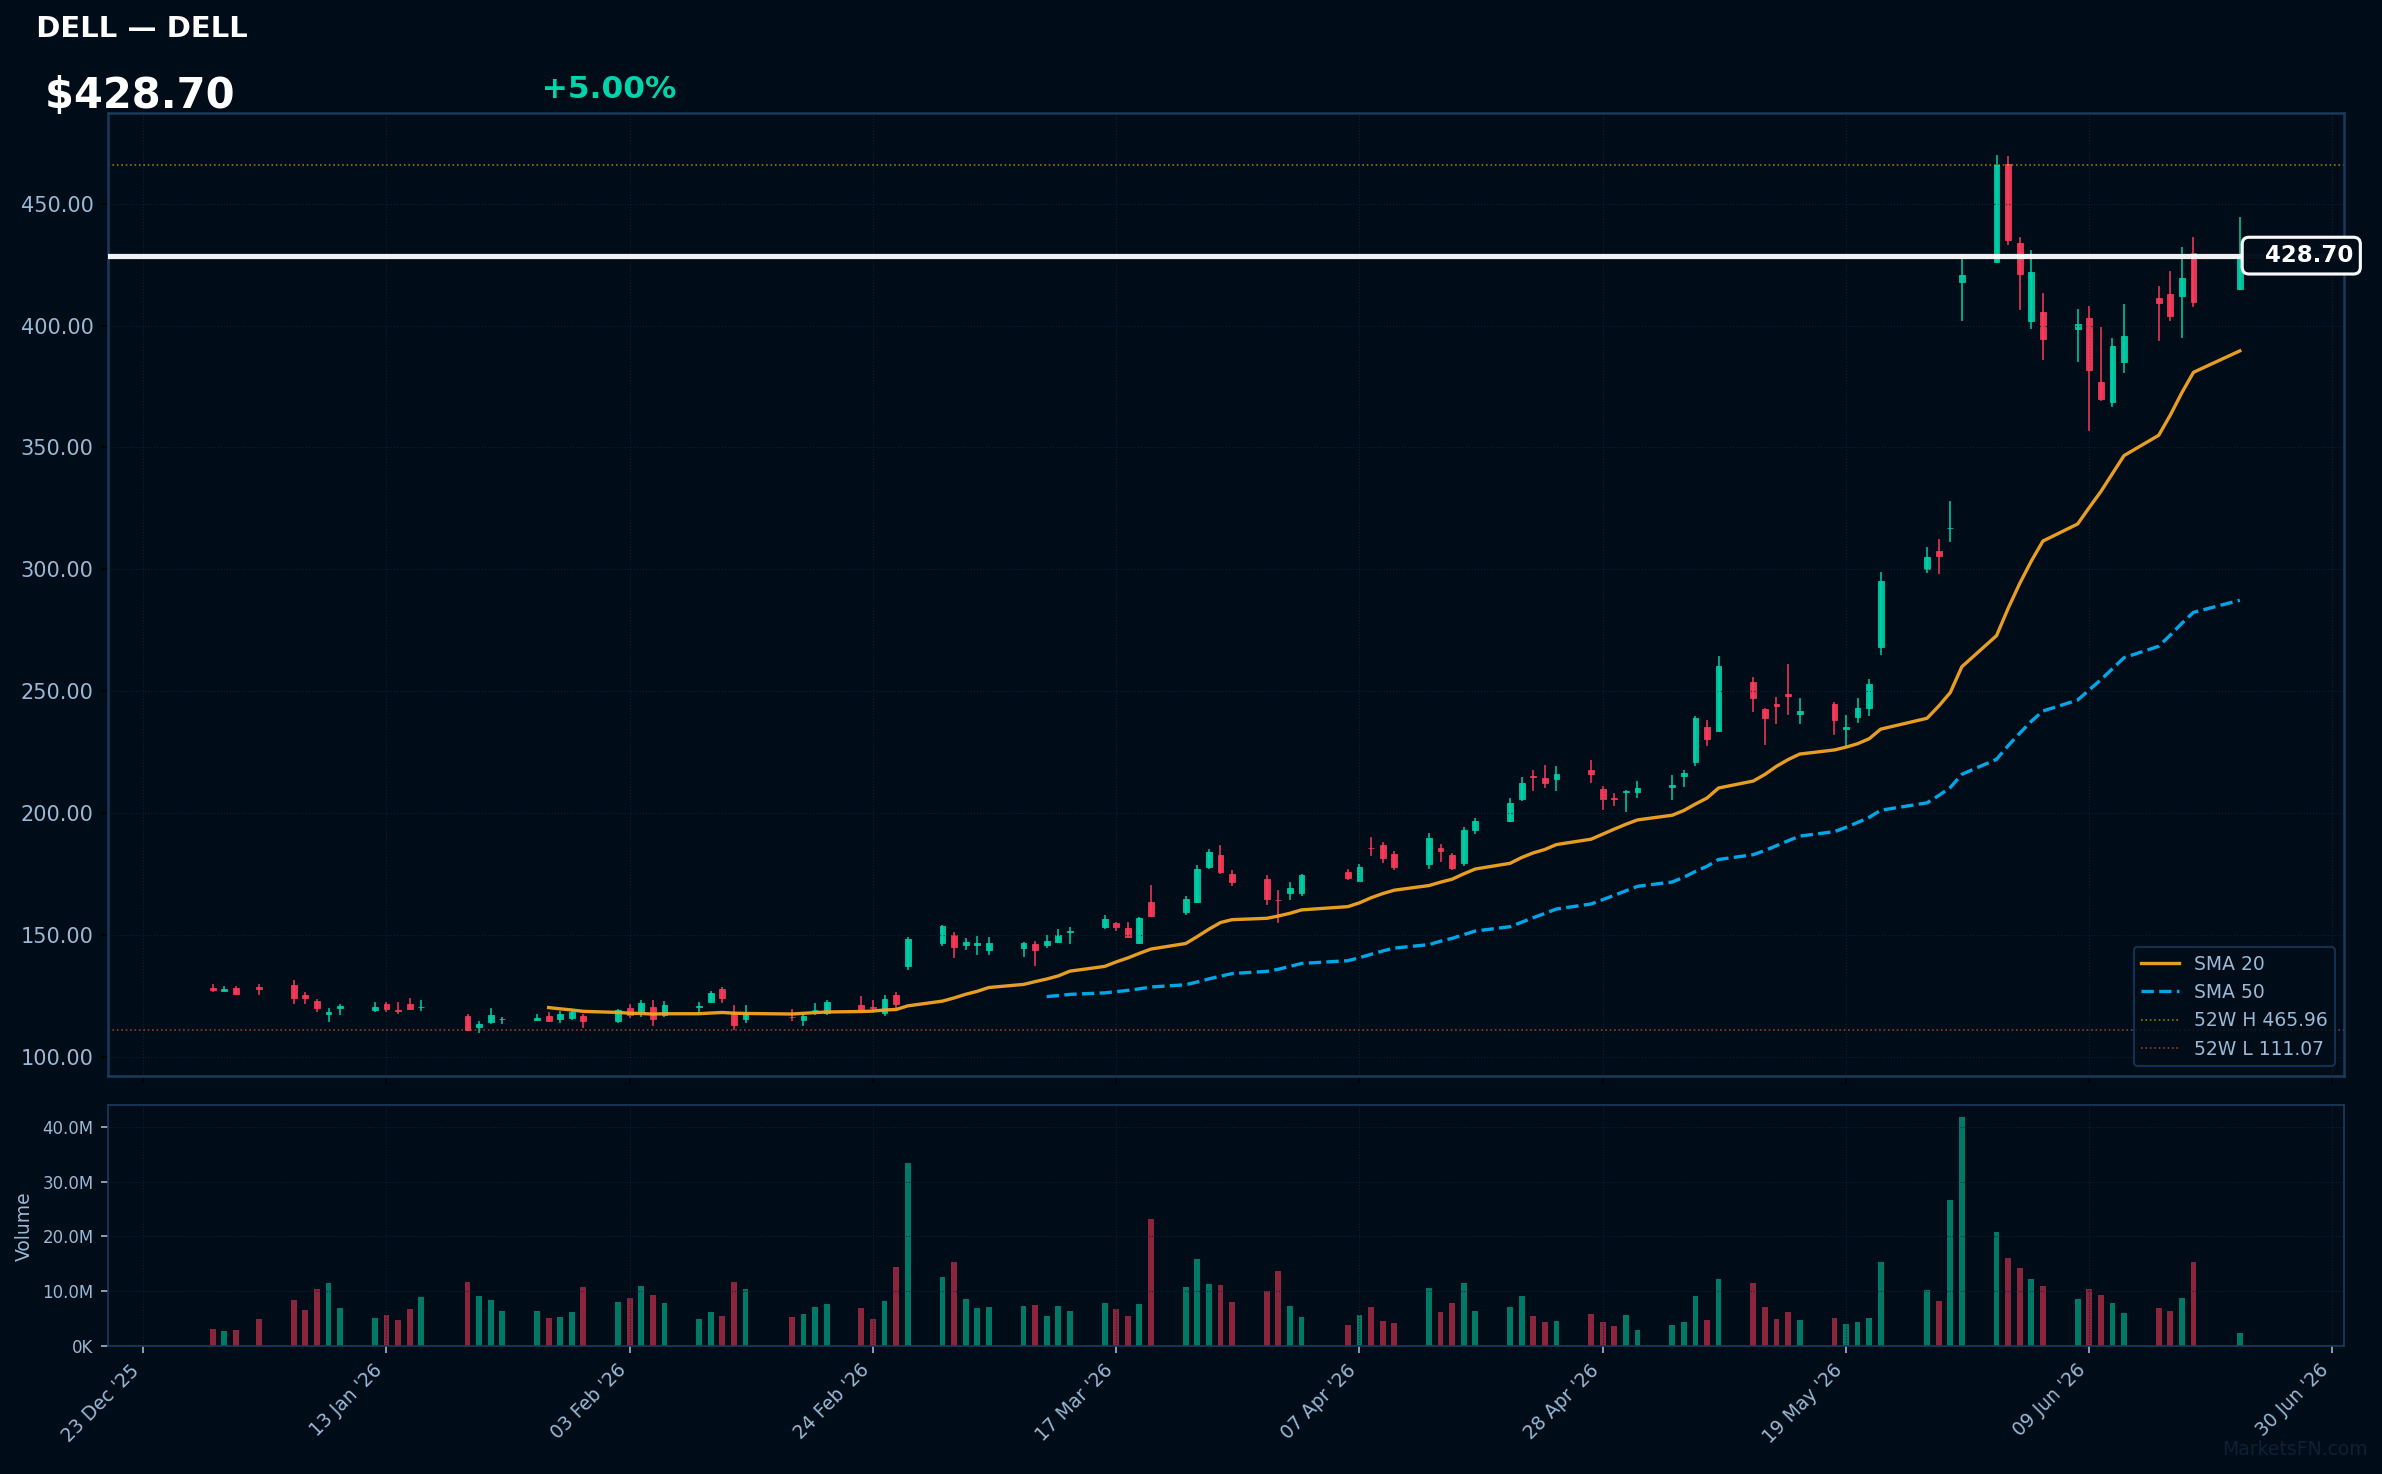
DELL | Dell Technologies Inc | Technology | Price: $429.99 | Day: +5.00% | 1W: +8.38% | 1M: +76.47% | RSI: 67.6 | vs MA200: +145.5% | Trend: Above MA20, MA50, MA200
Recent headlines (last 12h)
- The Dell AI Factory with NVIDIA Advances Supercomputing-Class Infrastructure Powering the Next Generation of HPC and AI
- Dow Jones opens higher but Nasdaq flat as hawkish Fed still looms
MU | Micron Technology Inc | Technology | Price: $1189.19 | Day: +4.87% | 1W: +21.06% | 1M: +62.34% | RSI: 68.8 | vs MA200: +192.8% | Trend: Above MA20, MA50, MA200
Recent headlines (last 12h)
- MU, SNDK, Memory Stocks Buck Market Selloff After Fresh Trump Threats To Iran: Retail Traders Say 'Never Sell, Buy Dips
- SK Hynix dethrones Samsung Electronics as South Korea's most valuable company
- Micron surges 5.5% on blockbuster Anthropic AI deal ahead of earnings
- Micron Q3 Earnings Preview: What to Expect From Upcoming Report
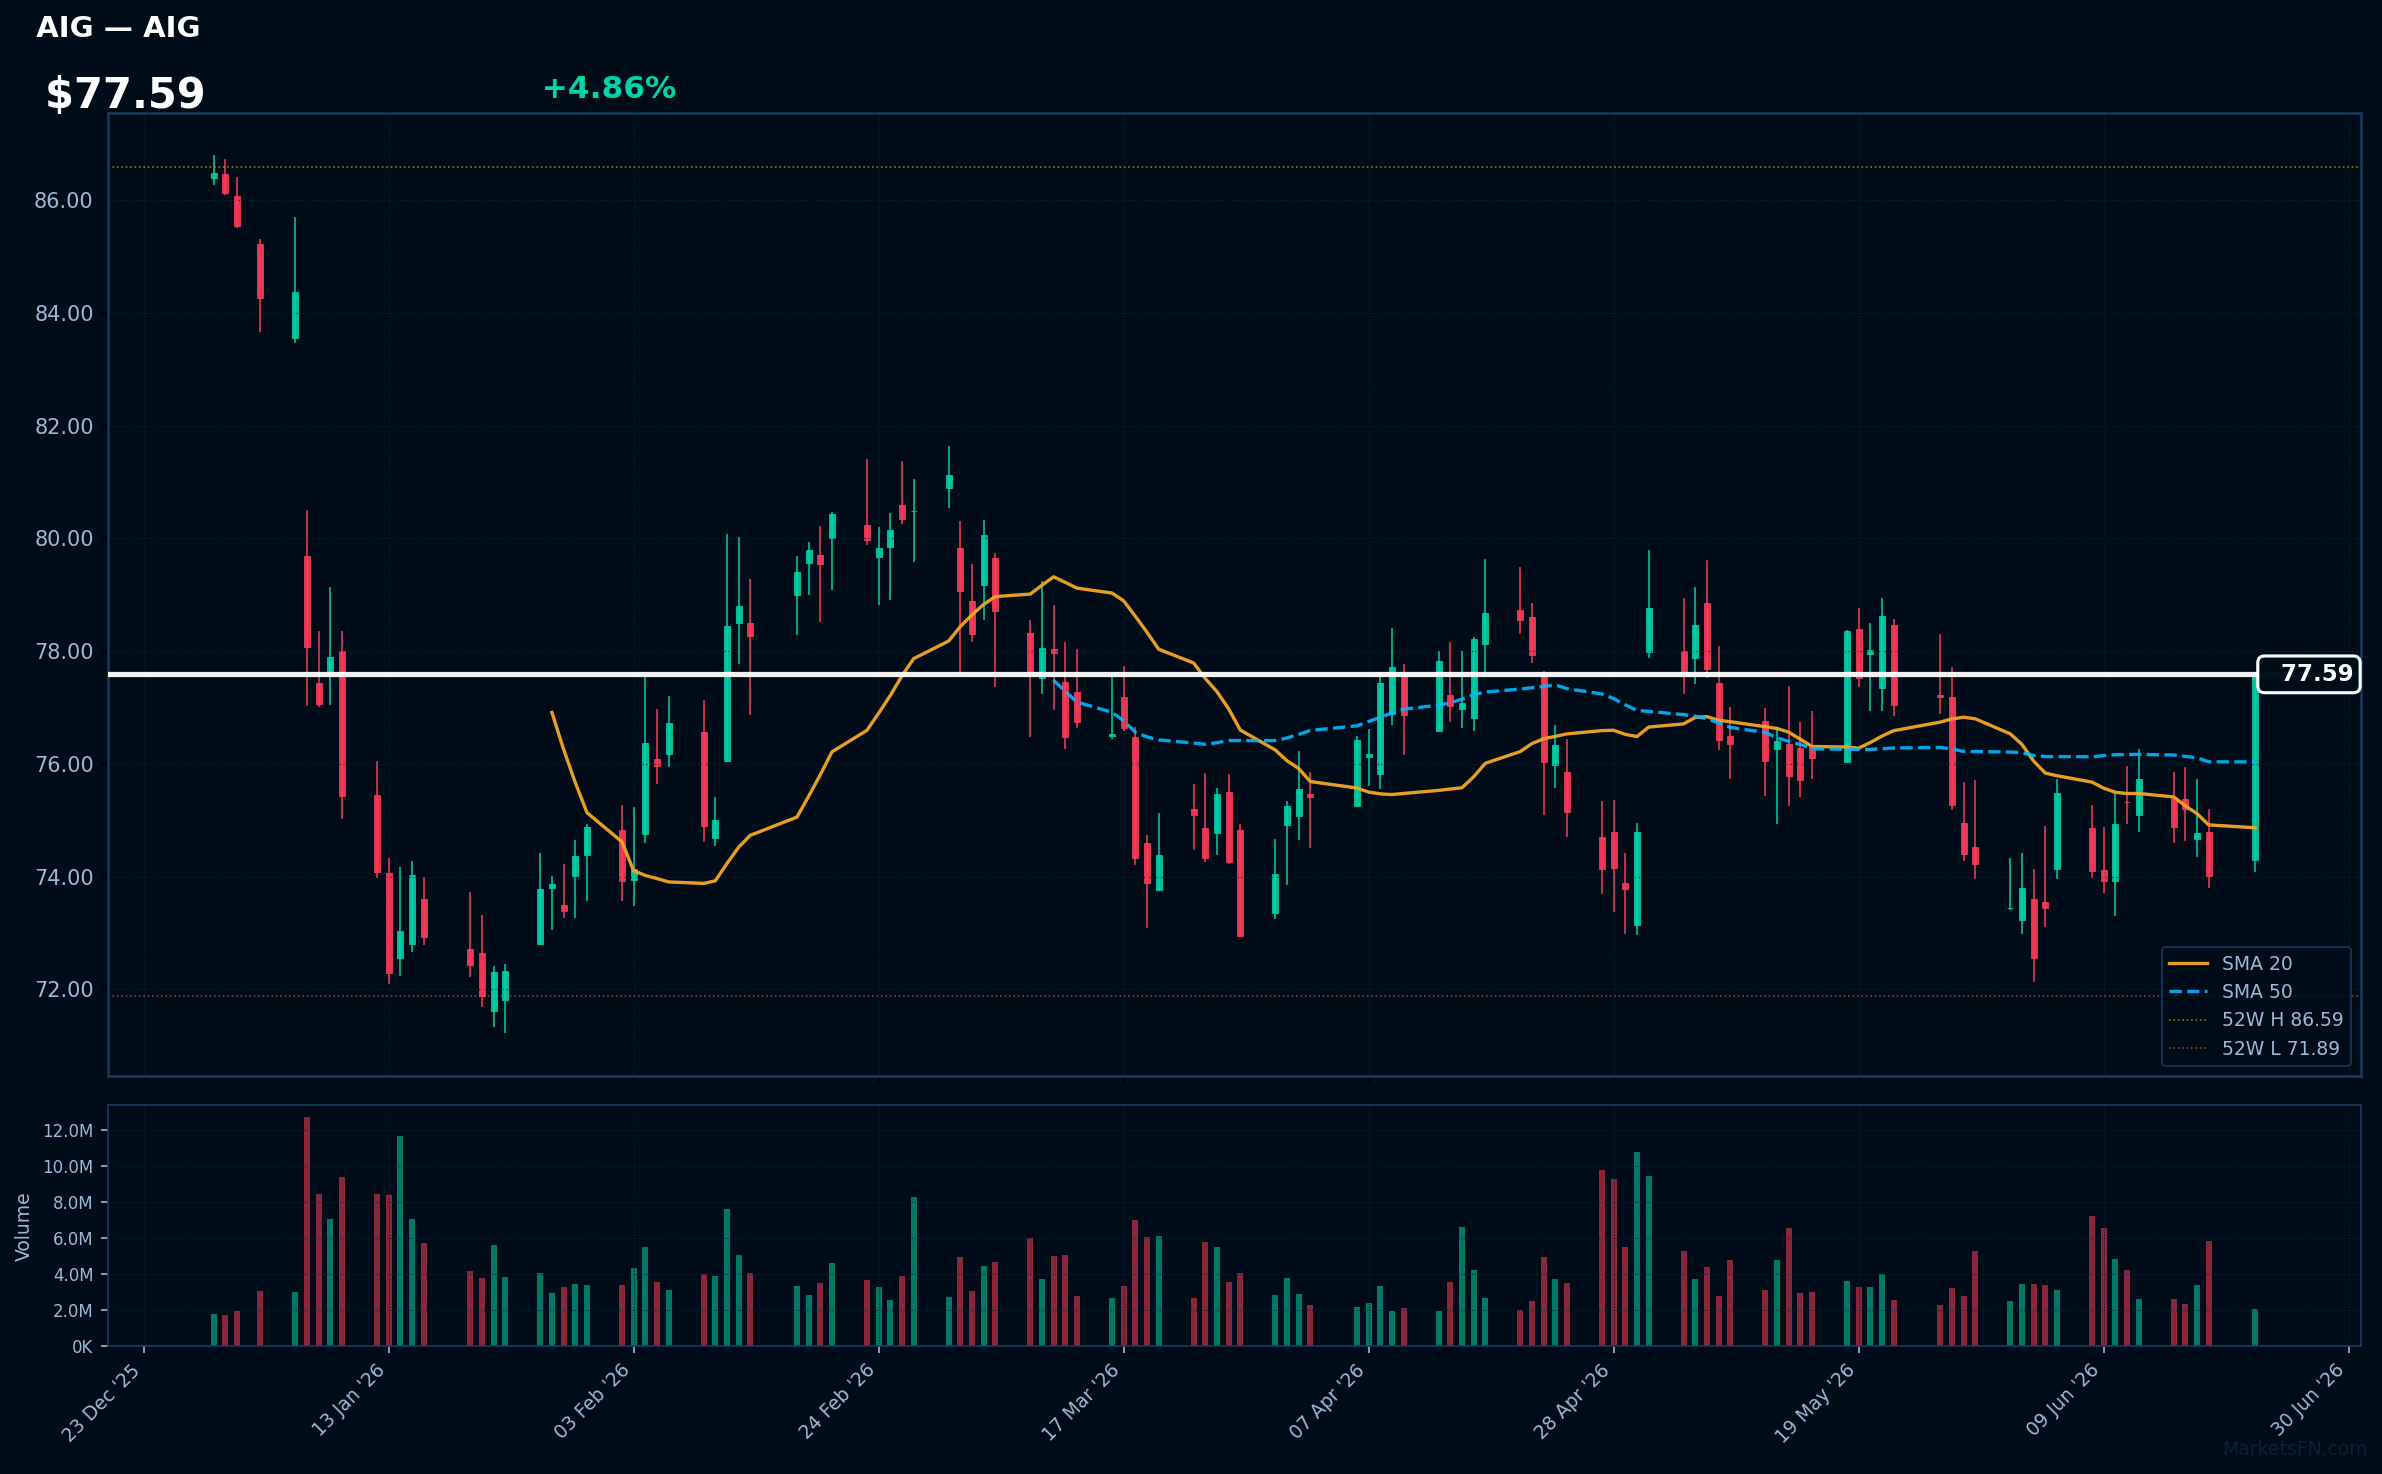
AIG | American International Group Inc | Financial | Price: $77.61 | Day: +4.86% | 1W: +2.44% | 1M: -0.56% | RSI: 58.7 | vs MA200: -0.1% | Trend: Above MA20, MA50 · Below MA200
STX | Seagate Technology Holdings Plc | Technology | Price: $1121.98 | Day: +4.84% | 1W: +19.96% | 1M: +48.71% | RSI: 76.8 | vs MA200: +163.0% | Trend: Above MA20, MA50, MA200
Recent headlines (last 12h)
- MU, SNDK, Memory Stocks Buck Market Selloff After Fresh Trump Threats To Iran: Retail Traders Say 'Never Sell, Buy Dips
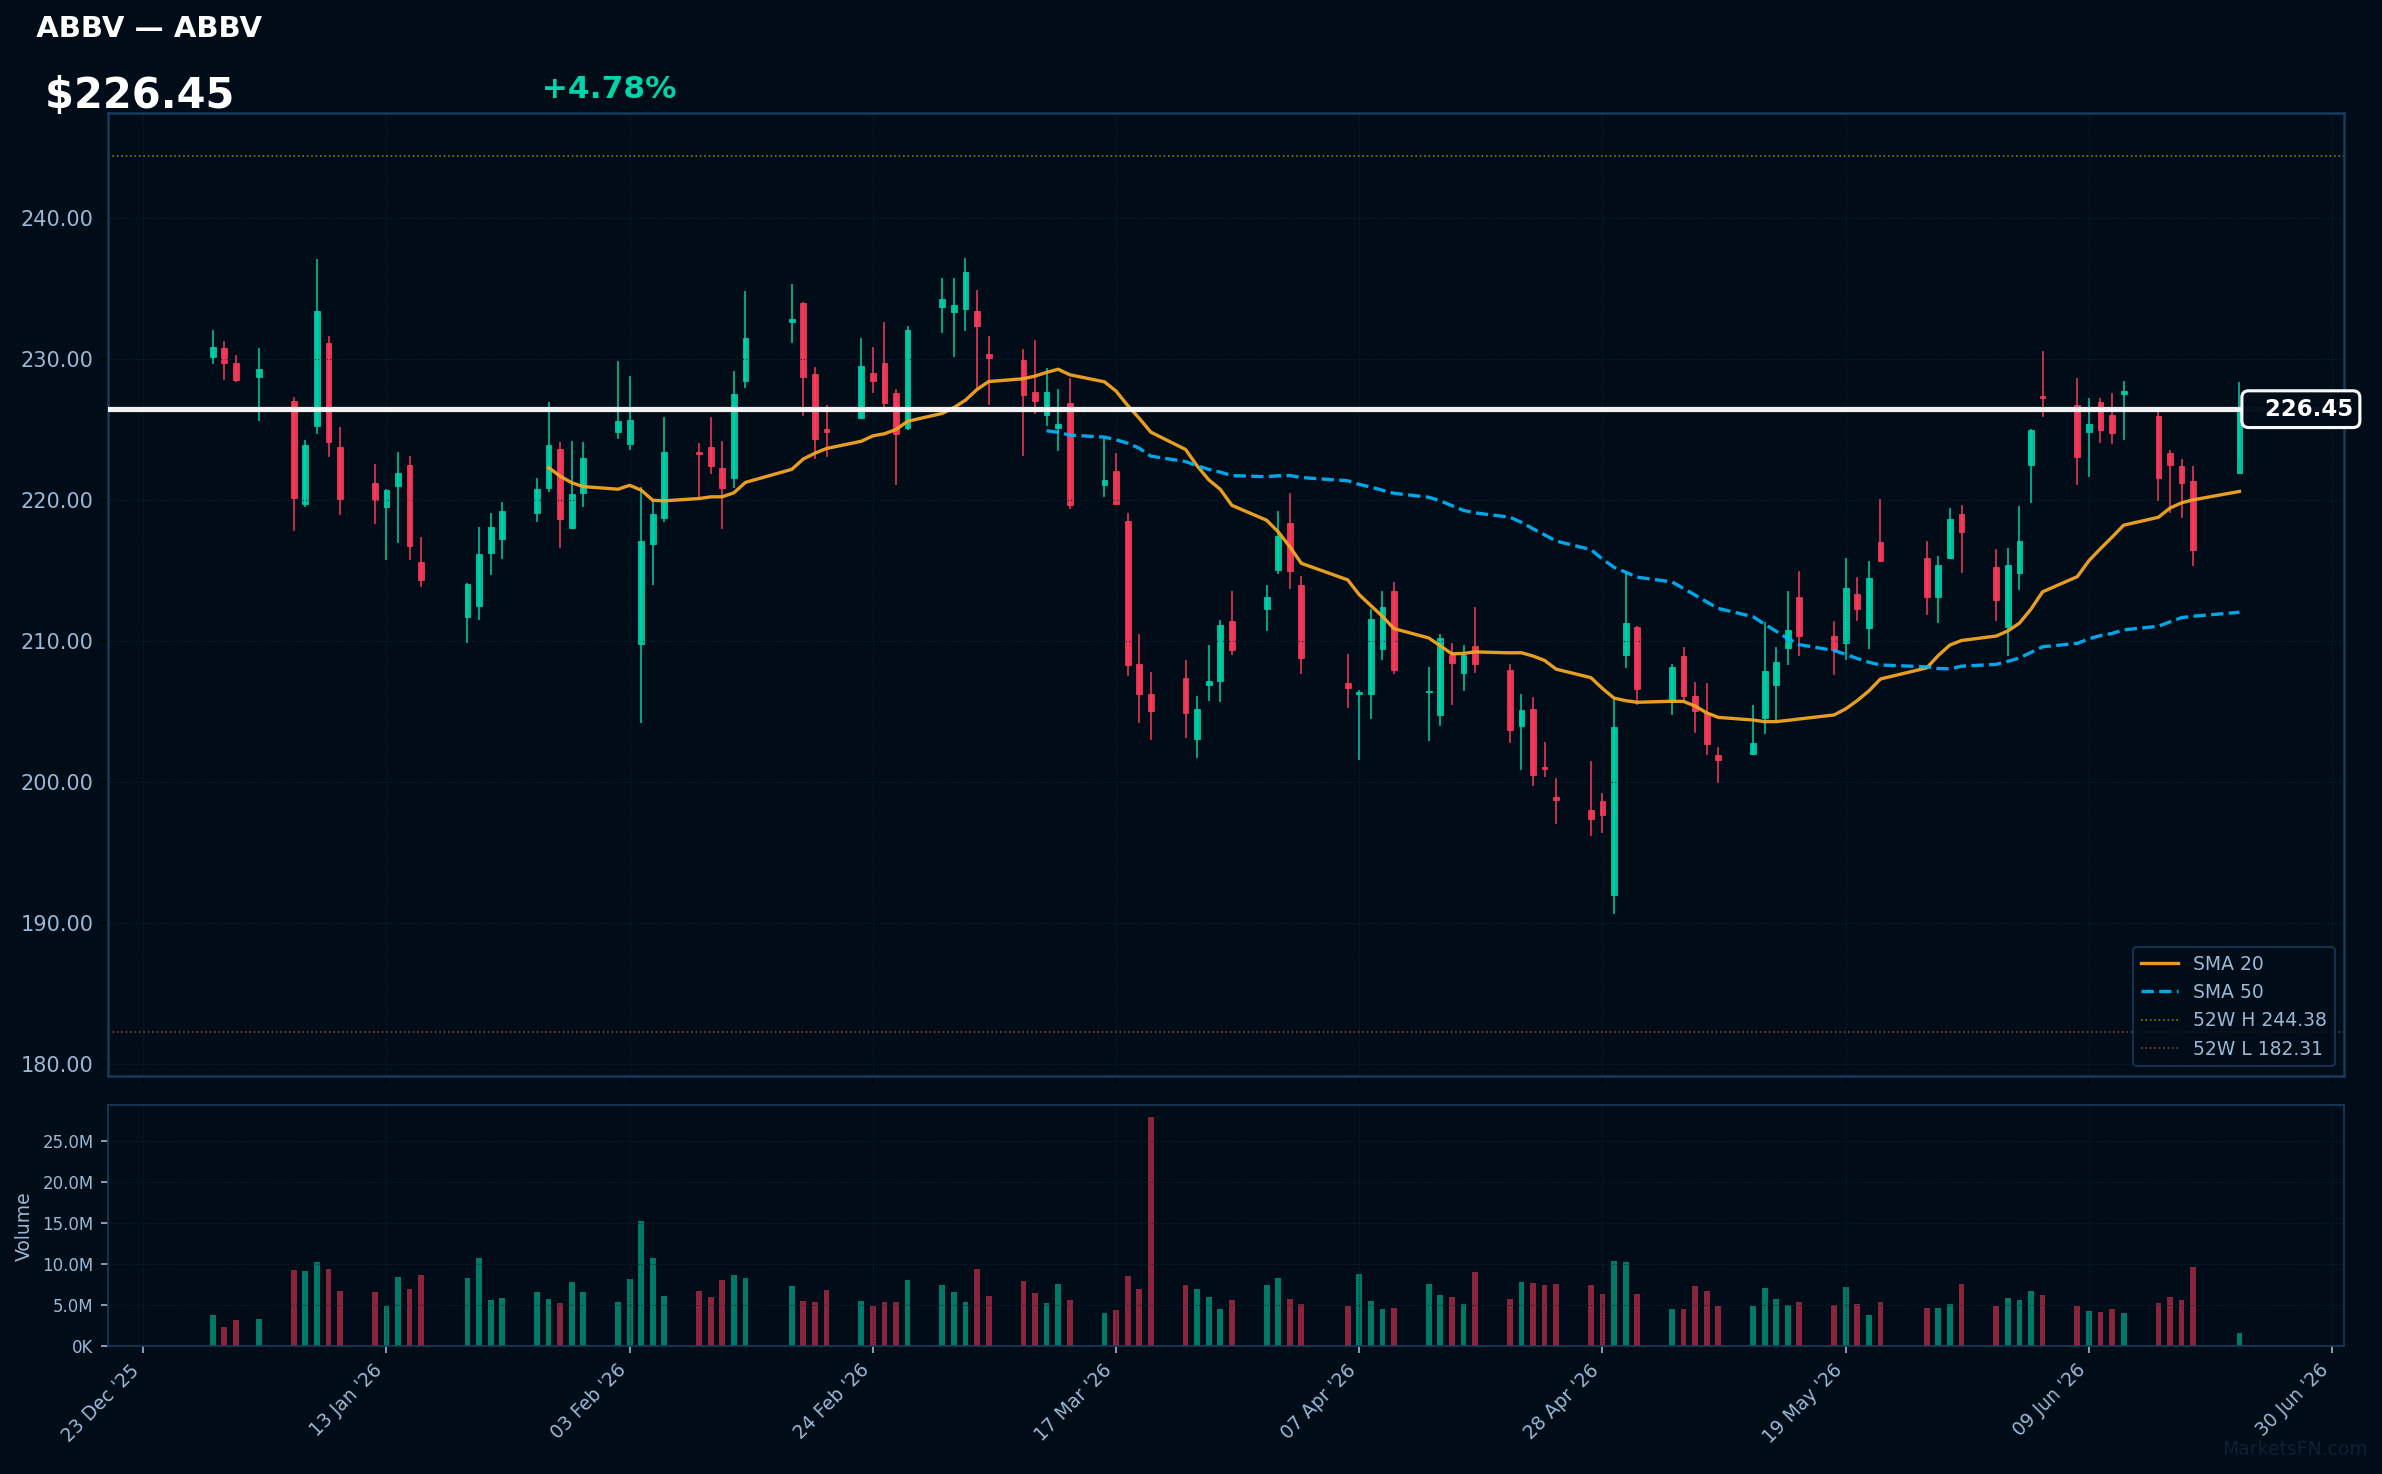
ABBV | Abbvie Inc | Healthcare | Price: $226.84 | Day: +4.78% | 1W: -0.56% | 1M: +6.67% | RSI: 59.3 | vs MA200: +2.8% | Trend: Above MA20, MA50, MA200
Recent headlines (last 12h)
- AbbVie Goes On The Offensive With $10.9 Billion Takeover
- Apogee Therapeutics, BitFuFu rise premarket; AbbVie gains after deal
- Why AbbVie Is Spending $11 Billion to Buy Apogee Therapeutics
- AbbVie Strikes $10.9 Billion Deal for Apogee to Strengthen Future Immunology Portfolio (ABBV)
Top 10 Losers
Today's weakest S&P 500 performers. Sector drag: Communication Services (3), Consumer Cyclical (3), Industrials (1), Technology (1), Basic Materials (1), Healthcare (1).
| Ticker | Company | Sector | Price | Day % | 1W % | 1M % | RSI | vs MA200 | Trend |
|---|---|---|---|---|---|---|---|---|---|
| FOXA | Fox Corporation | Communication Services | $50.62 | -3.08% | -23.18% | -21.12% | 25.3 | -20.6% | Below MA20, MA50, MA200 |
| LULU | Lululemon Athletica inc | Consumer Cyclical | $108.12 | -3.27% | -8.92% | -13.59% | 29.1 | -35.2% | Below MA20, MA50, MA200 |
| AZO | Autozone Inc | Consumer Cyclical | $2959.09 | -3.44% | -4.87% | -13.30% | 33.7 | -18.7% | Below MA20, MA50, MA200 |
| LHX | L3Harris Technologies Inc | Industrials | $284.57 | -3.48% | -7.49% | -7.90% | 34.4 | -9.9% | Below MA20, MA50, MA200 |
| LDOS | Leidos Holdings Inc | Technology | $103.16 | -3.70% | -15.58% | -17.10% | 15.4 | -39.6% | Below MA20, MA50, MA200 |
| DPZ | Dominos Pizza Inc | Consumer Cyclical | $298.45 | -4.49% | -7.83% | -5.53% | 35.6 | -23.3% | Below MA20, MA50, MA200 |
| ALB | Albemarle Corp | Basic Materials | $152.91 | -4.64% | -10.27% | -10.16% | 37.9 | +4.4% | Above MA200 · Below MA20, MA50 |
| GOOGL | Alphabet Inc | Communication Services | $350.25 | -4.83% | -2.43% | -9.76% | 39.5 | +12.4% | Above MA200 · Below MA20, MA50 |
| GOOG | Alphabet Inc | Communication Services | $349.35 | -4.93% | -2.26% | -9.05% | 40.6 | +12.3% | Above MA200 · Below MA20, MA50 |
| MRNA | Moderna Inc | Healthcare | $59.14 | -7.54% | +18.49% | +22.90% | 63.1 | +50.1% | Above MA20, MA50, MA200 |
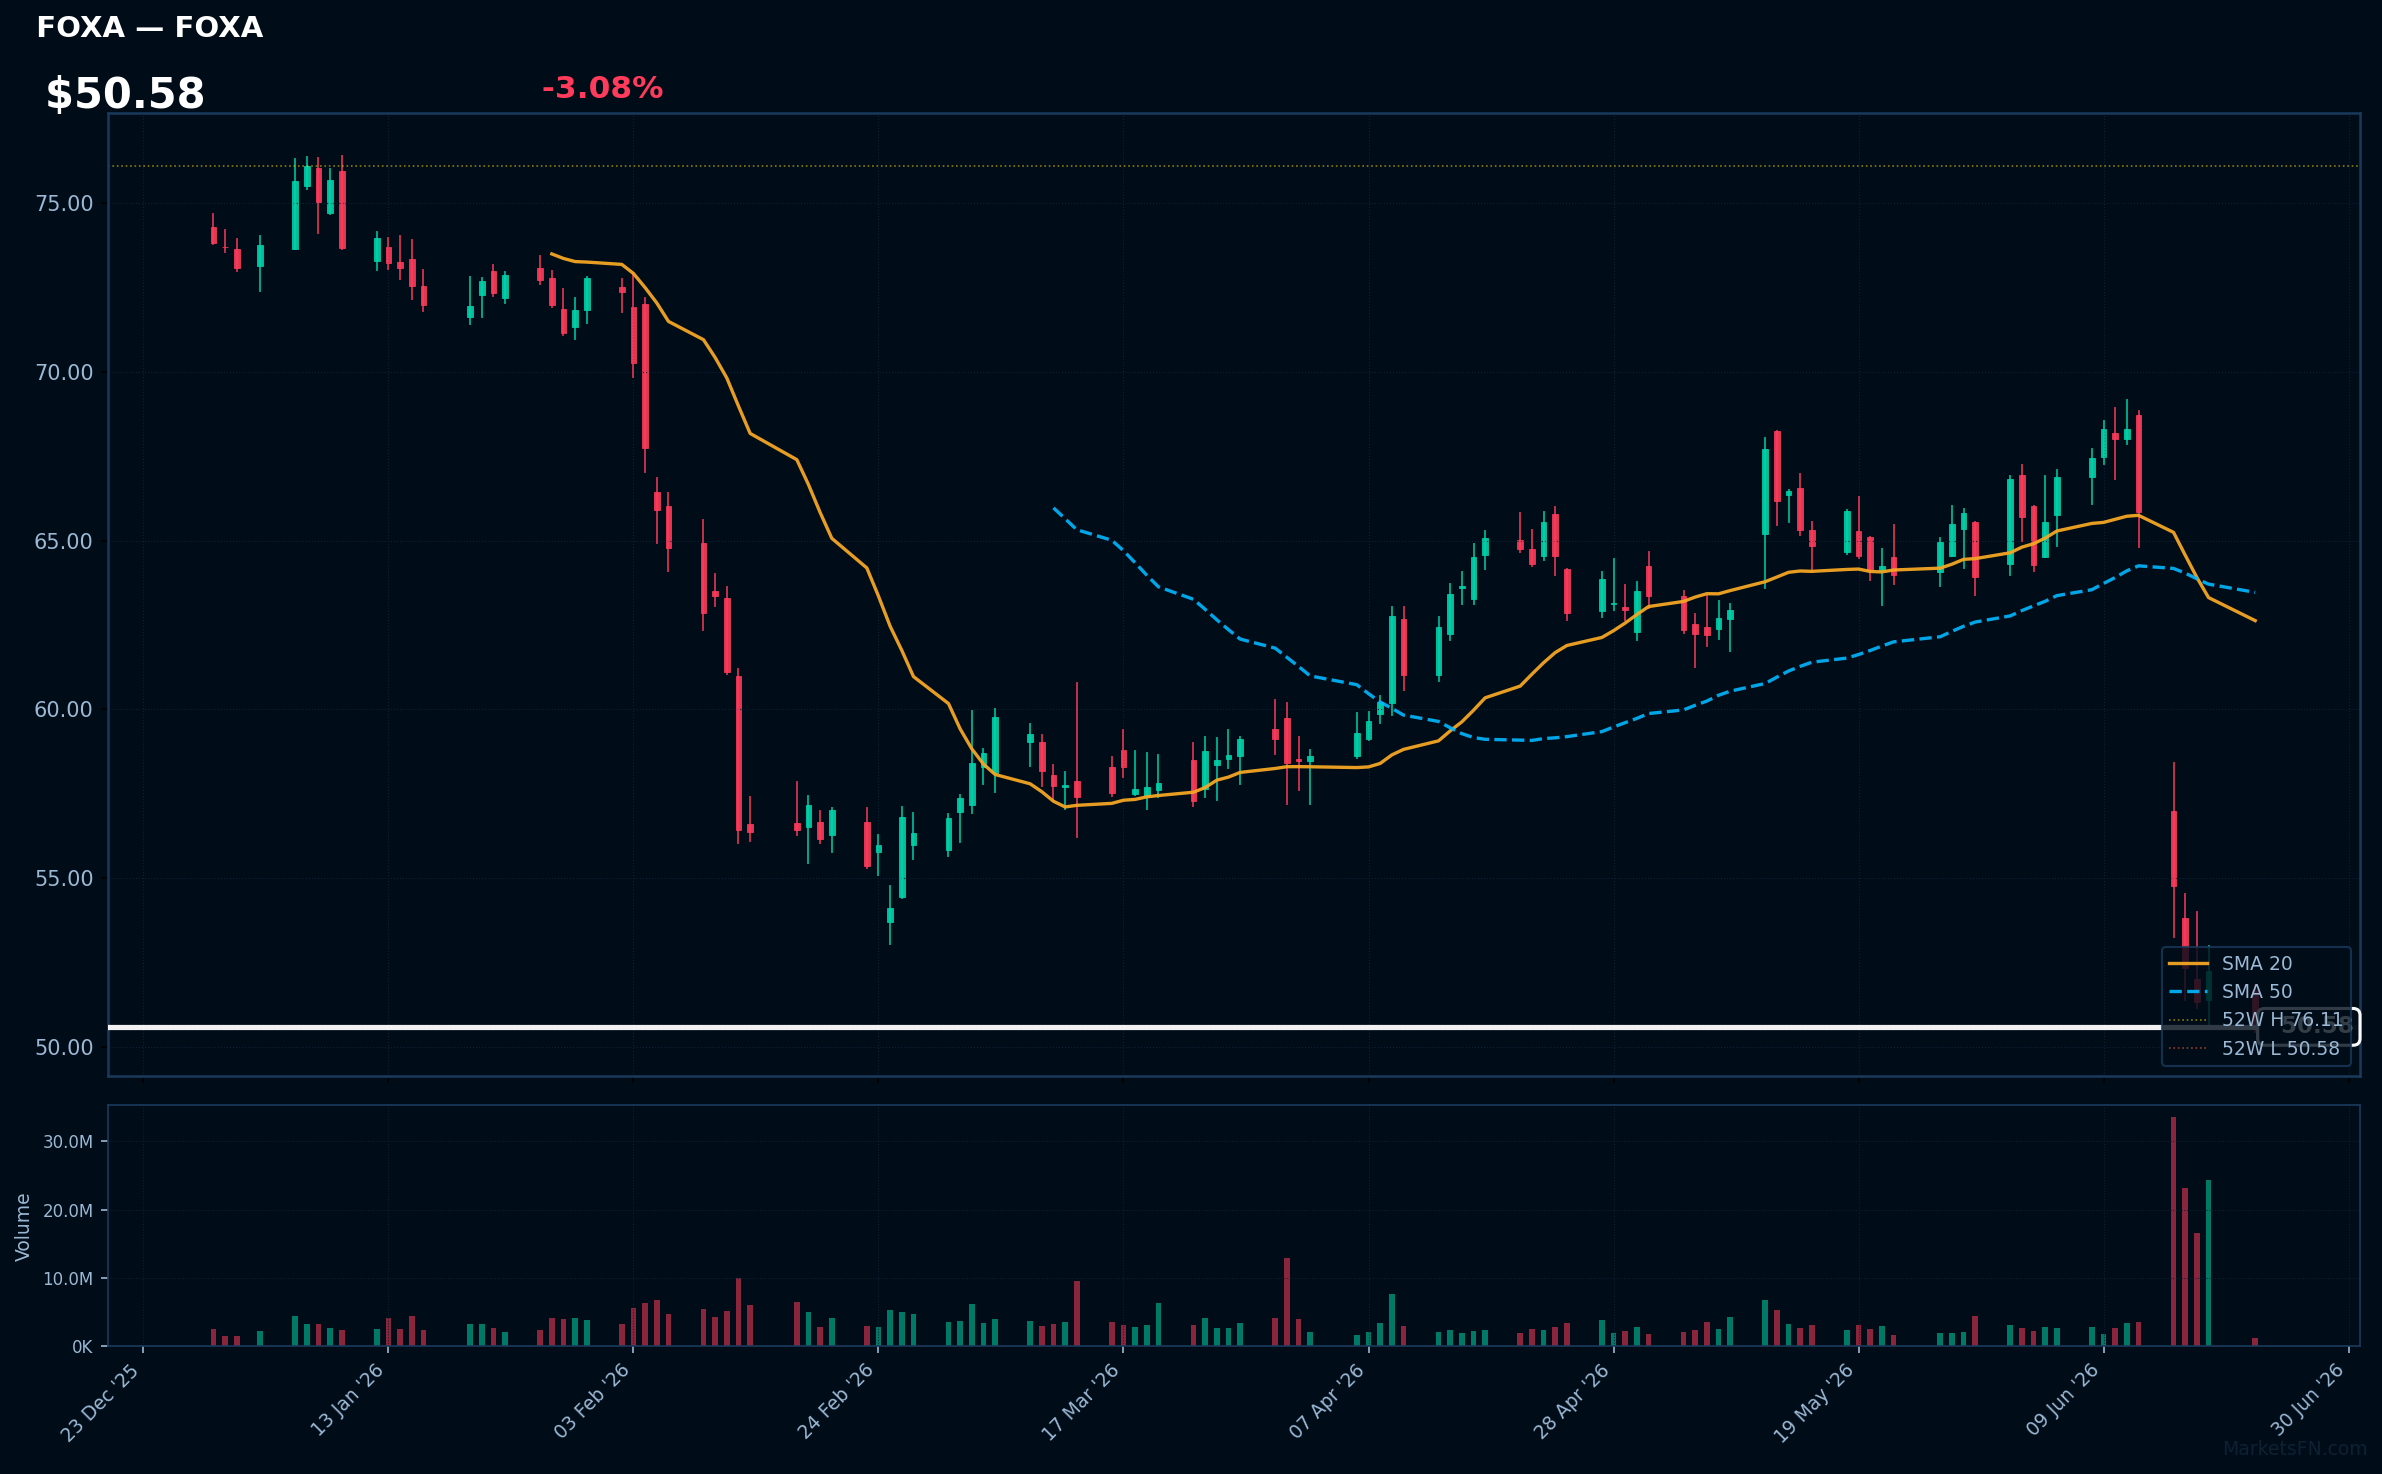
FOXA | Fox Corporation | Communication Services | Price: $50.62 | Day: -3.08% | 1W: -23.18% | 1M: -21.12% | RSI: 25.3 | vs MA200: -20.6% | Trend: Below MA20, MA50, MA200
Recent headlines (last 12h)
- Why Did CRM, INTU, FOXA Stocks Hit 52-Week Lows Last Week?
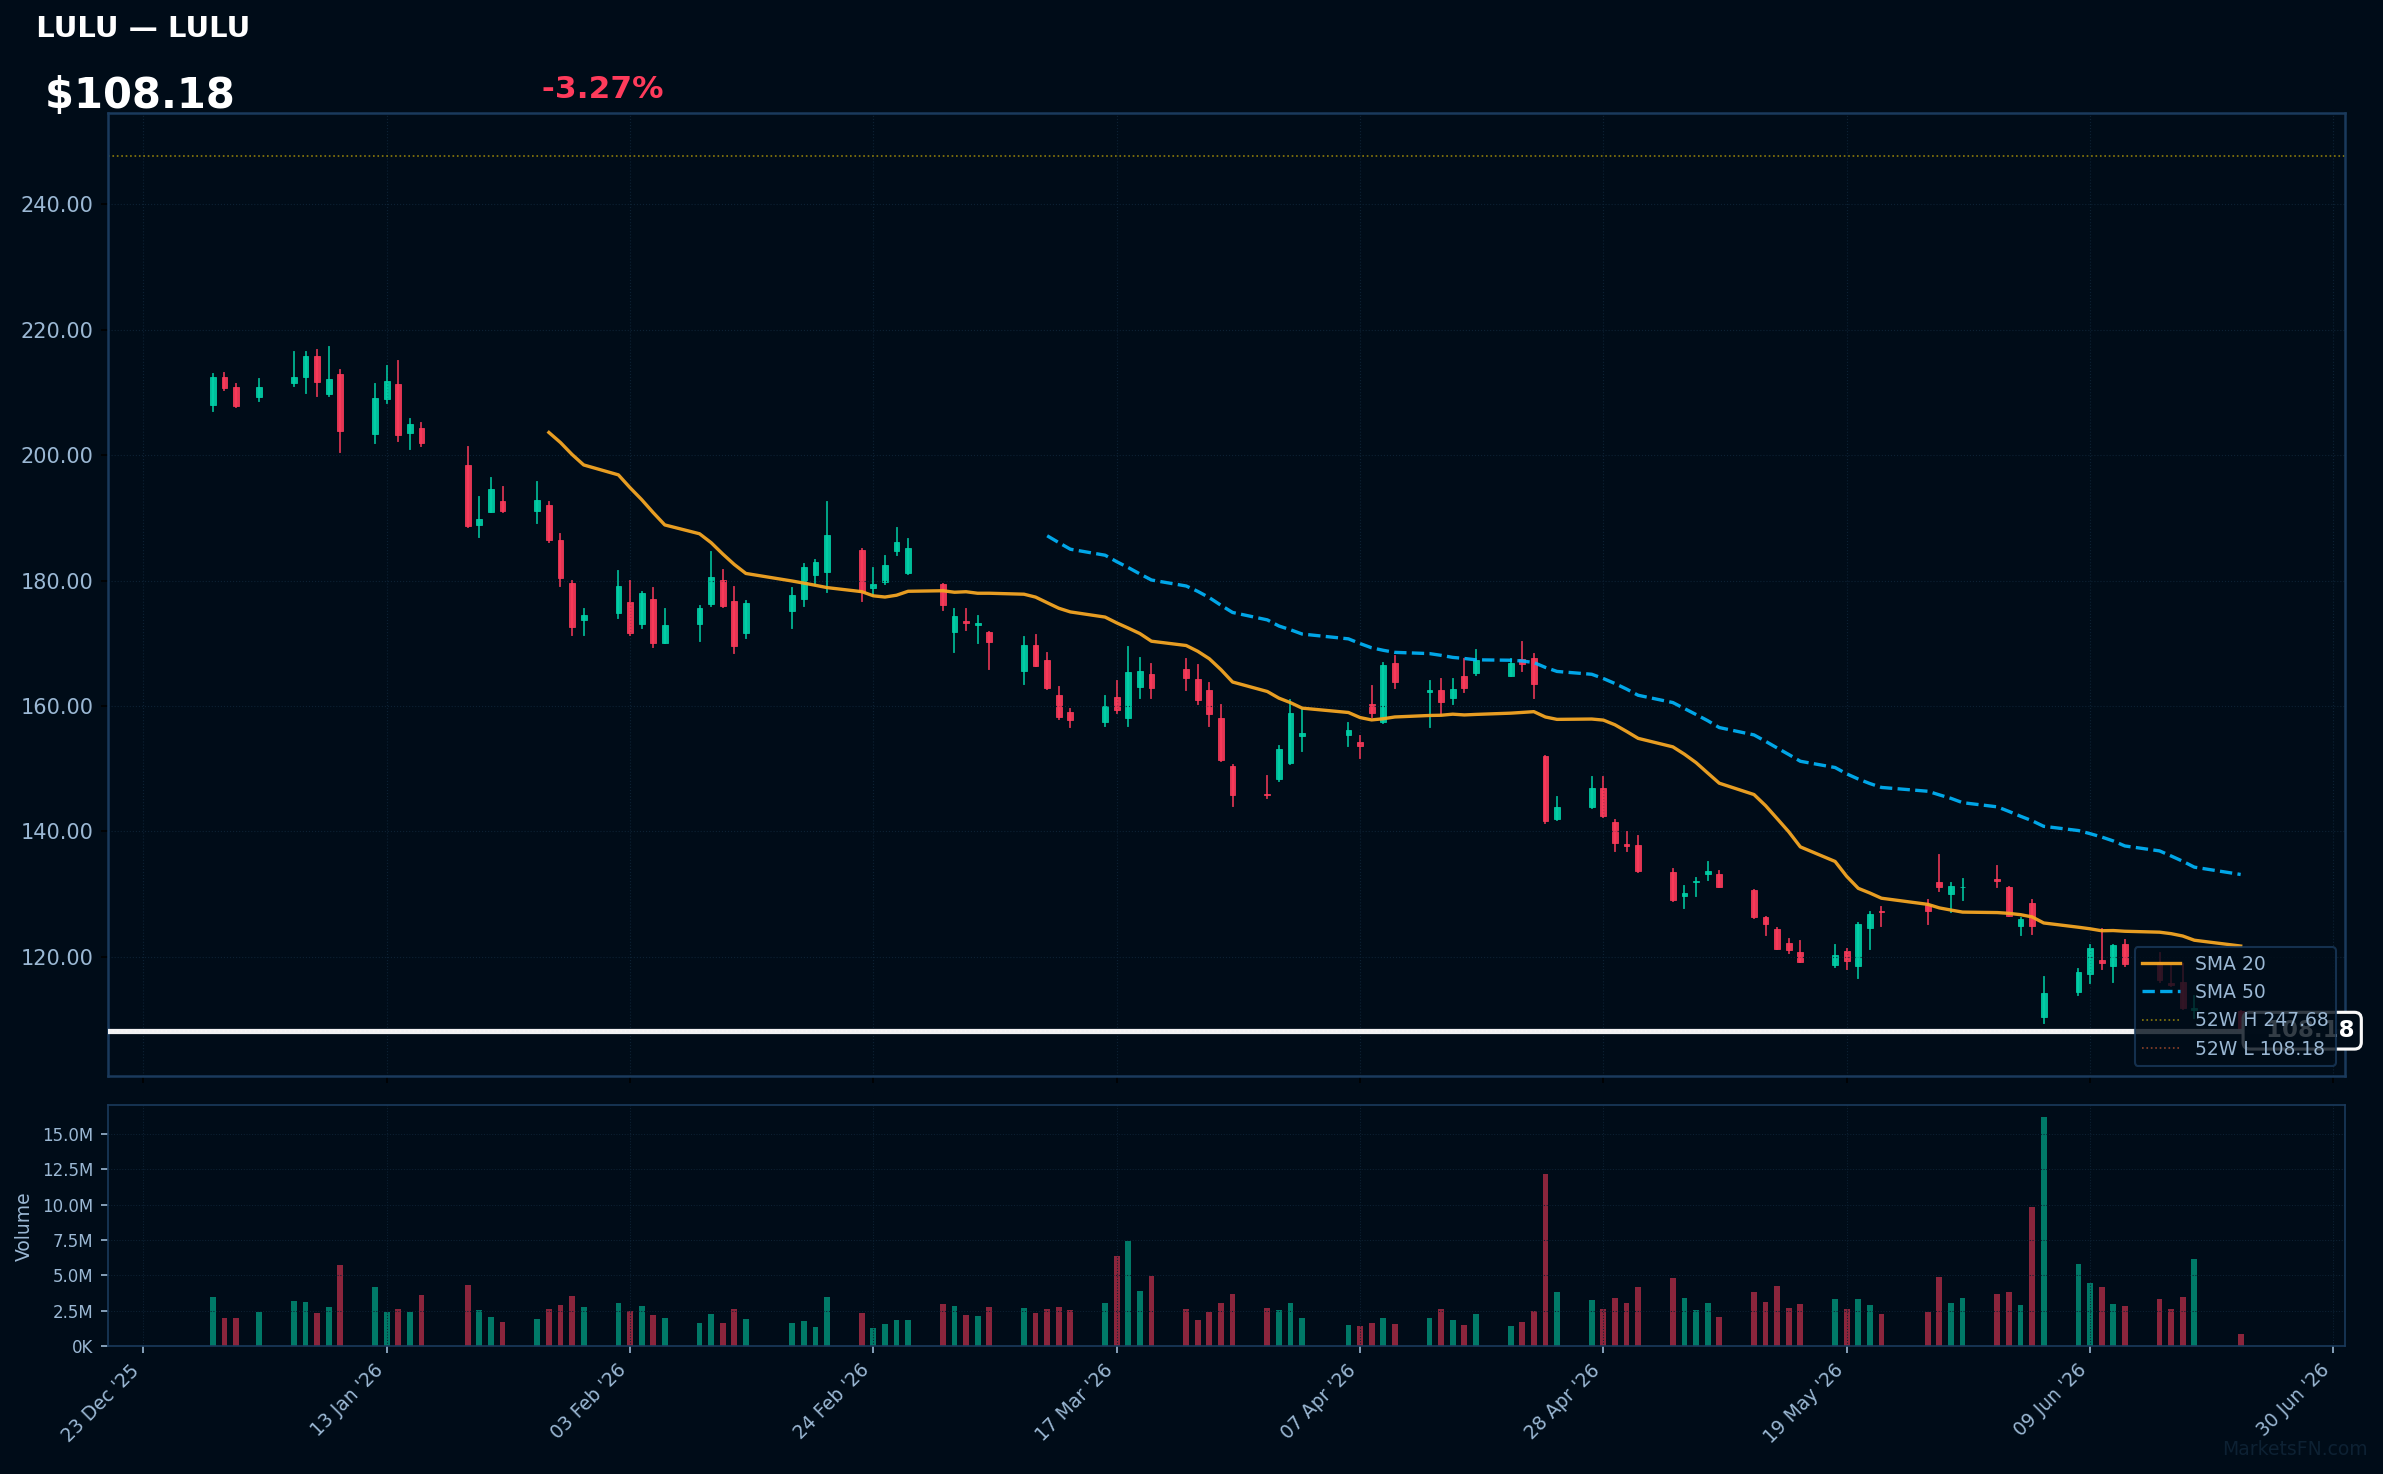
LULU | Lululemon Athletica inc | Consumer Cyclical | Price: $108.12 | Day: -3.27% | 1W: -8.92% | 1M: -13.59% | RSI: 29.1 | vs MA200: -35.2% | Trend: Below MA20, MA50, MA200
AZO | Autozone Inc | Consumer Cyclical | Price: $2959.09 | Day: -3.44% | 1W: -4.87% | 1M: -13.30% | RSI: 33.7 | vs MA200: -18.7% | Trend: Below MA20, MA50, MA200
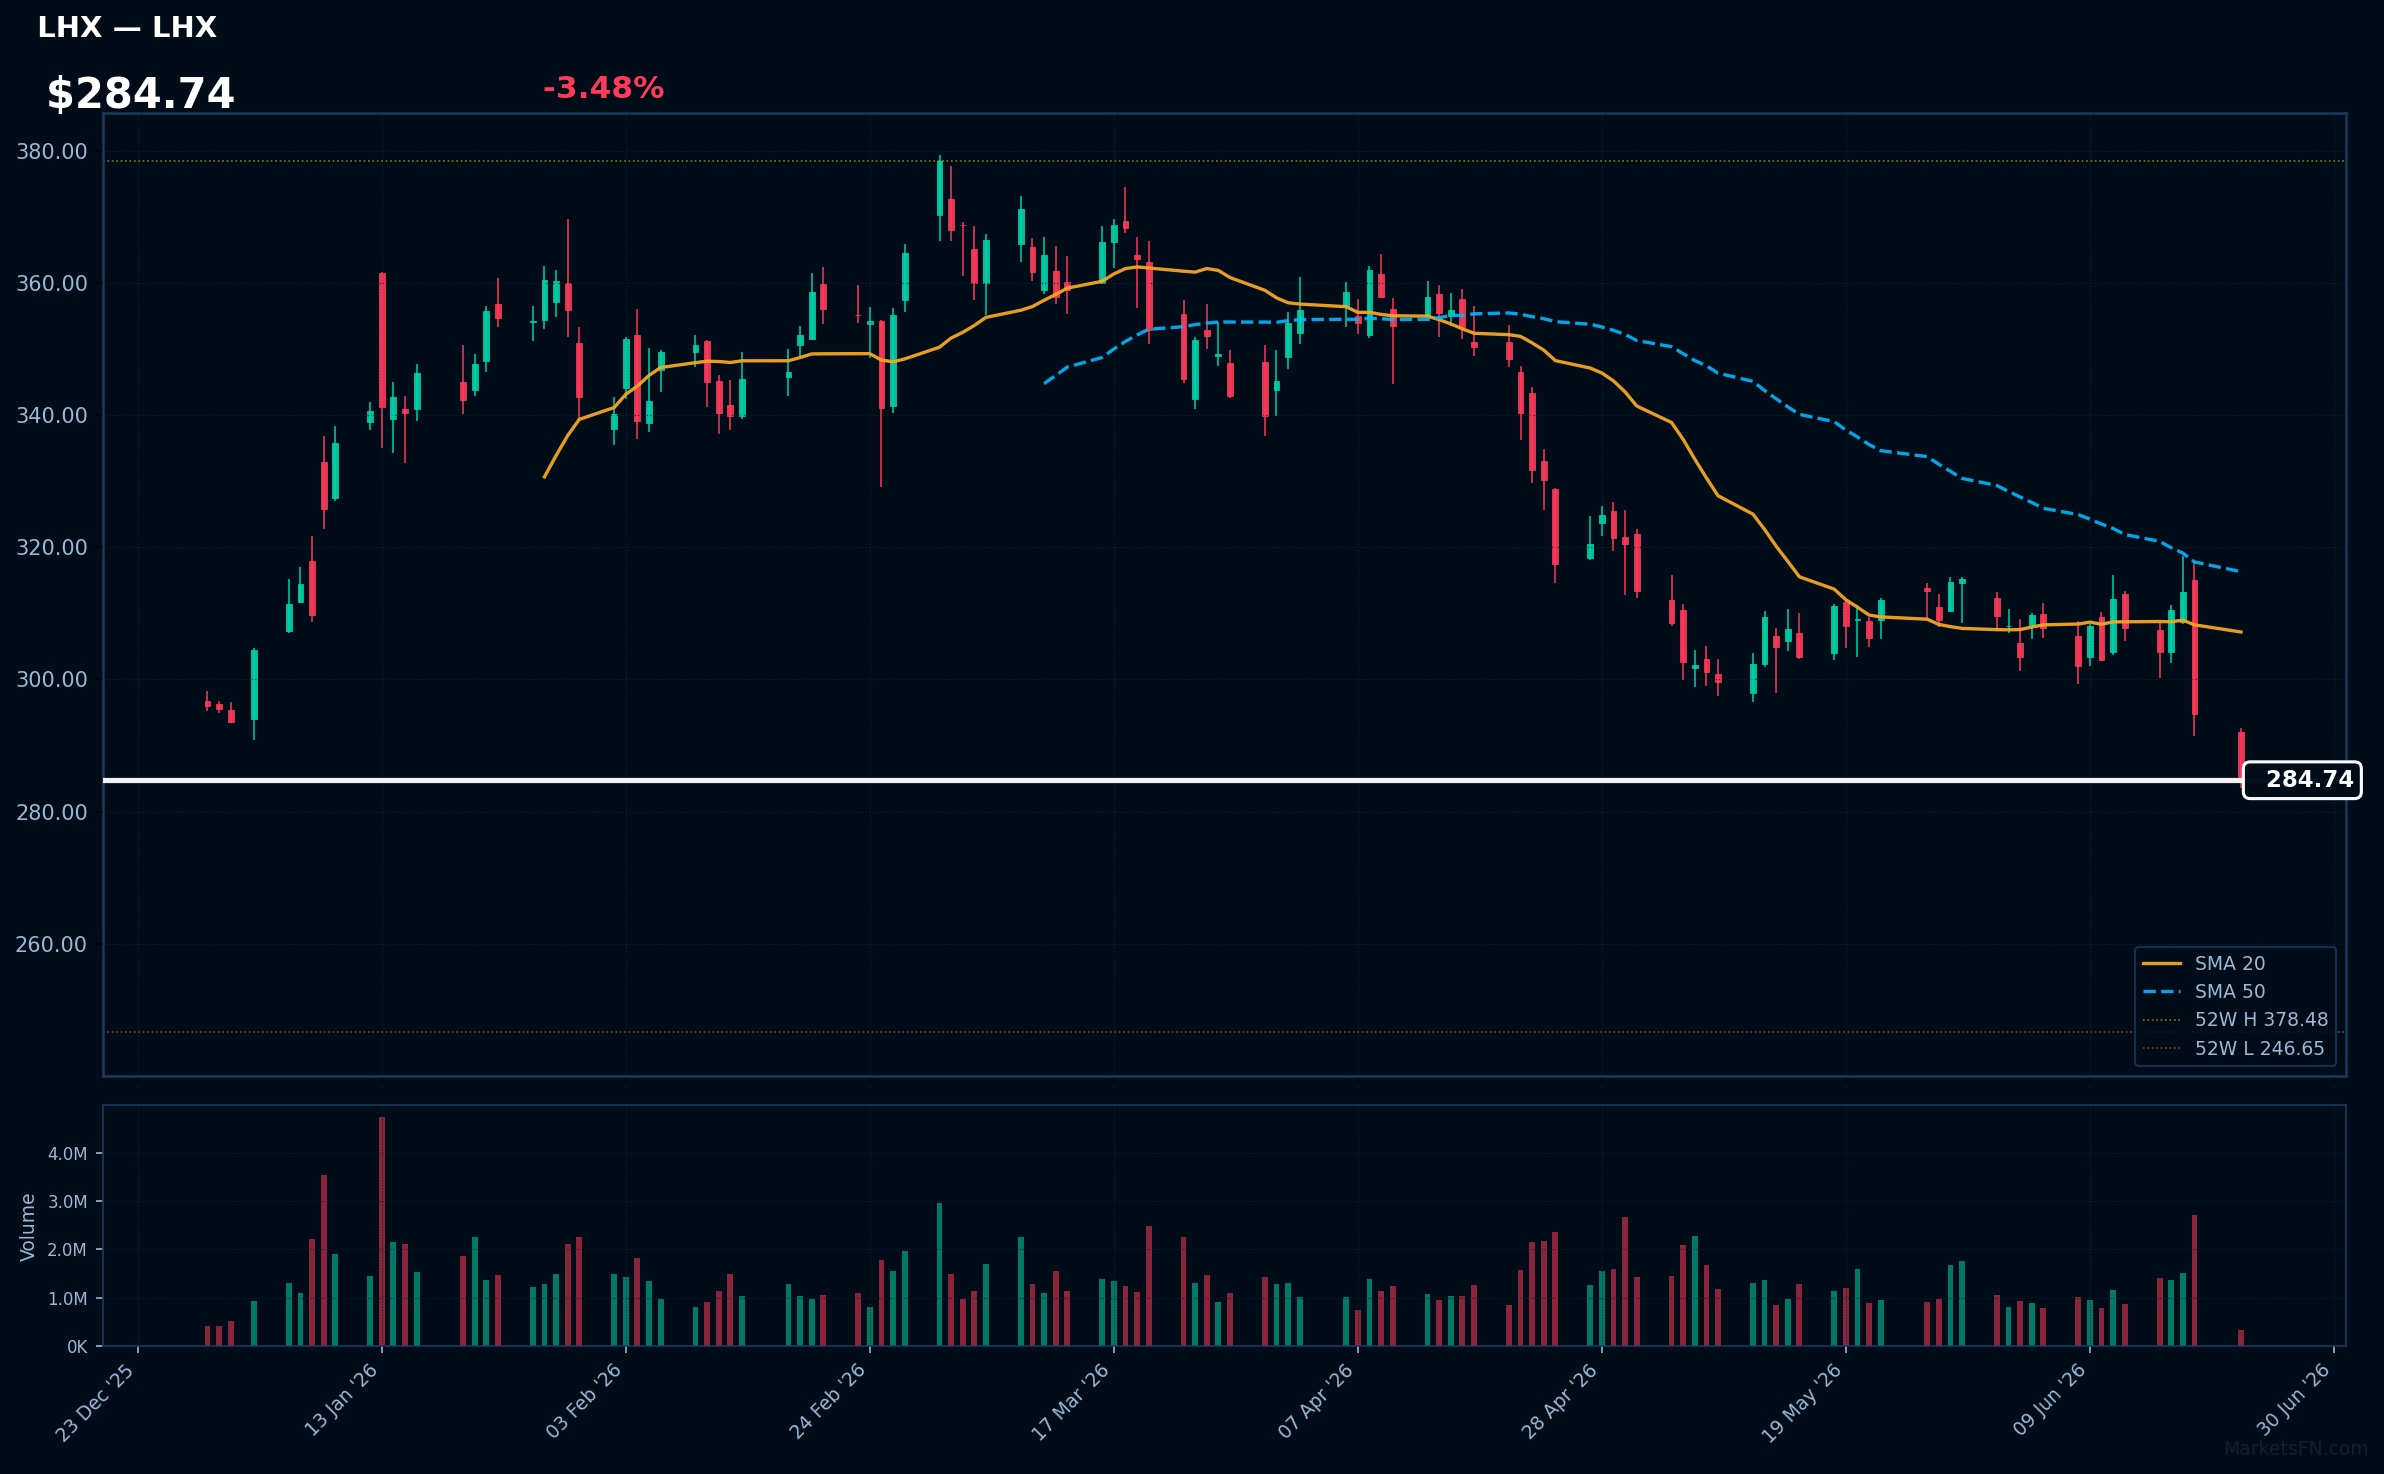
LHX | L3Harris Technologies Inc | Industrials | Price: $284.57 | Day: -3.48% | 1W: -7.49% | 1M: -7.90% | RSI: 34.4 | vs MA200: -9.9% | Trend: Below MA20, MA50, MA200
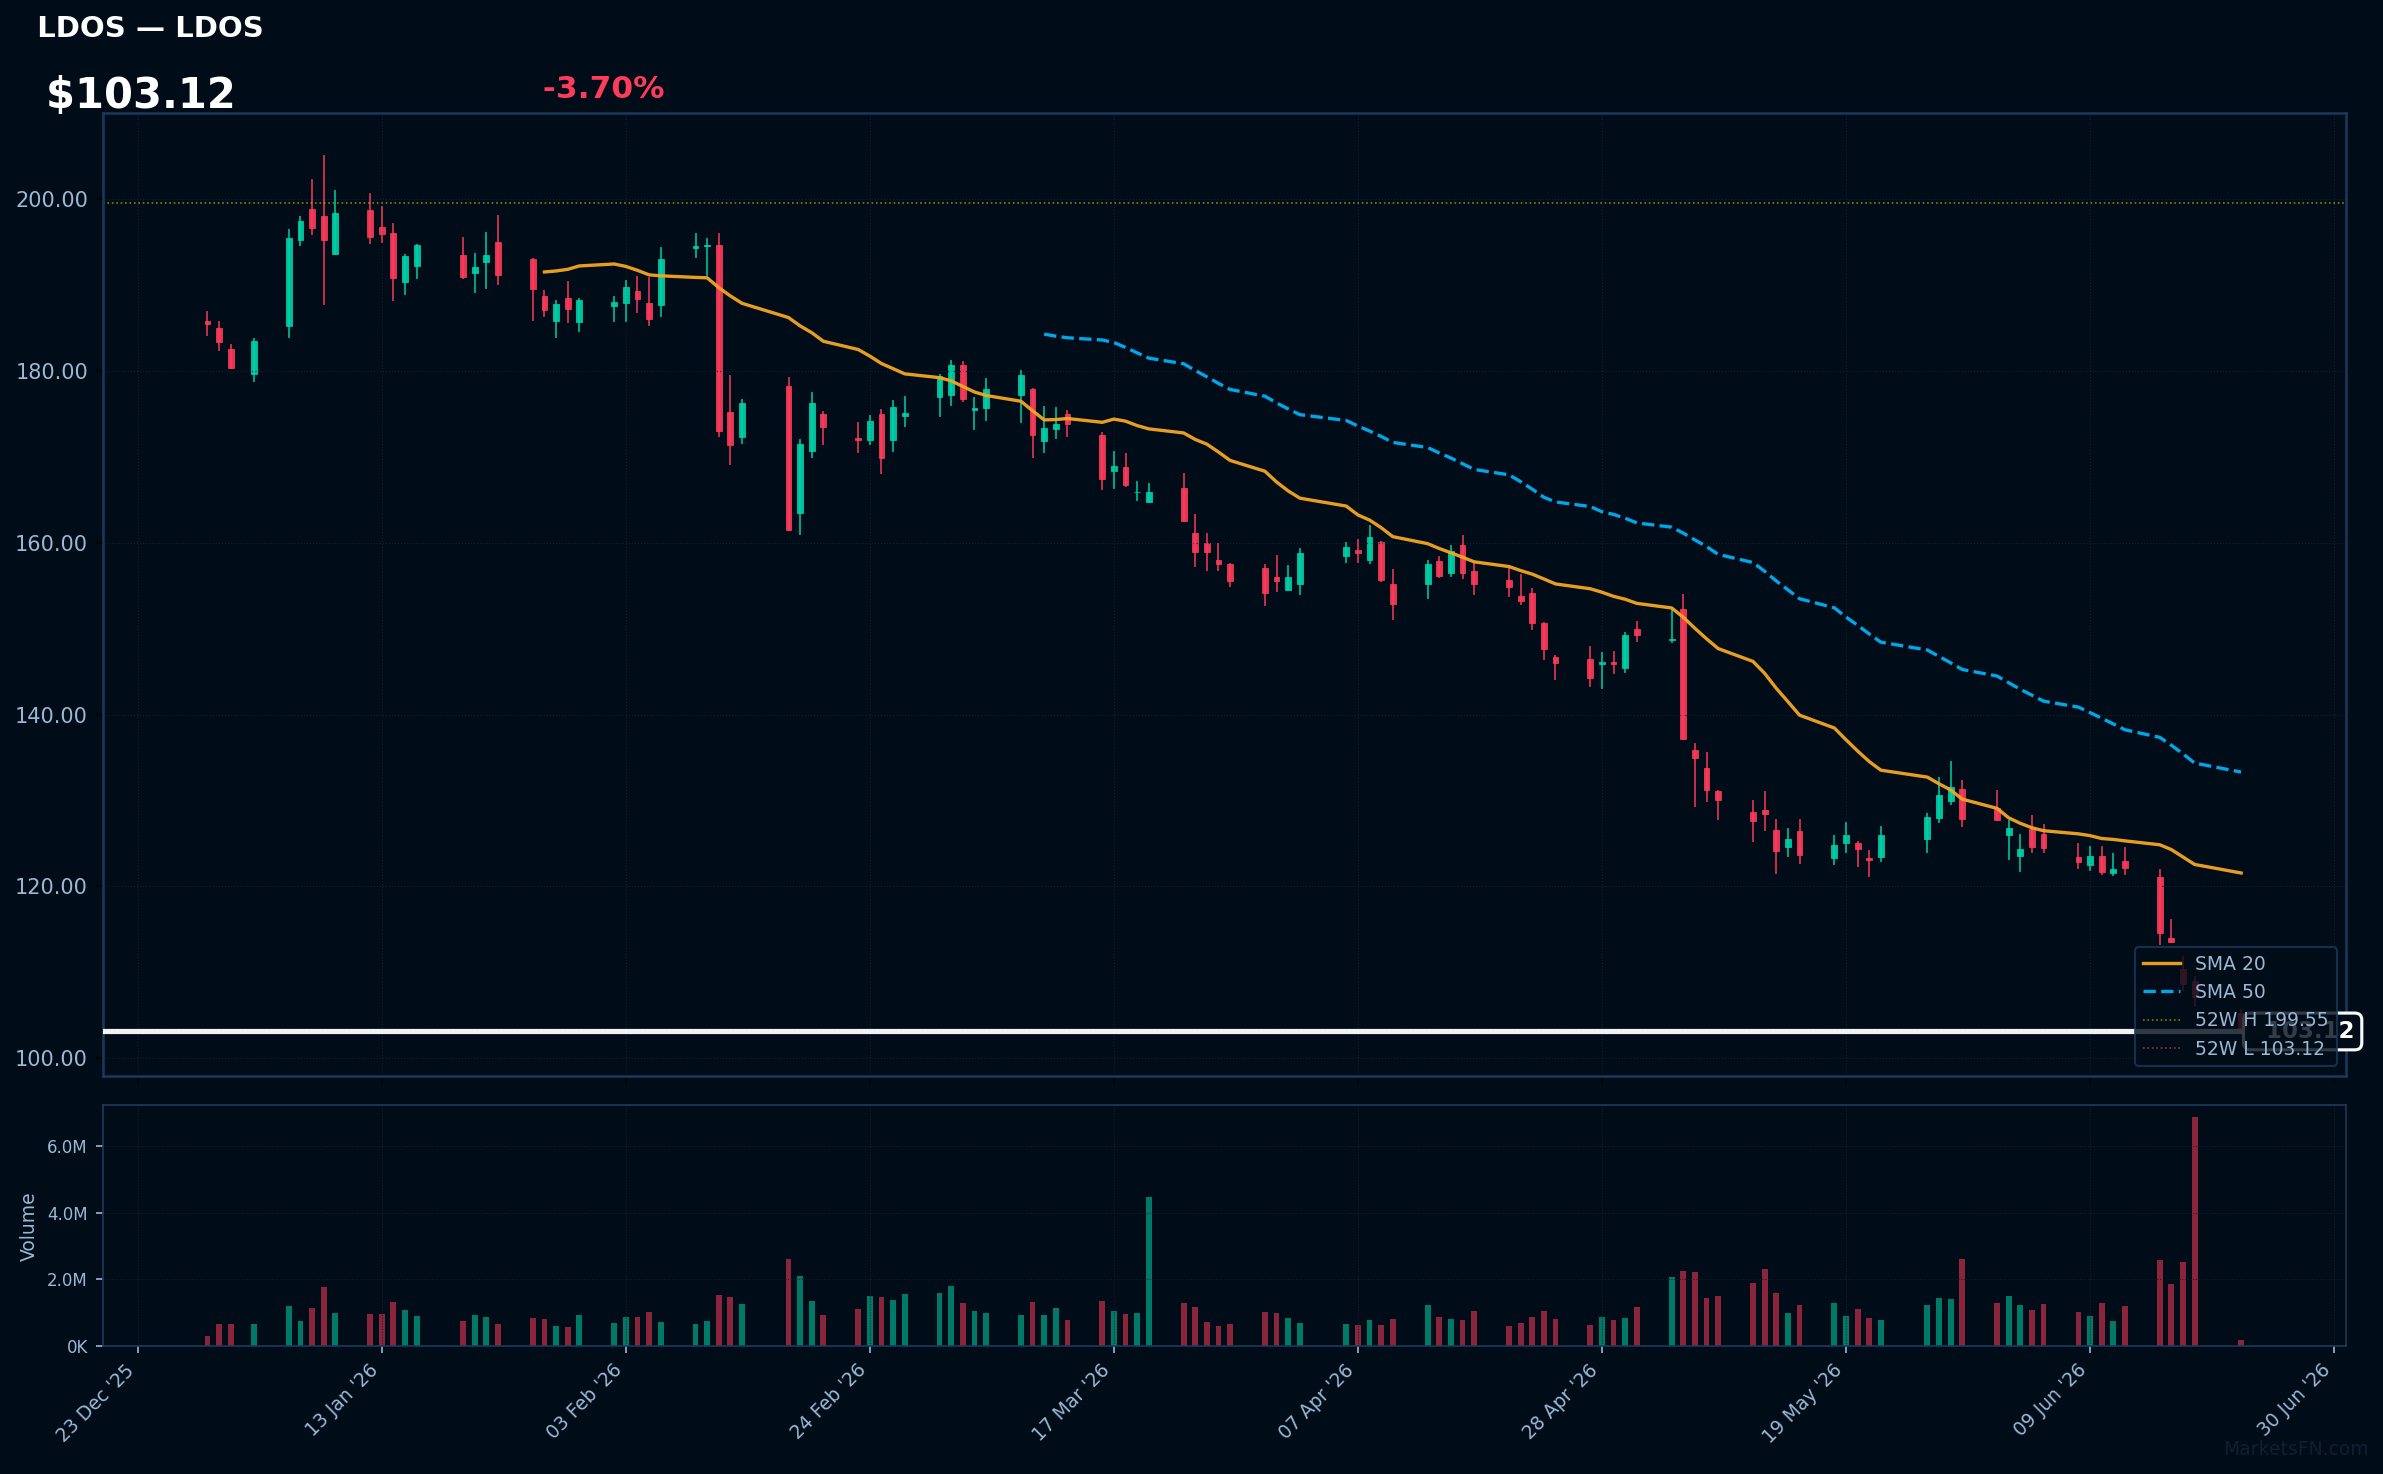
LDOS | Leidos Holdings Inc | Technology | Price: $103.16 | Day: -3.70% | 1W: -15.58% | 1M: -17.10% | RSI: 15.4 | vs MA200: -39.6% | Trend: Below MA20, MA50, MA200
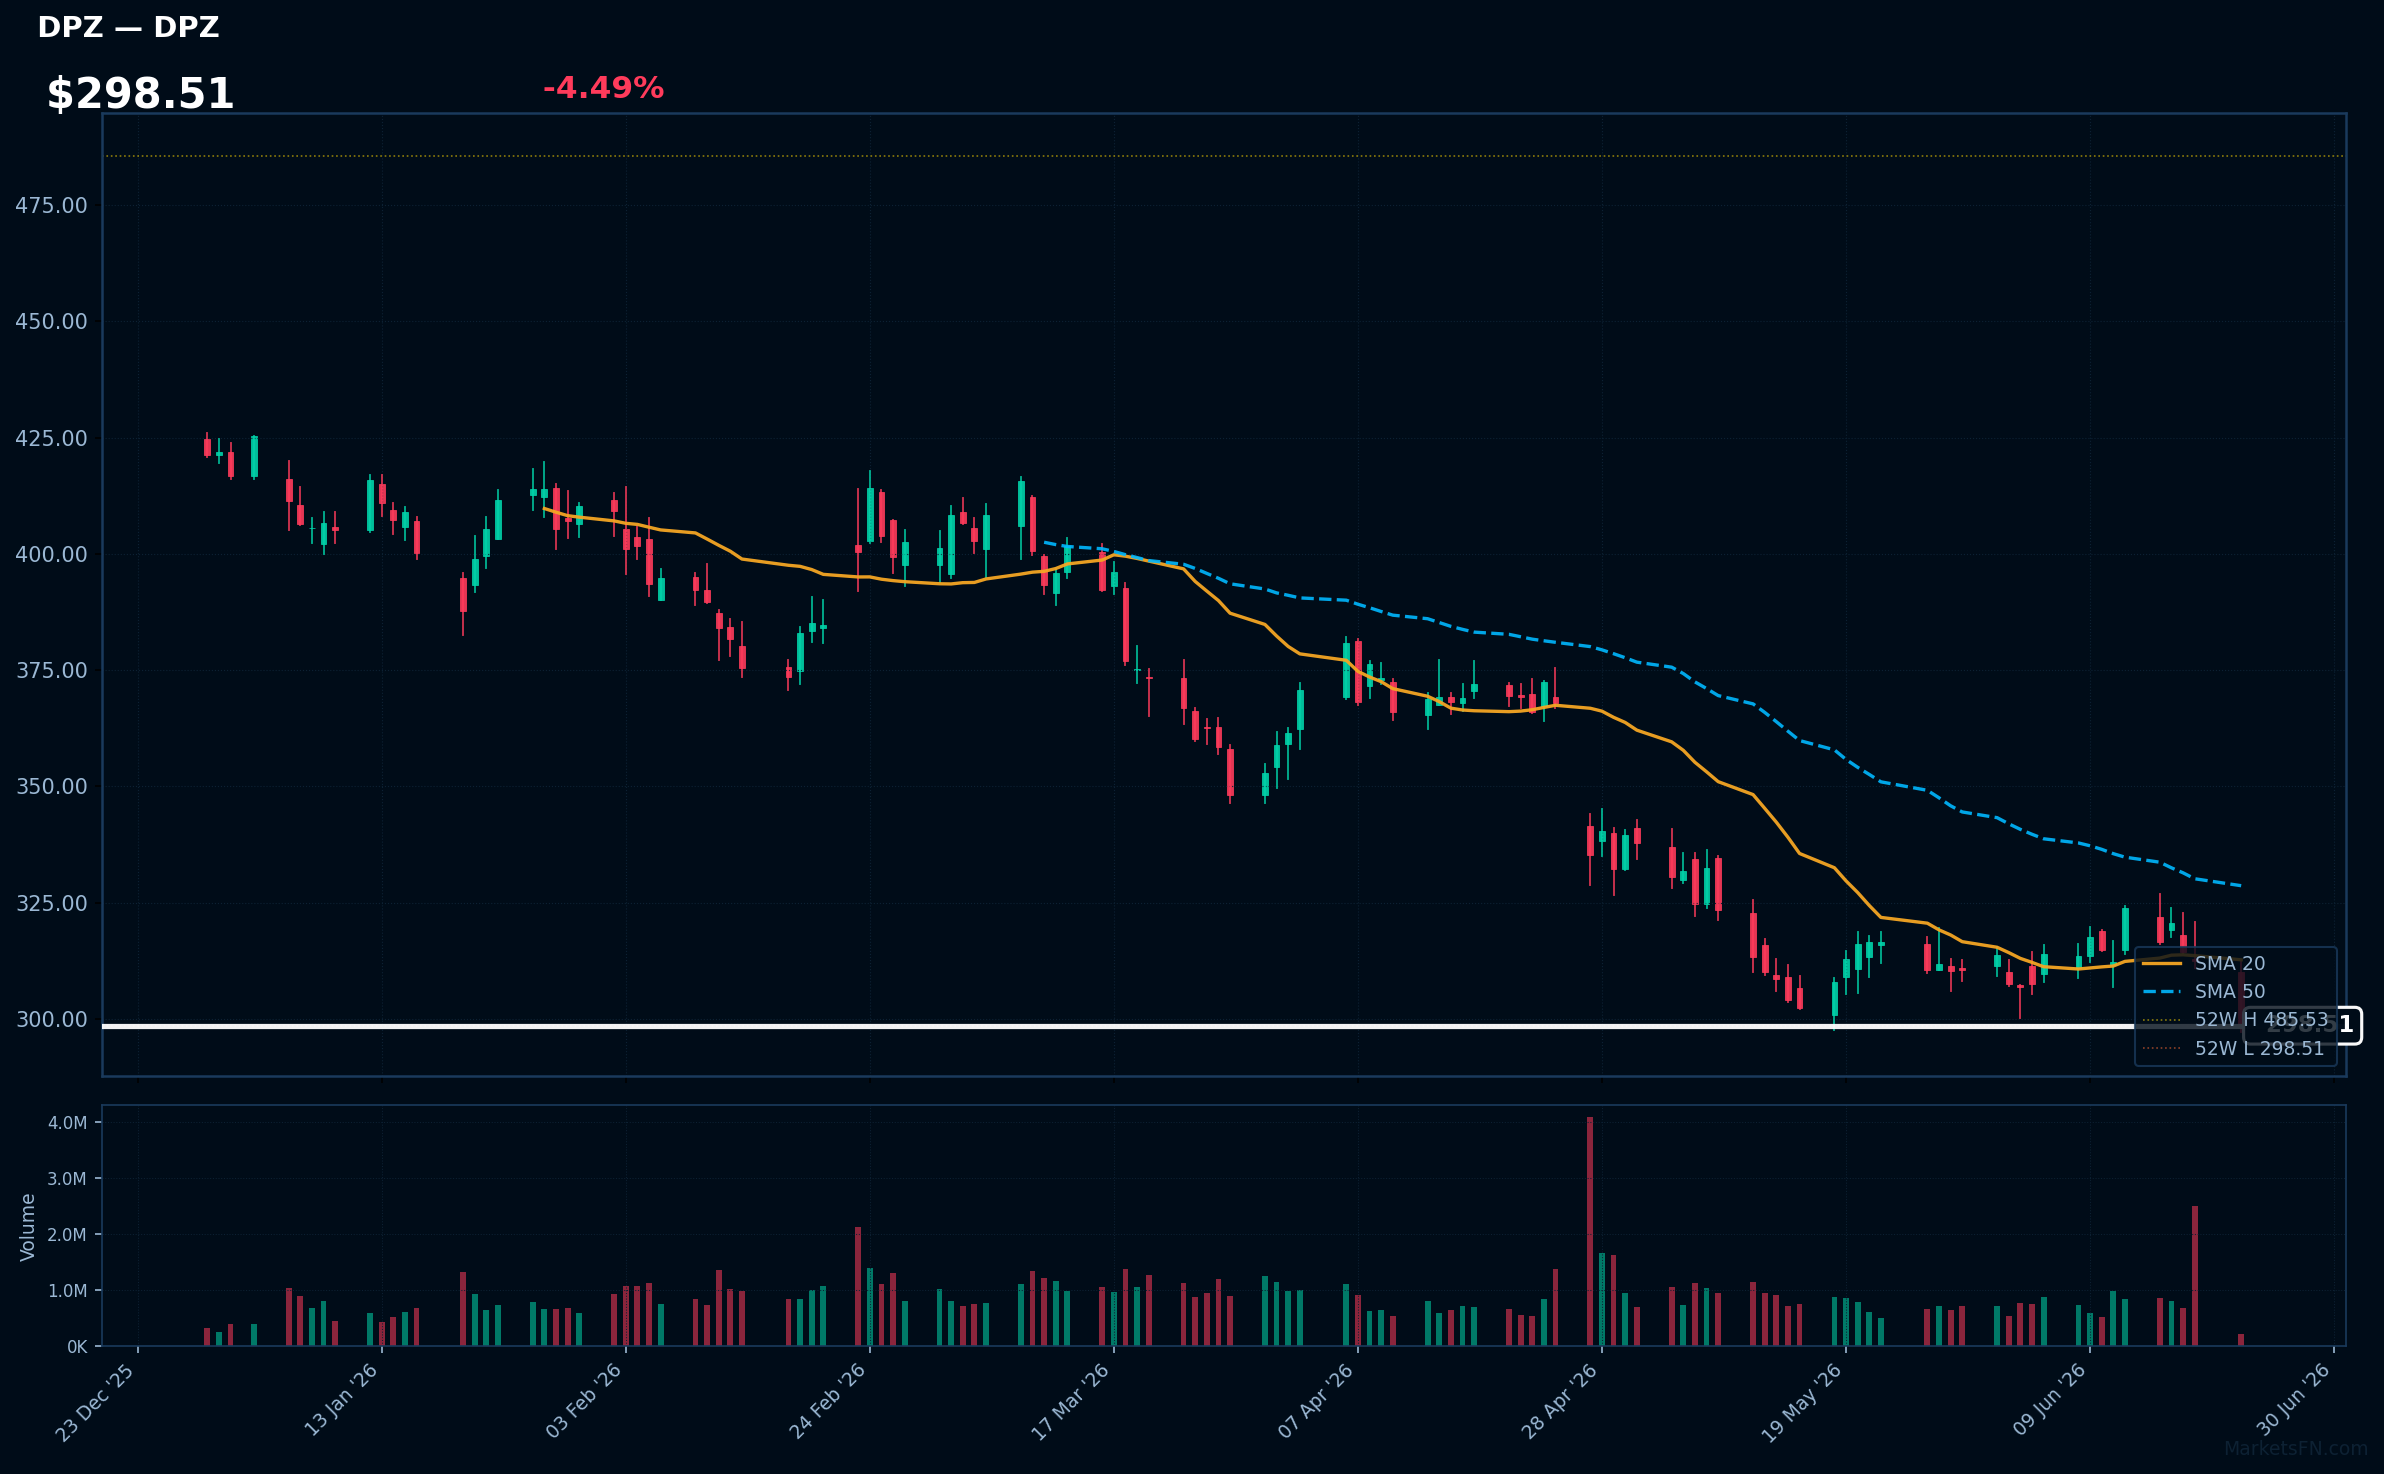
DPZ | Dominos Pizza Inc | Consumer Cyclical | Price: $298.45 | Day: -4.49% | 1W: -7.83% | 1M: -5.53% | RSI: 35.6 | vs MA200: -23.3% | Trend: Below MA20, MA50, MA200
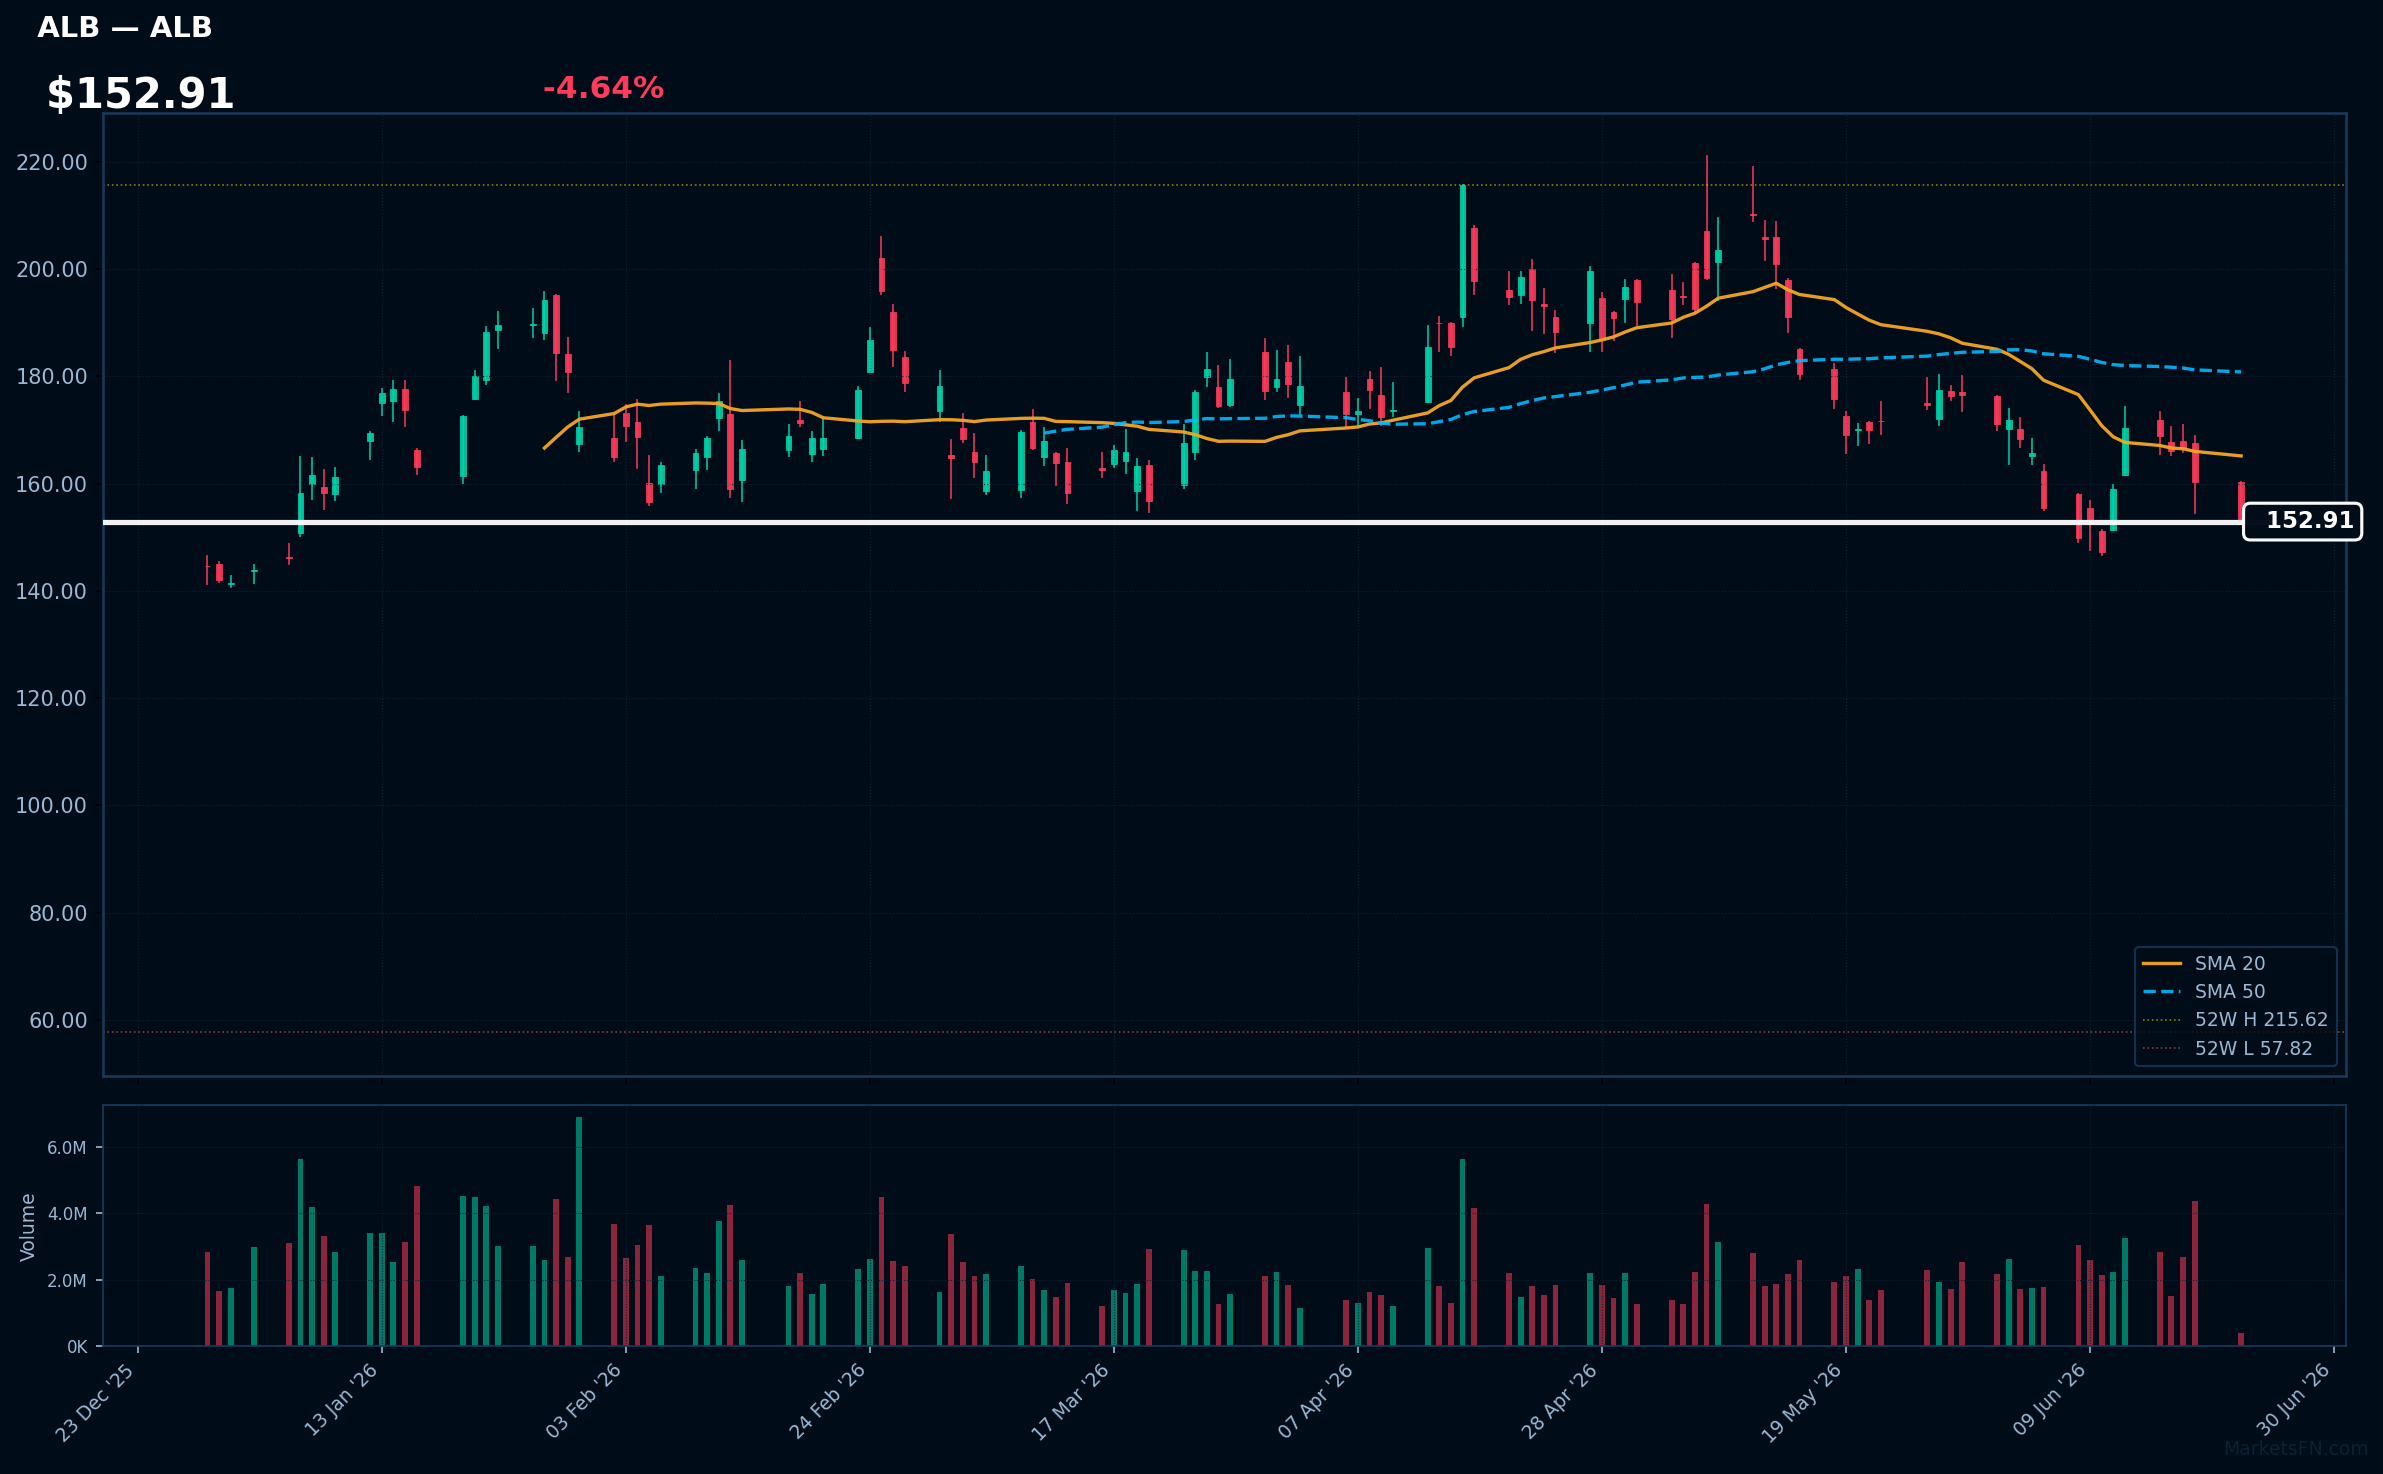
ALB | Albemarle Corp | Basic Materials | Price: $152.91 | Day: -4.64% | 1W: -10.27% | 1M: -10.16% | RSI: 37.9 | vs MA200: +4.4% | Trend: Above MA200 · Below MA20, MA50
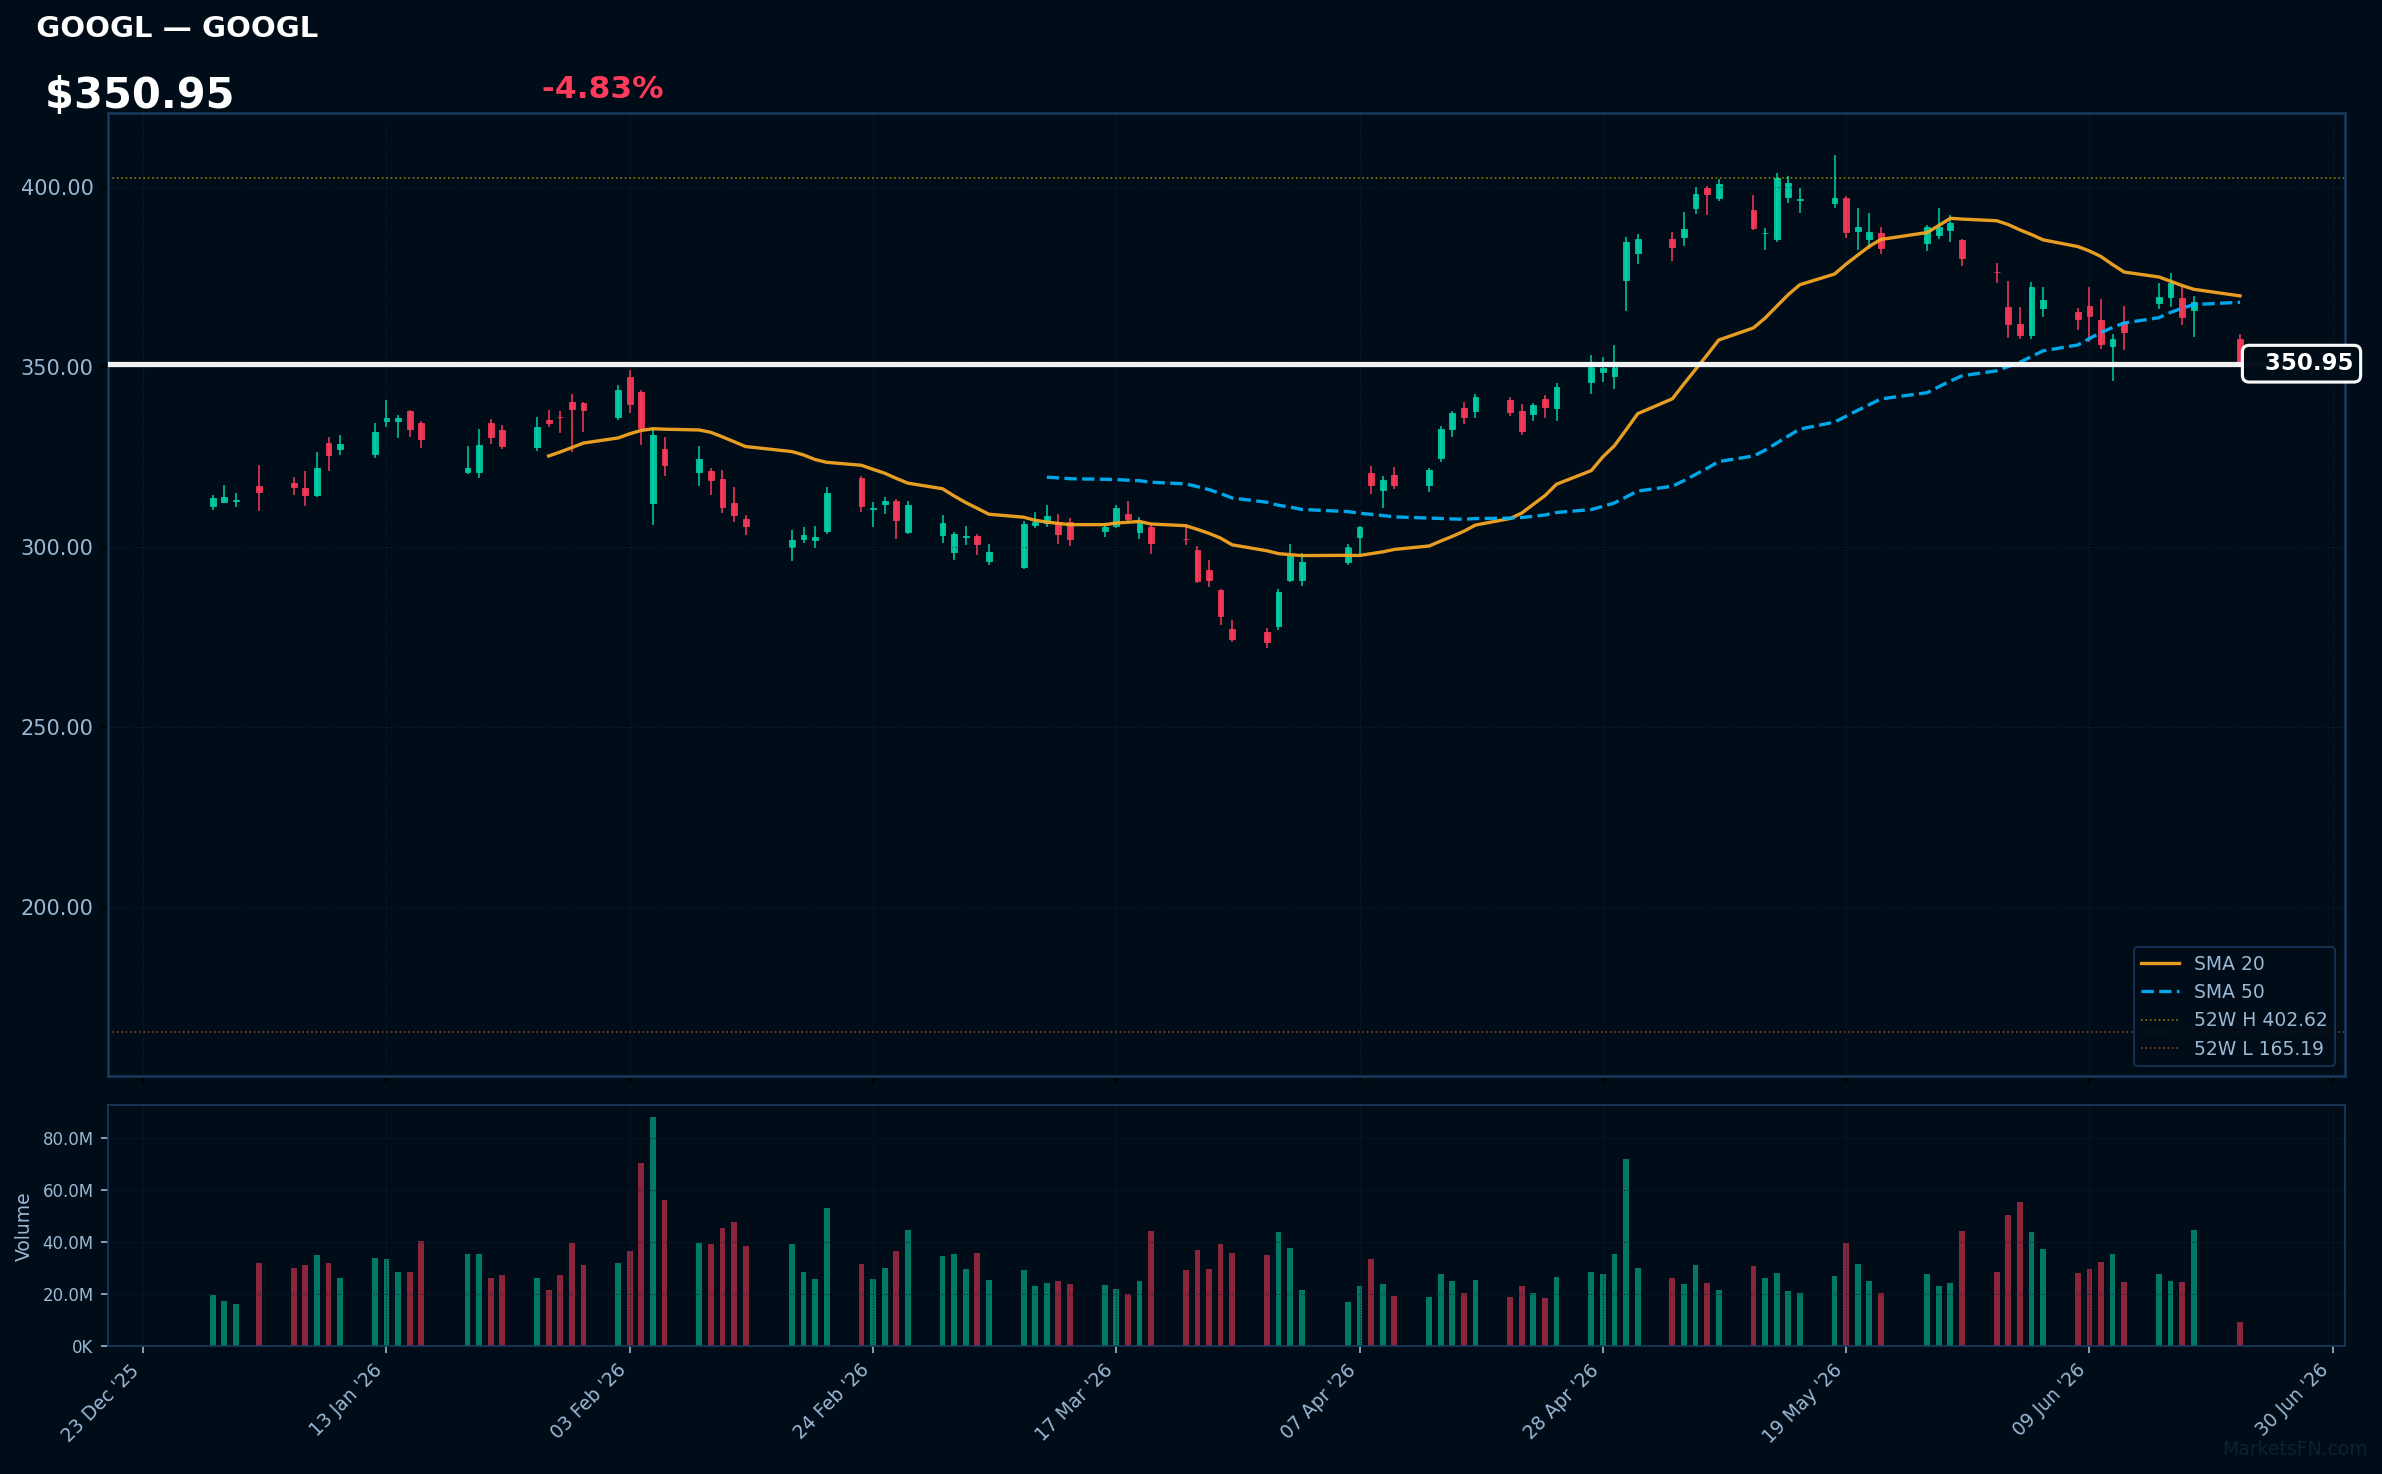
GOOGL | Alphabet Inc | Communication Services | Price: $350.25 | Day: -4.83% | 1W: -2.43% | 1M: -9.76% | RSI: 39.5 | vs MA200: +12.4% | Trend: Above MA200 · Below MA20, MA50
Recent headlines (last 12h)
- SK Hynix overtakes Samsung to become South Korea's most valuable company
- Why Wait For Adobe Stock To Bottom When You Can Get Paid Today?
- Google Backs $3.2B AI Chip Push Against Nvidia
- J.P. Morgan Fires Back at Google Rumors Threatening Broadcom Stock
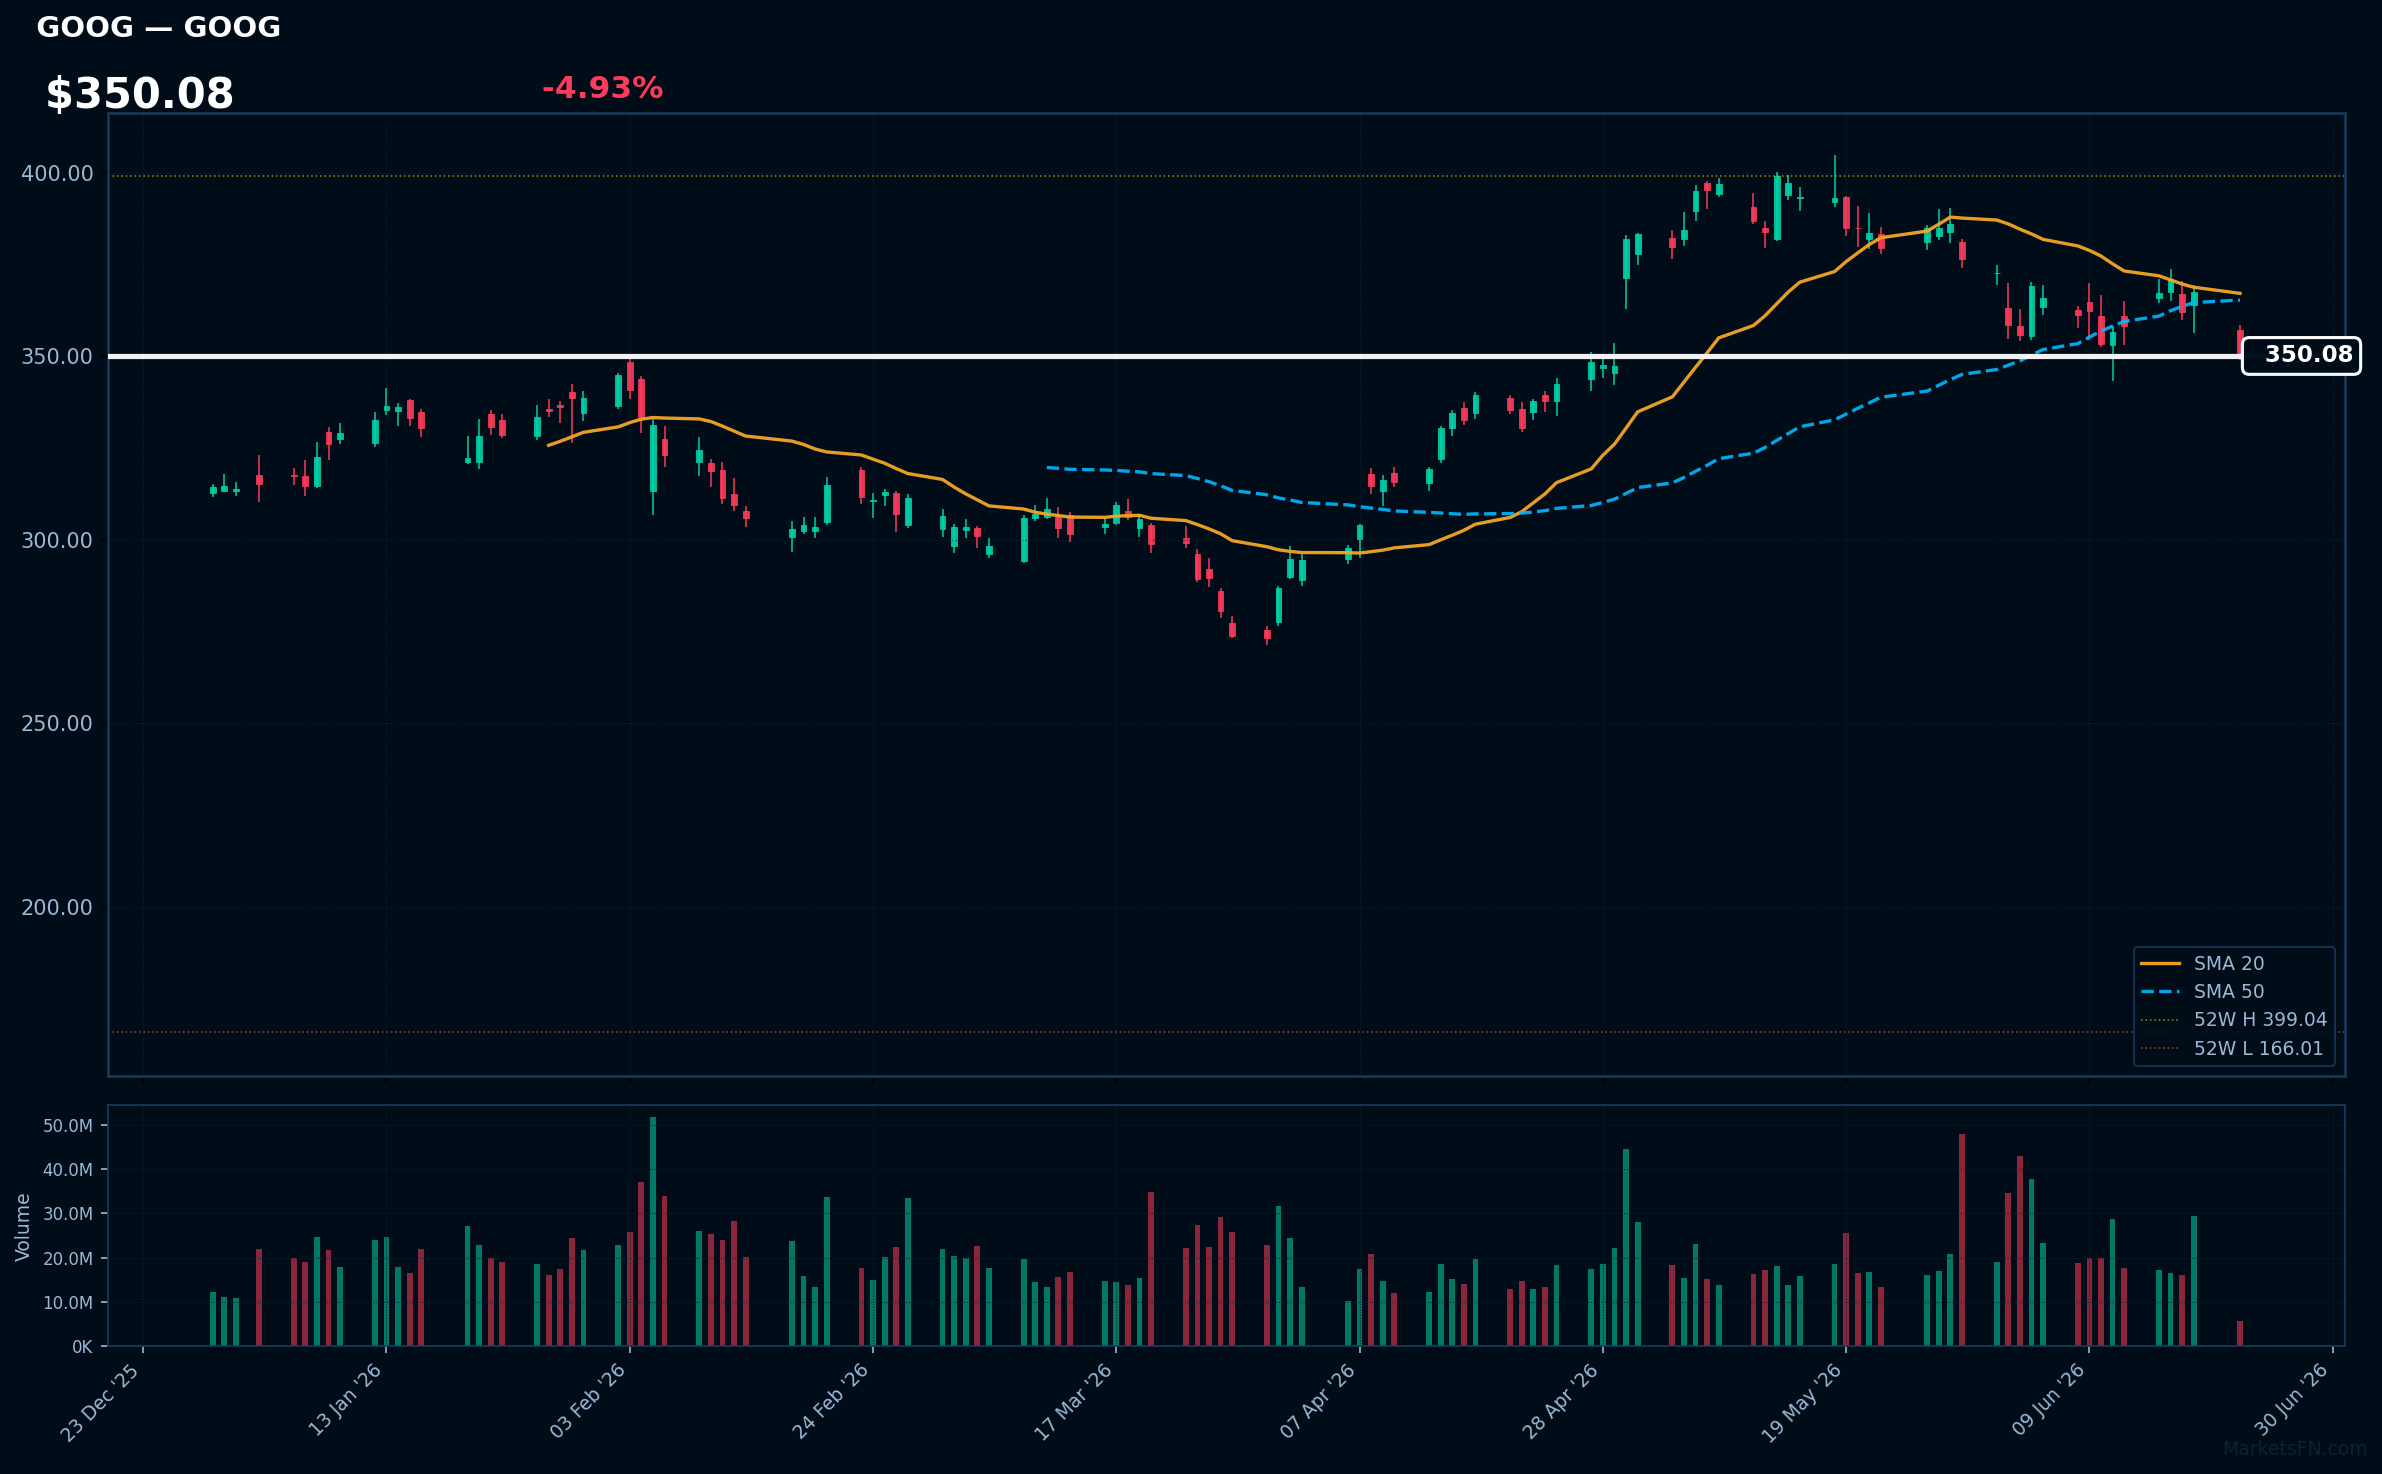
GOOG | Alphabet Inc | Communication Services | Price: $349.35 | Day: -4.93% | 1W: -2.26% | 1M: -9.05% | RSI: 40.6 | vs MA200: +12.3% | Trend: Above MA200 · Below MA20, MA50
Recent headlines (last 12h)
- SK Hynix overtakes Samsung to become South Korea's most valuable company
- Why Wait For Adobe Stock To Bottom When You Can Get Paid Today?
- Google Backs $3.2B AI Chip Push Against Nvidia
- J.P. Morgan Fires Back at Google Rumors Threatening Broadcom Stock
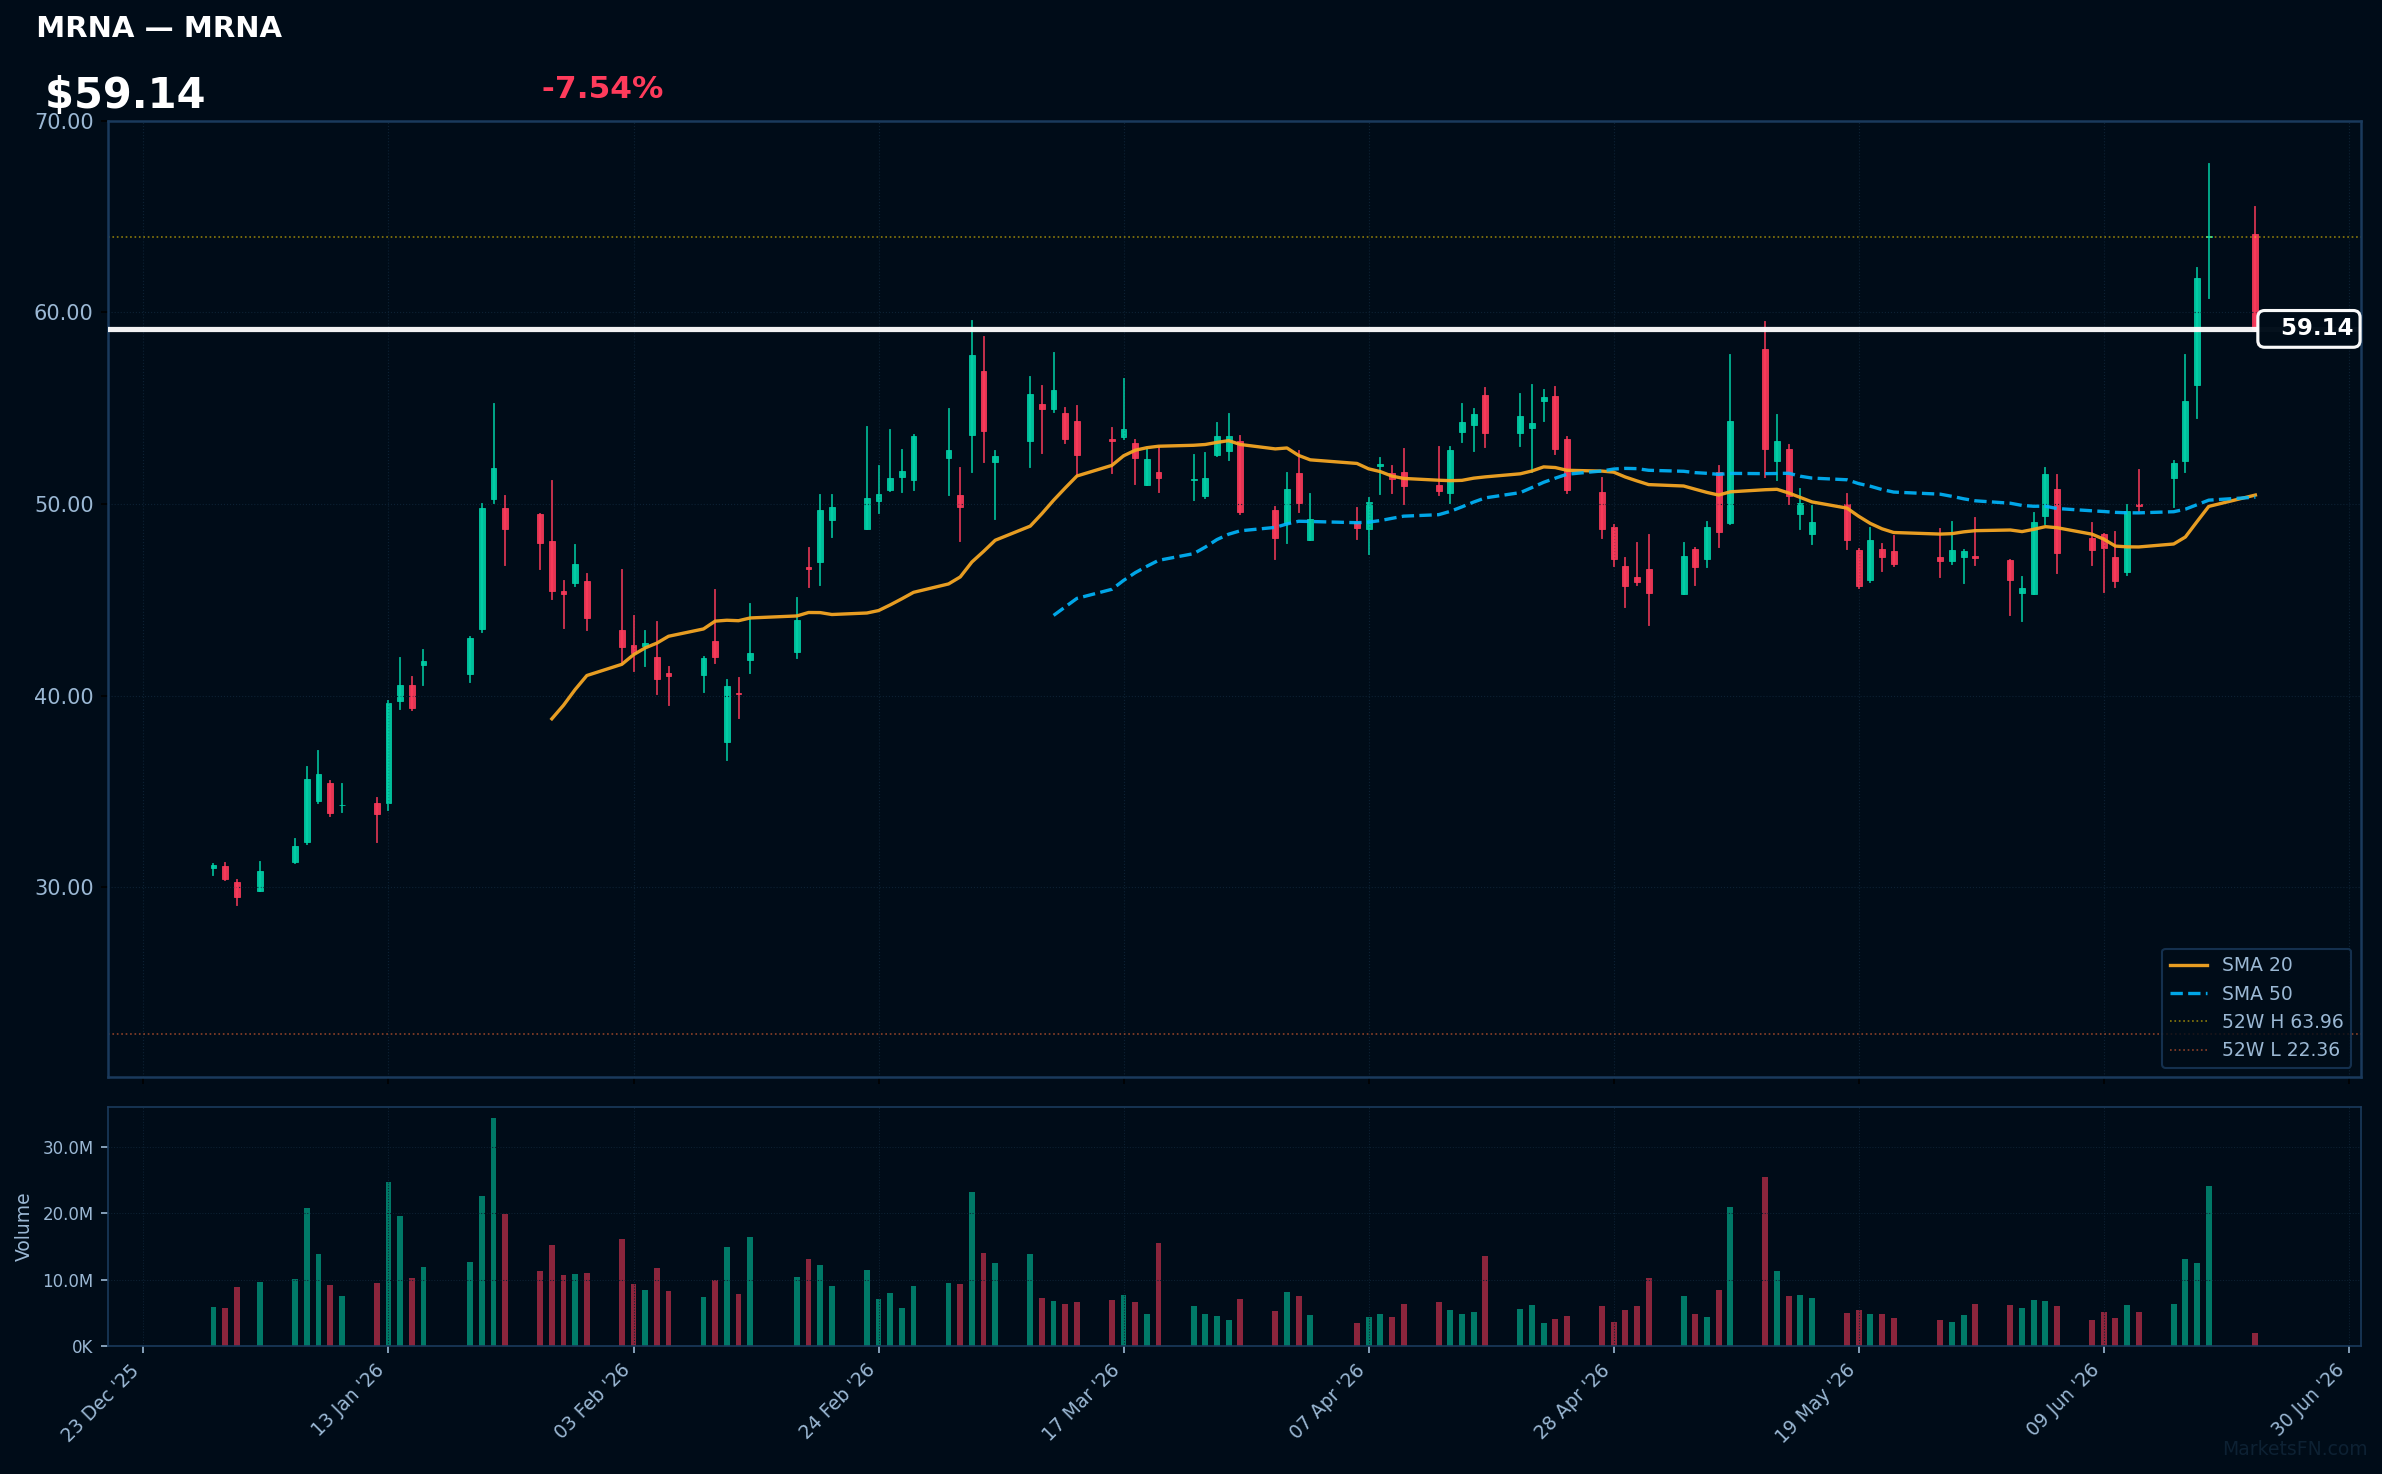
MRNA | Moderna Inc | Healthcare | Price: $59.14 | Day: -7.54% | 1W: +18.49% | 1M: +22.90% | RSI: 63.1 | vs MA200: +50.1% | Trend: Above MA20, MA50, MA200
Recent headlines (last 12h)
- Modernas mRNA flu vaccine passes FDA AdCom, review underway
Market Commentary
The S&P 500 session on June 22, 2026, showed a positive tone with 59.7% of constituents advancing, outnumbering decliners by a margin of 296 to 198. The average daily change was +0.30%, indicating a modestly bullish session.
Sector rotation is evident from the top gainers and losers. Technology and Industrials led the gains, with SMCI, SWKS, and GNRC among the top 10 gainers. Conversely, Consumer Cyclical and Communication Services were under pressure, with LULU, FOXA, GOOGL, and GOOG featuring among the top losers. This rotation suggests a shift towards cyclical and industrials sectors.
Traders should monitor the MA200 level, as only 2.2% of stocks are currently trading above it. A significant move above this level could indicate a broader trend reversal. The next catalyst to watch is the upcoming earnings reports from key constituents, which could validate or invalidate the current sector rotation and overall market tone.
Methodology
Daily ranking uses the latest session close versus the prior close. RSI (14-day EWM), MA20, MA50, and MA200 are computed from 12 months of daily OHLCV data sourced from Yahoo Finance. Charts show the last 120 trading sessions with SMA 20/50, 52-week H/L markers, and volume. Recent news (last 12 h) is sourced from FinViz. Updated every trading day.
Disclaimer
The content on MarketsFN.com is provided for educational and informational purposes only. It does not constitute financial advice, investment recommendations, or trading guidance. All investments involve risks, and past performance does not guarantee future results. You are solely responsible for your investment decisions and should conduct independent research and consult a qualified financial advisor before acting. MarketsFN.com and its authors are not liable for any losses or damages arising from your use of this information.
Related Articles
- Nasdaq 100 Bull & Bear Radar — June 22, 2026 — Nasdaq 100 Bull & Bear Radar — June 22, 2026 A daily technical sweep of 100 Nasdaq 100 constituents ranked by session…
- S&P 500 52-Week Highs & Lows Radar: GE Aerospace (GE), Palantir (PLTR) and more — S&P 500 stocks nearest to their 52-week high and low. Bloomberg-style charts, RSI/MA analysis and Grok commentary.
- S&P 500 52-Week Highs & Lows Radar: GE Aerospace (GE), Salesforce (CRM) and more — S&P 500 stocks nearest to their 52-week high and low. Bloomberg-style charts, RSI/MA analysis and Grok commentary.
- S&P 500 Bull & Bear Radar — June 19, 2026 — S&P 500 Bull & Bear Radar — June 19, 2026 A daily technical sweep of 495 S&P 500 constituents ranked by session…
- Nasdaq 100 Bull & Bear Radar — June 19, 2026 — Nasdaq 100 Bull & Bear Radar — June 19, 2026 A daily technical sweep of 101 Nasdaq 100 constituents ranked by session…