Nasdaq 100 Bull & Bear Radar — June 22, 2026
· Stocks · QuoteReporter
Nasdaq 100 Bull & Bear Radar — June 22, 2026
A daily technical sweep of 100 Nasdaq 100 constituents ranked by session performance, enriched with RSI, MA20/MA50/MA200 trend signals, Bloomberg-style charts, and recent news.
Index-Wide Breadth
| Constituents tracked | 100 |
| Advancing | 58 (58.0%) |
| Declining | 41 (41.0%) |
| Average daily change | +0.39% |
| Above MA200 | 16 (16.0%) |
Top 10 Gainers
Today's strongest Nasdaq 100 performers. Sector leadership: Technology (9), Consumer Cyclical (1).
| Ticker | Company | Sector | Price | Day % | 1W % | 1M % | RSI | vs MA200 | Trend |
|---|---|---|---|---|---|---|---|---|---|
| ON | ON Semiconductor Corp | Technology | $131.95 | +8.49% | +13.08% | +19.83% | 60.8 | +91.4% | Above MA20, MA50, MA200 |
| MU | Micron Technology Inc | Technology | $1189.44 | +4.89% | +21.20% | +62.53% | 68.9 | +192.9% | Above MA20, MA50, MA200 |
| GFS | GlobalFoundries Inc | Technology | $89.97 | +4.82% | +10.66% | +27.21% | 64.7 | +90.7% | Above MA20, MA50, MA200 |
| NXPI | NXP Semiconductors NV | Technology | $326.74 | +4.30% | +7.29% | +5.46% | 60.1 | +39.5% | Above MA20, MA50, MA200 |
| MCHP | Microchip Technology, Inc | Technology | $103.88 | +4.12% | +9.16% | +10.57% | 62.1 | +42.8% | Above MA20, MA50, MA200 |
| KLAC | KLA Corp | Technology | $269.27 | +3.74% | +5.93% | +47.38% | 72.6 | +85.3% | Above MA20, MA50, MA200 |
| INTC | Intel Corp | Technology | $138.86 | +3.64% | +11.60% | +16.86% | 66.5 | +147.6% | Above MA20, MA50, MA200 |
| TXN | Texas Instruments Inc | Technology | $333.26 | +3.22% | +10.80% | +9.43% | 65.4 | +58.0% | Above MA20, MA50, MA200 |
| LRCX | Lam Research Corp | Technology | $401.45 | +3.19% | +9.50% | +37.51% | 70.9 | +89.7% | Above MA20, MA50, MA200 |
| ROST | Ross Stores, Inc | Consumer Cyclical | $240.20 | +3.18% | +0.04% | +10.30% | 61.5 | +25.4% | Above MA20, MA50, MA200 |
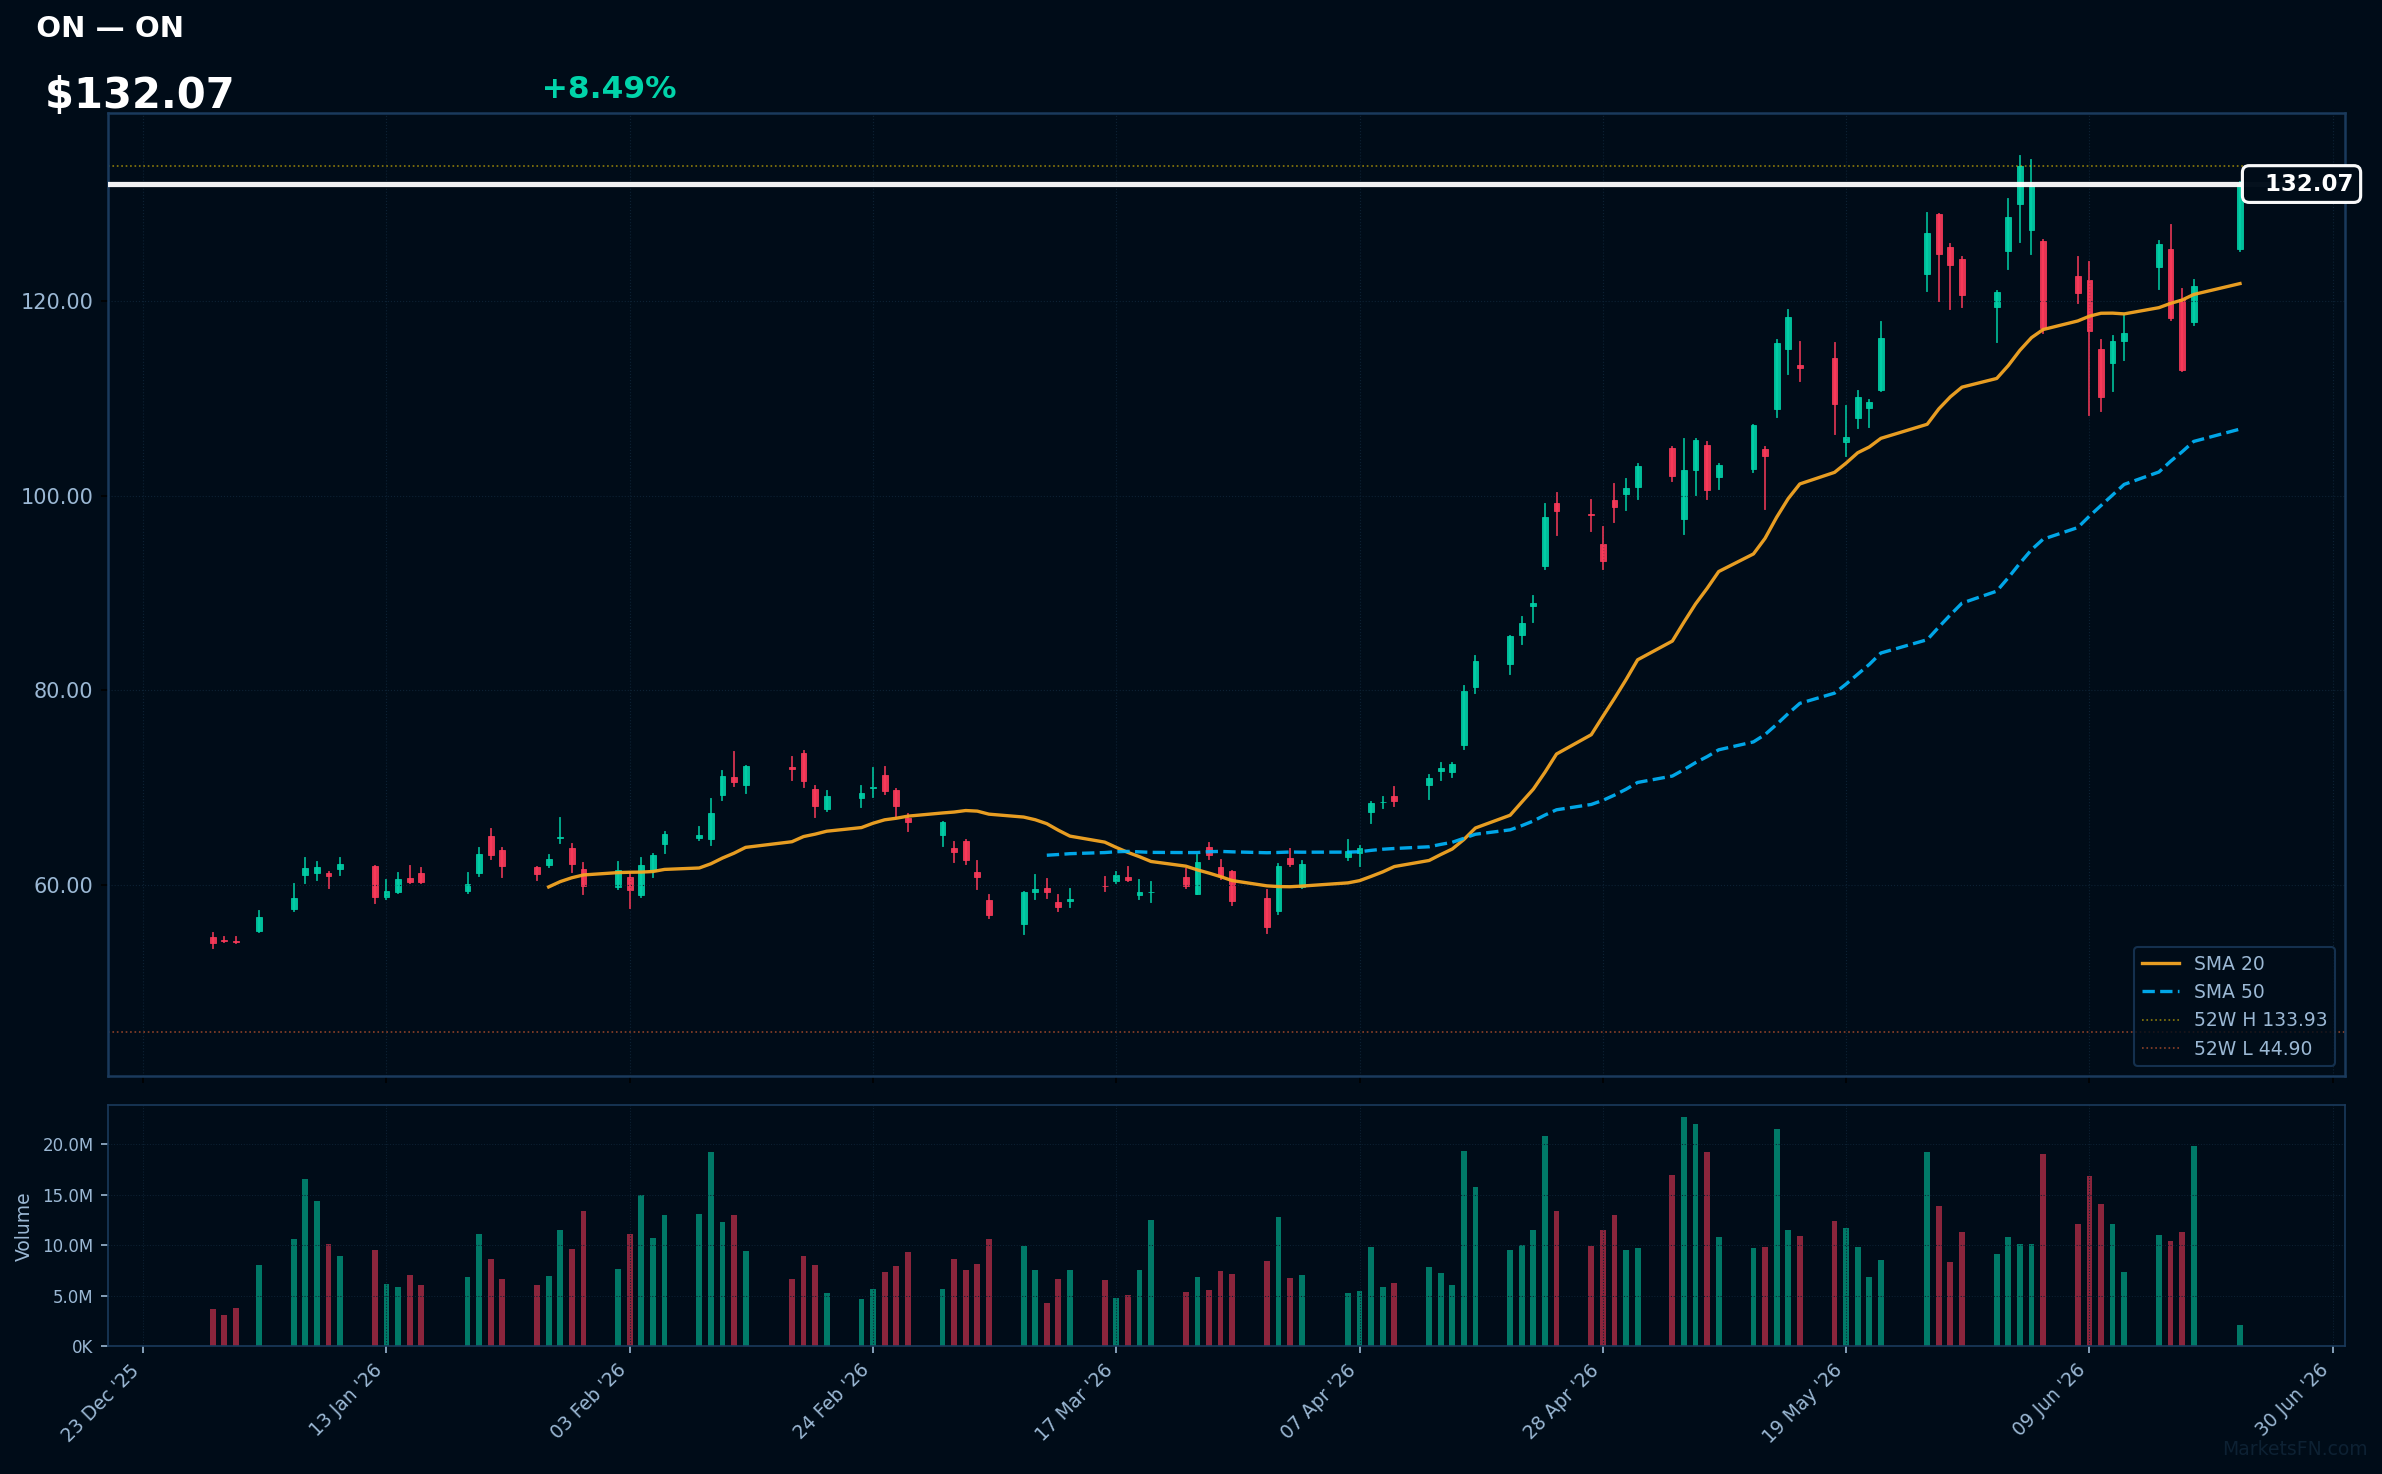
ON | ON Semiconductor Corp | Technology | Price: $131.95 | Day: +8.49% | 1W: +13.08% | 1M: +19.83% | RSI: 60.8 | vs MA200: +91.4% | Trend: Above MA20, MA50, MA200
Recent headlines (last 12h)
- Monday shaping up to be another big day for semiconductor names
- Dow Jones opens higher but Nasdaq flat as hawkish Fed still looms
MU | Micron Technology Inc | Technology | Price: $1189.44 | Day: +4.89% | 1W: +21.20% | 1M: +62.53% | RSI: 68.9 | vs MA200: +192.9% | Trend: Above MA20, MA50, MA200
Recent headlines (last 12h)
- MU, SNDK, Memory Stocks Buck Market Selloff After Fresh Trump Threats To Iran: Retail Traders Say 'Never Sell, Buy Dips
- SK Hynix dethrones Samsung Electronics as South Korea's most valuable company
- Micron surges 5.5% on blockbuster Anthropic AI deal ahead of earnings
- Micron Q3 Earnings Preview: What to Expect From Upcoming Report
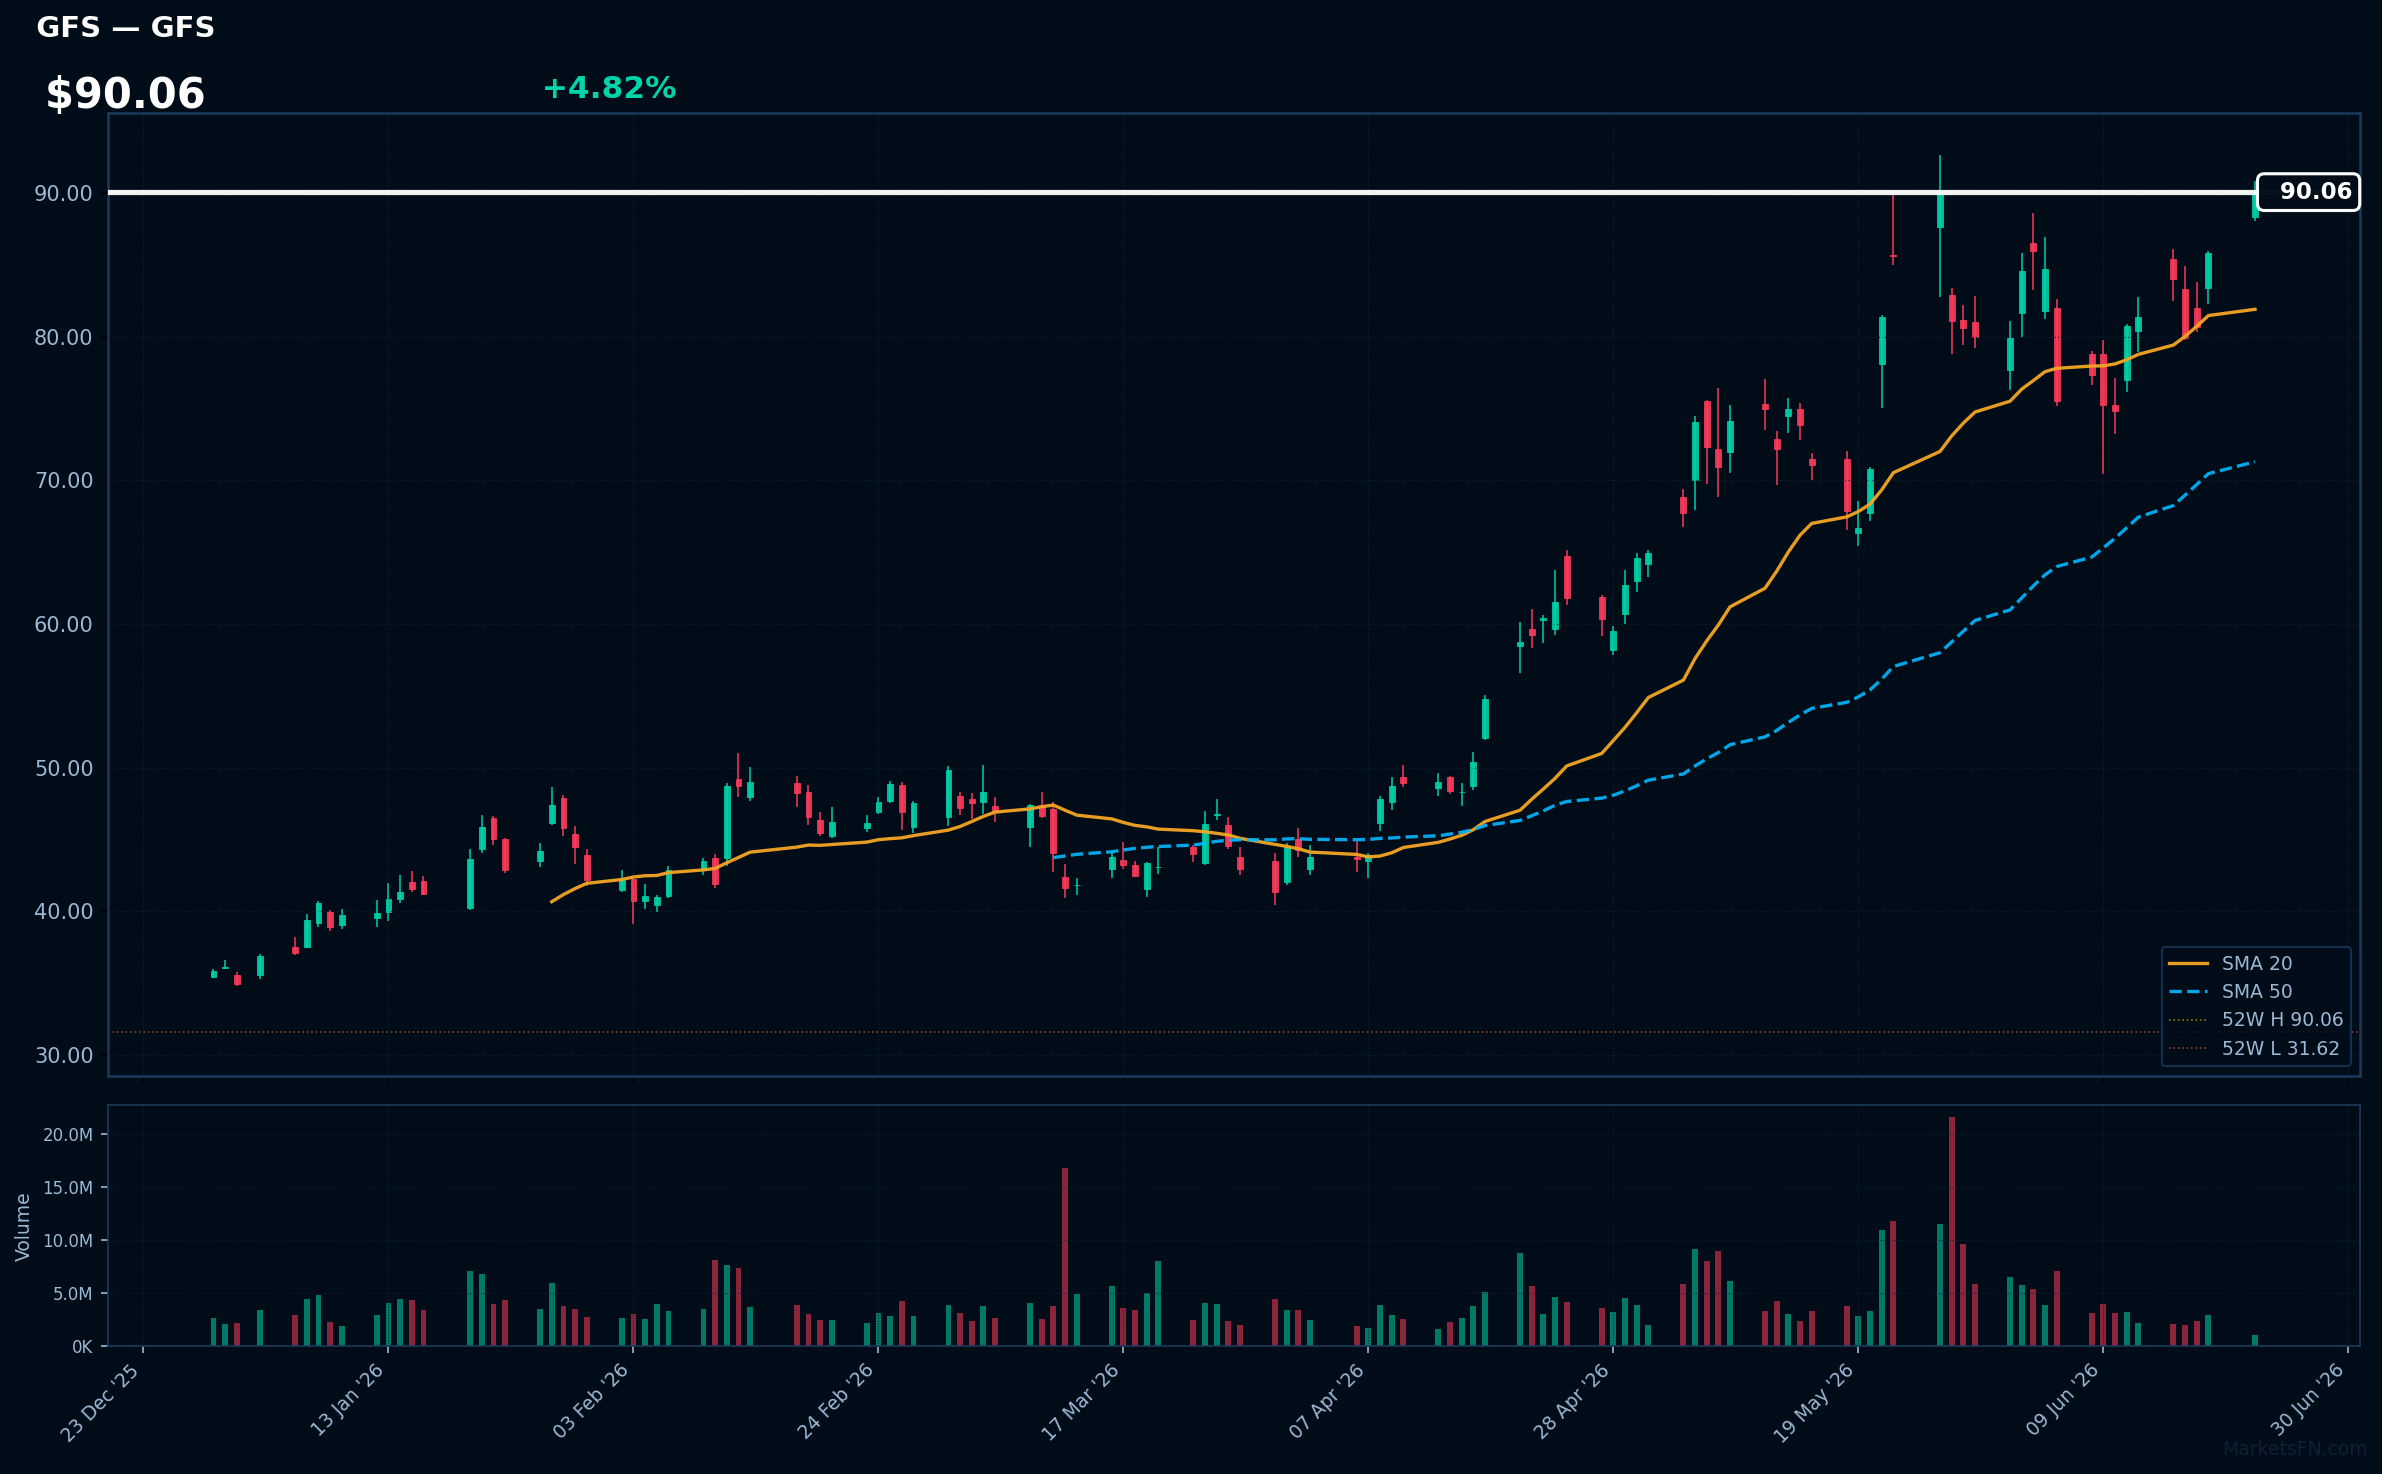
GFS | GlobalFoundries Inc | Technology | Price: $89.97 | Day: +4.82% | 1W: +10.66% | 1M: +27.21% | RSI: 64.7 | vs MA200: +90.7% | Trend: Above MA20, MA50, MA200
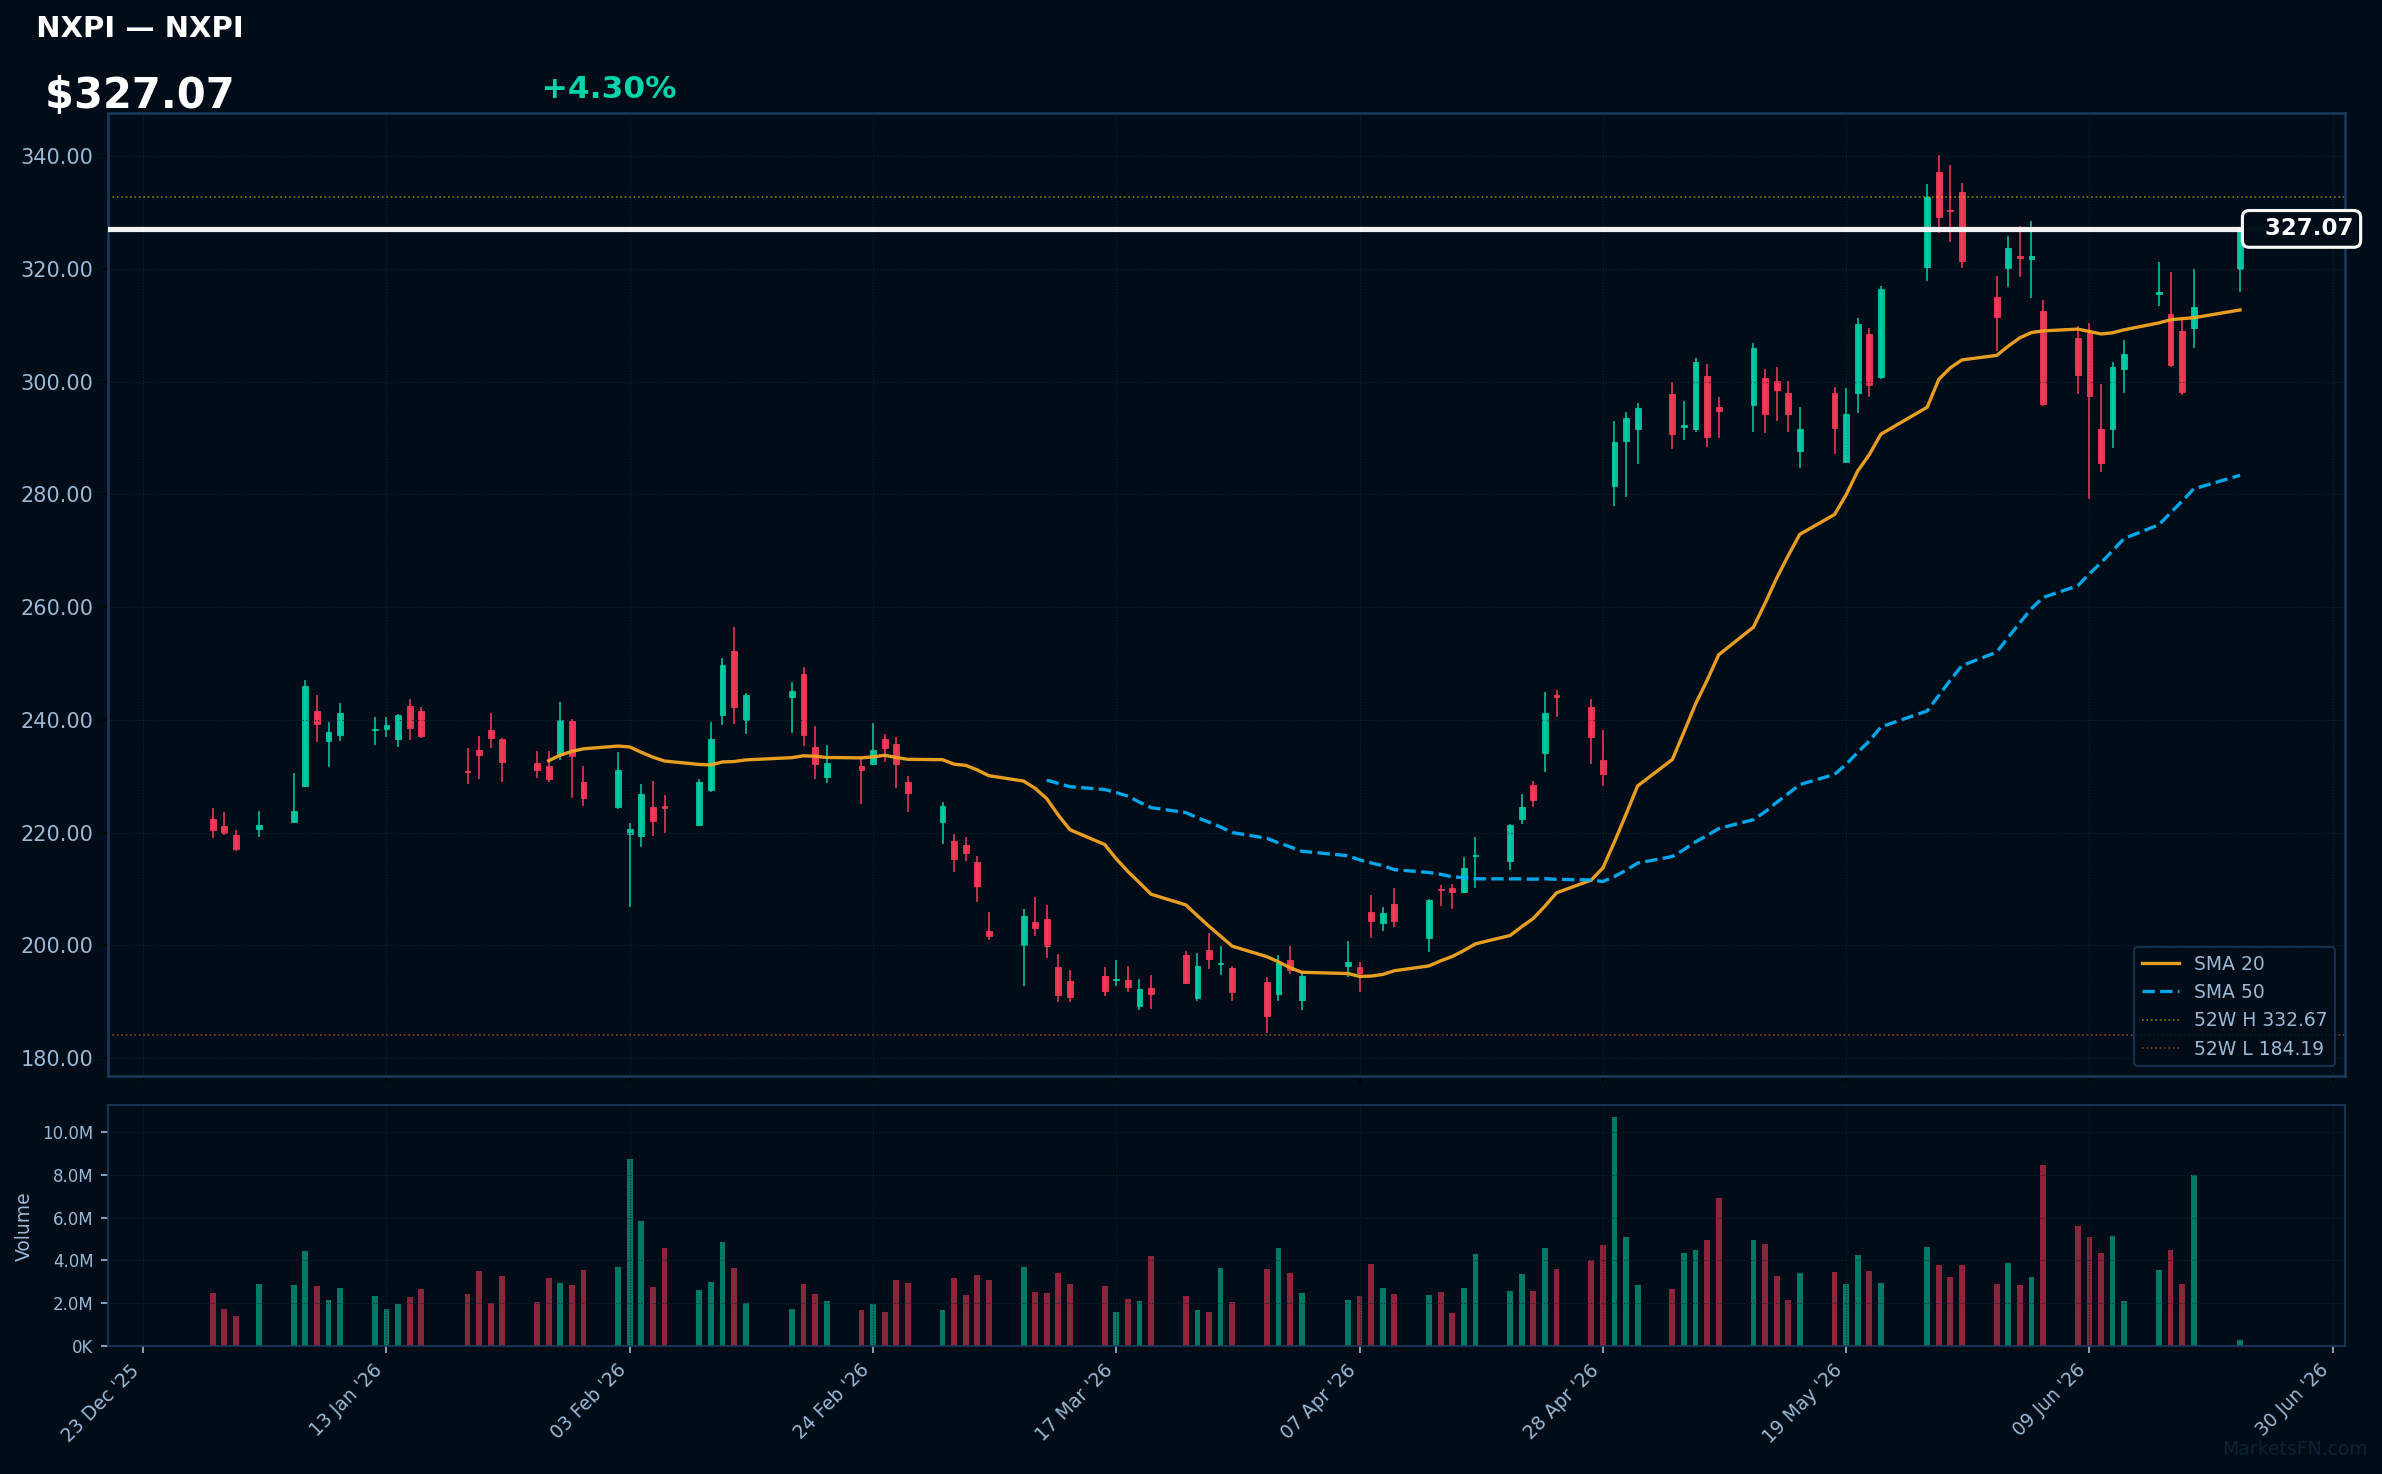
NXPI | NXP Semiconductors NV | Technology | Price: $326.74 | Day: +4.30% | 1W: +7.29% | 1M: +5.46% | RSI: 60.1 | vs MA200: +39.5% | Trend: Above MA20, MA50, MA200
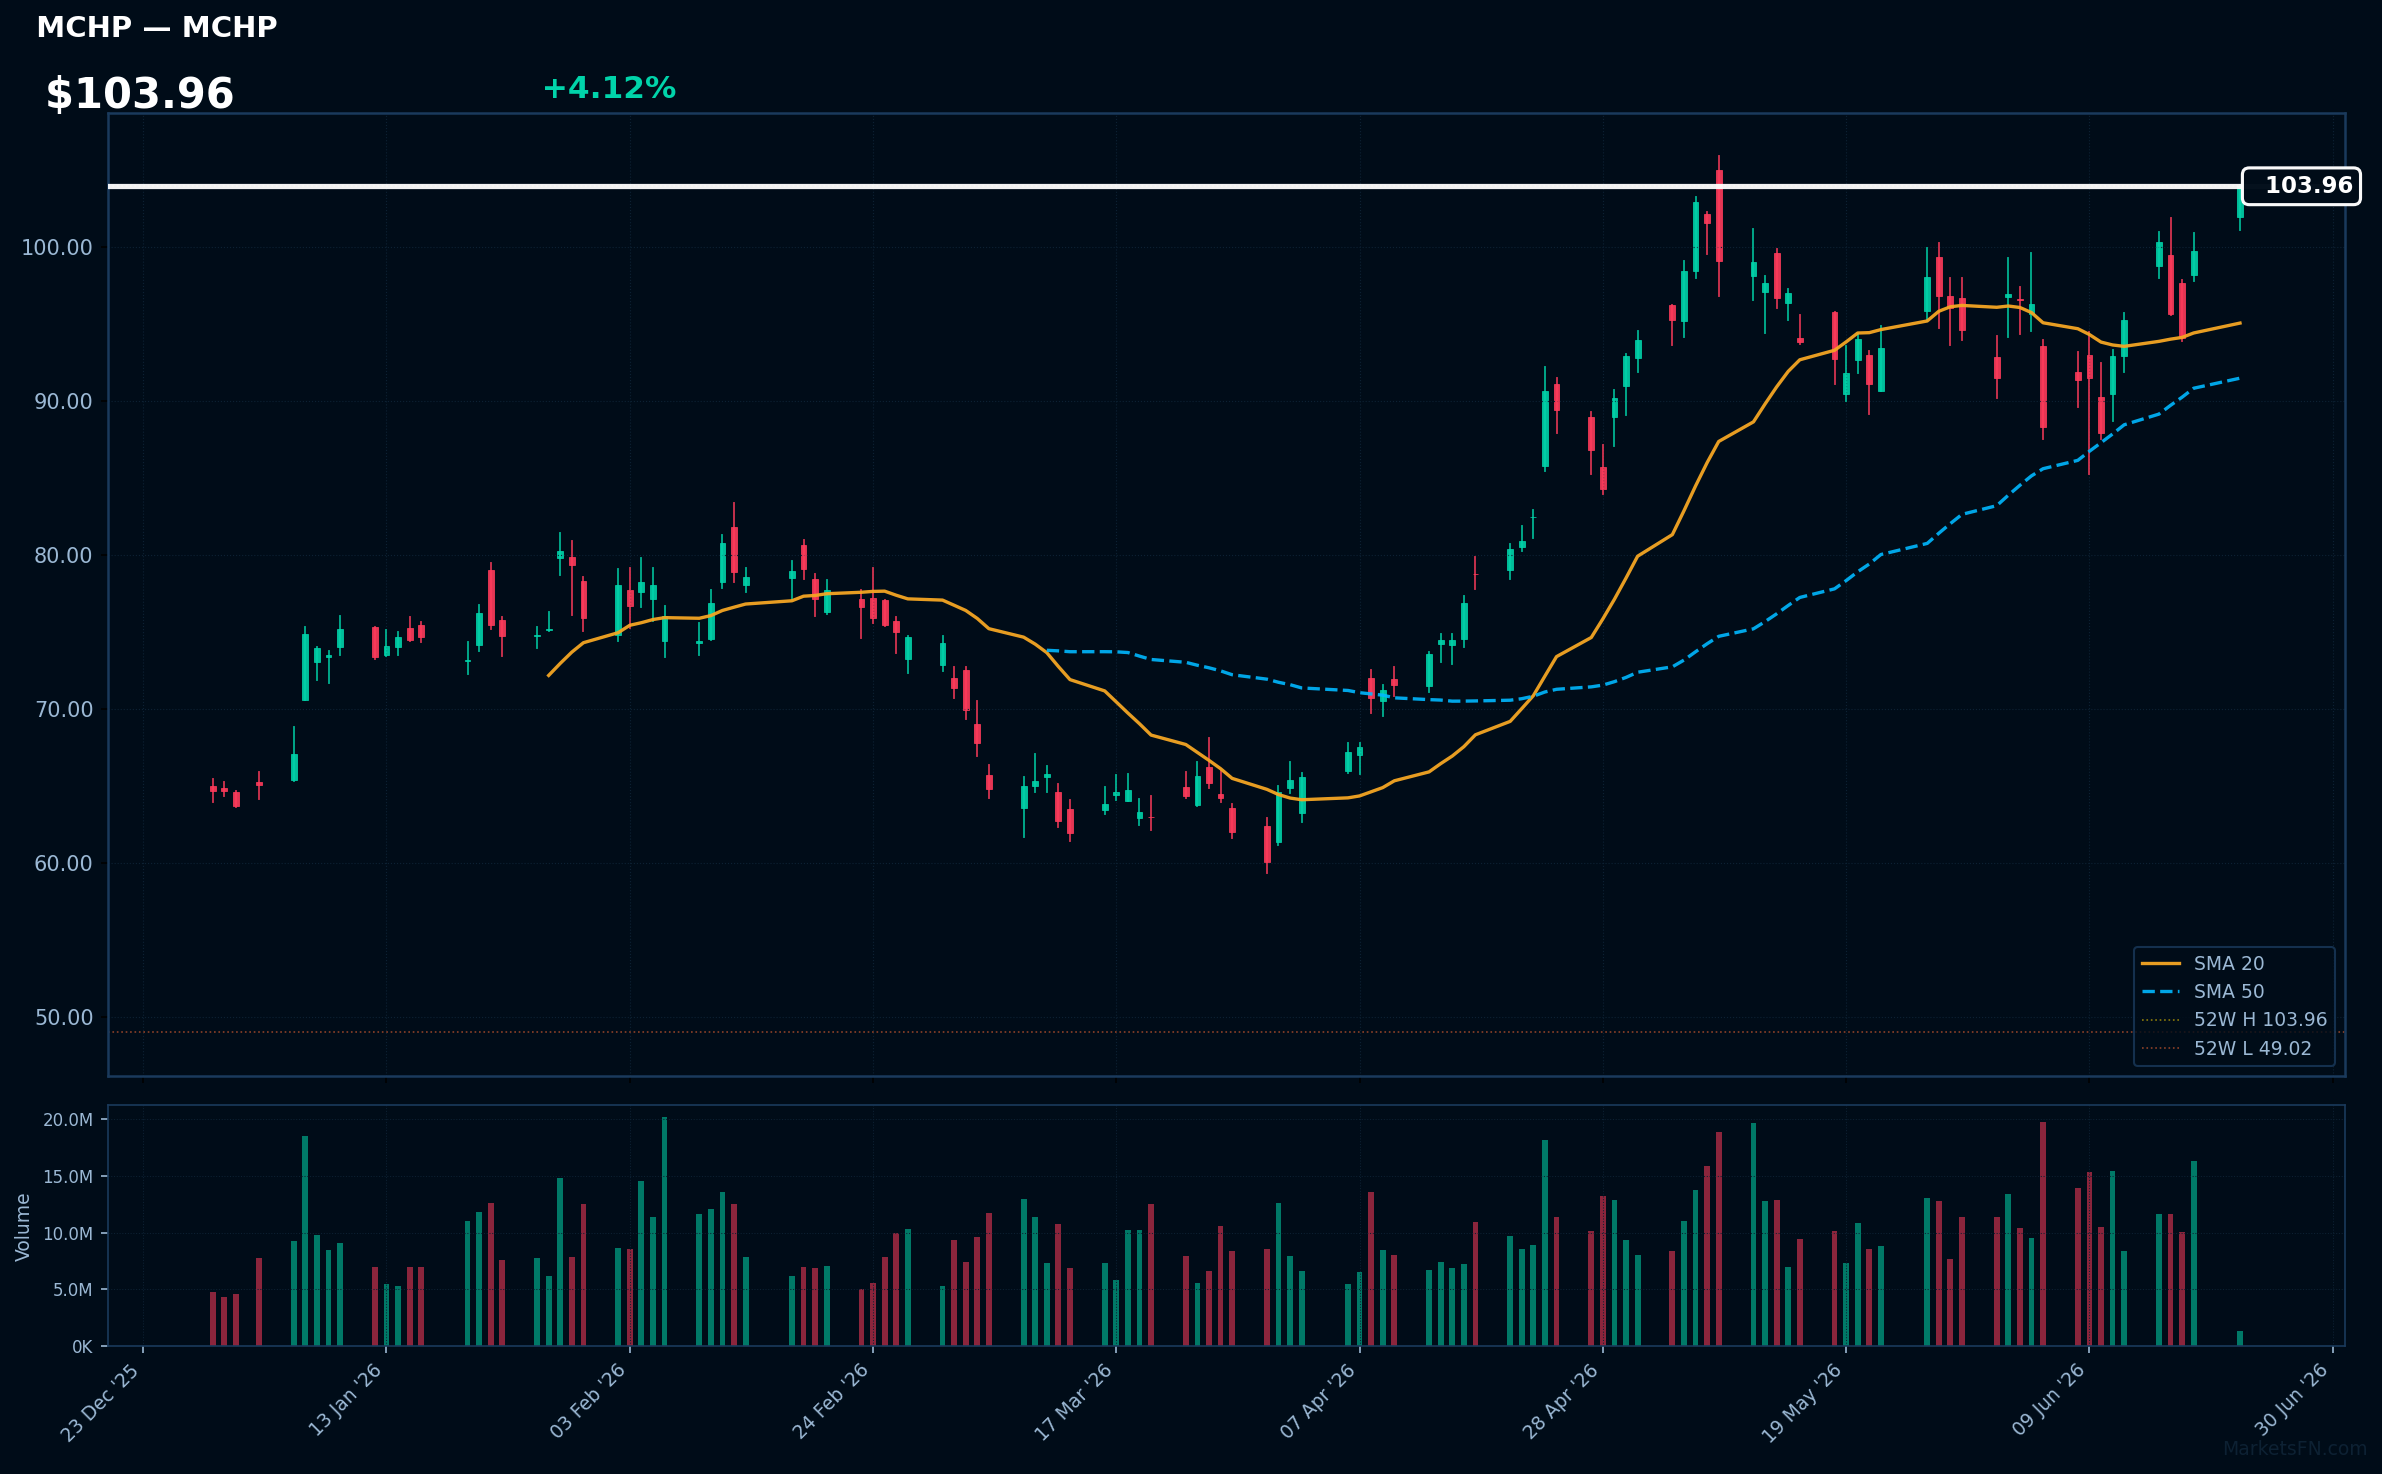
MCHP | Microchip Technology, Inc | Technology | Price: $103.88 | Day: +4.12% | 1W: +9.16% | 1M: +10.57% | RSI: 62.1 | vs MA200: +42.8% | Trend: Above MA20, MA50, MA200
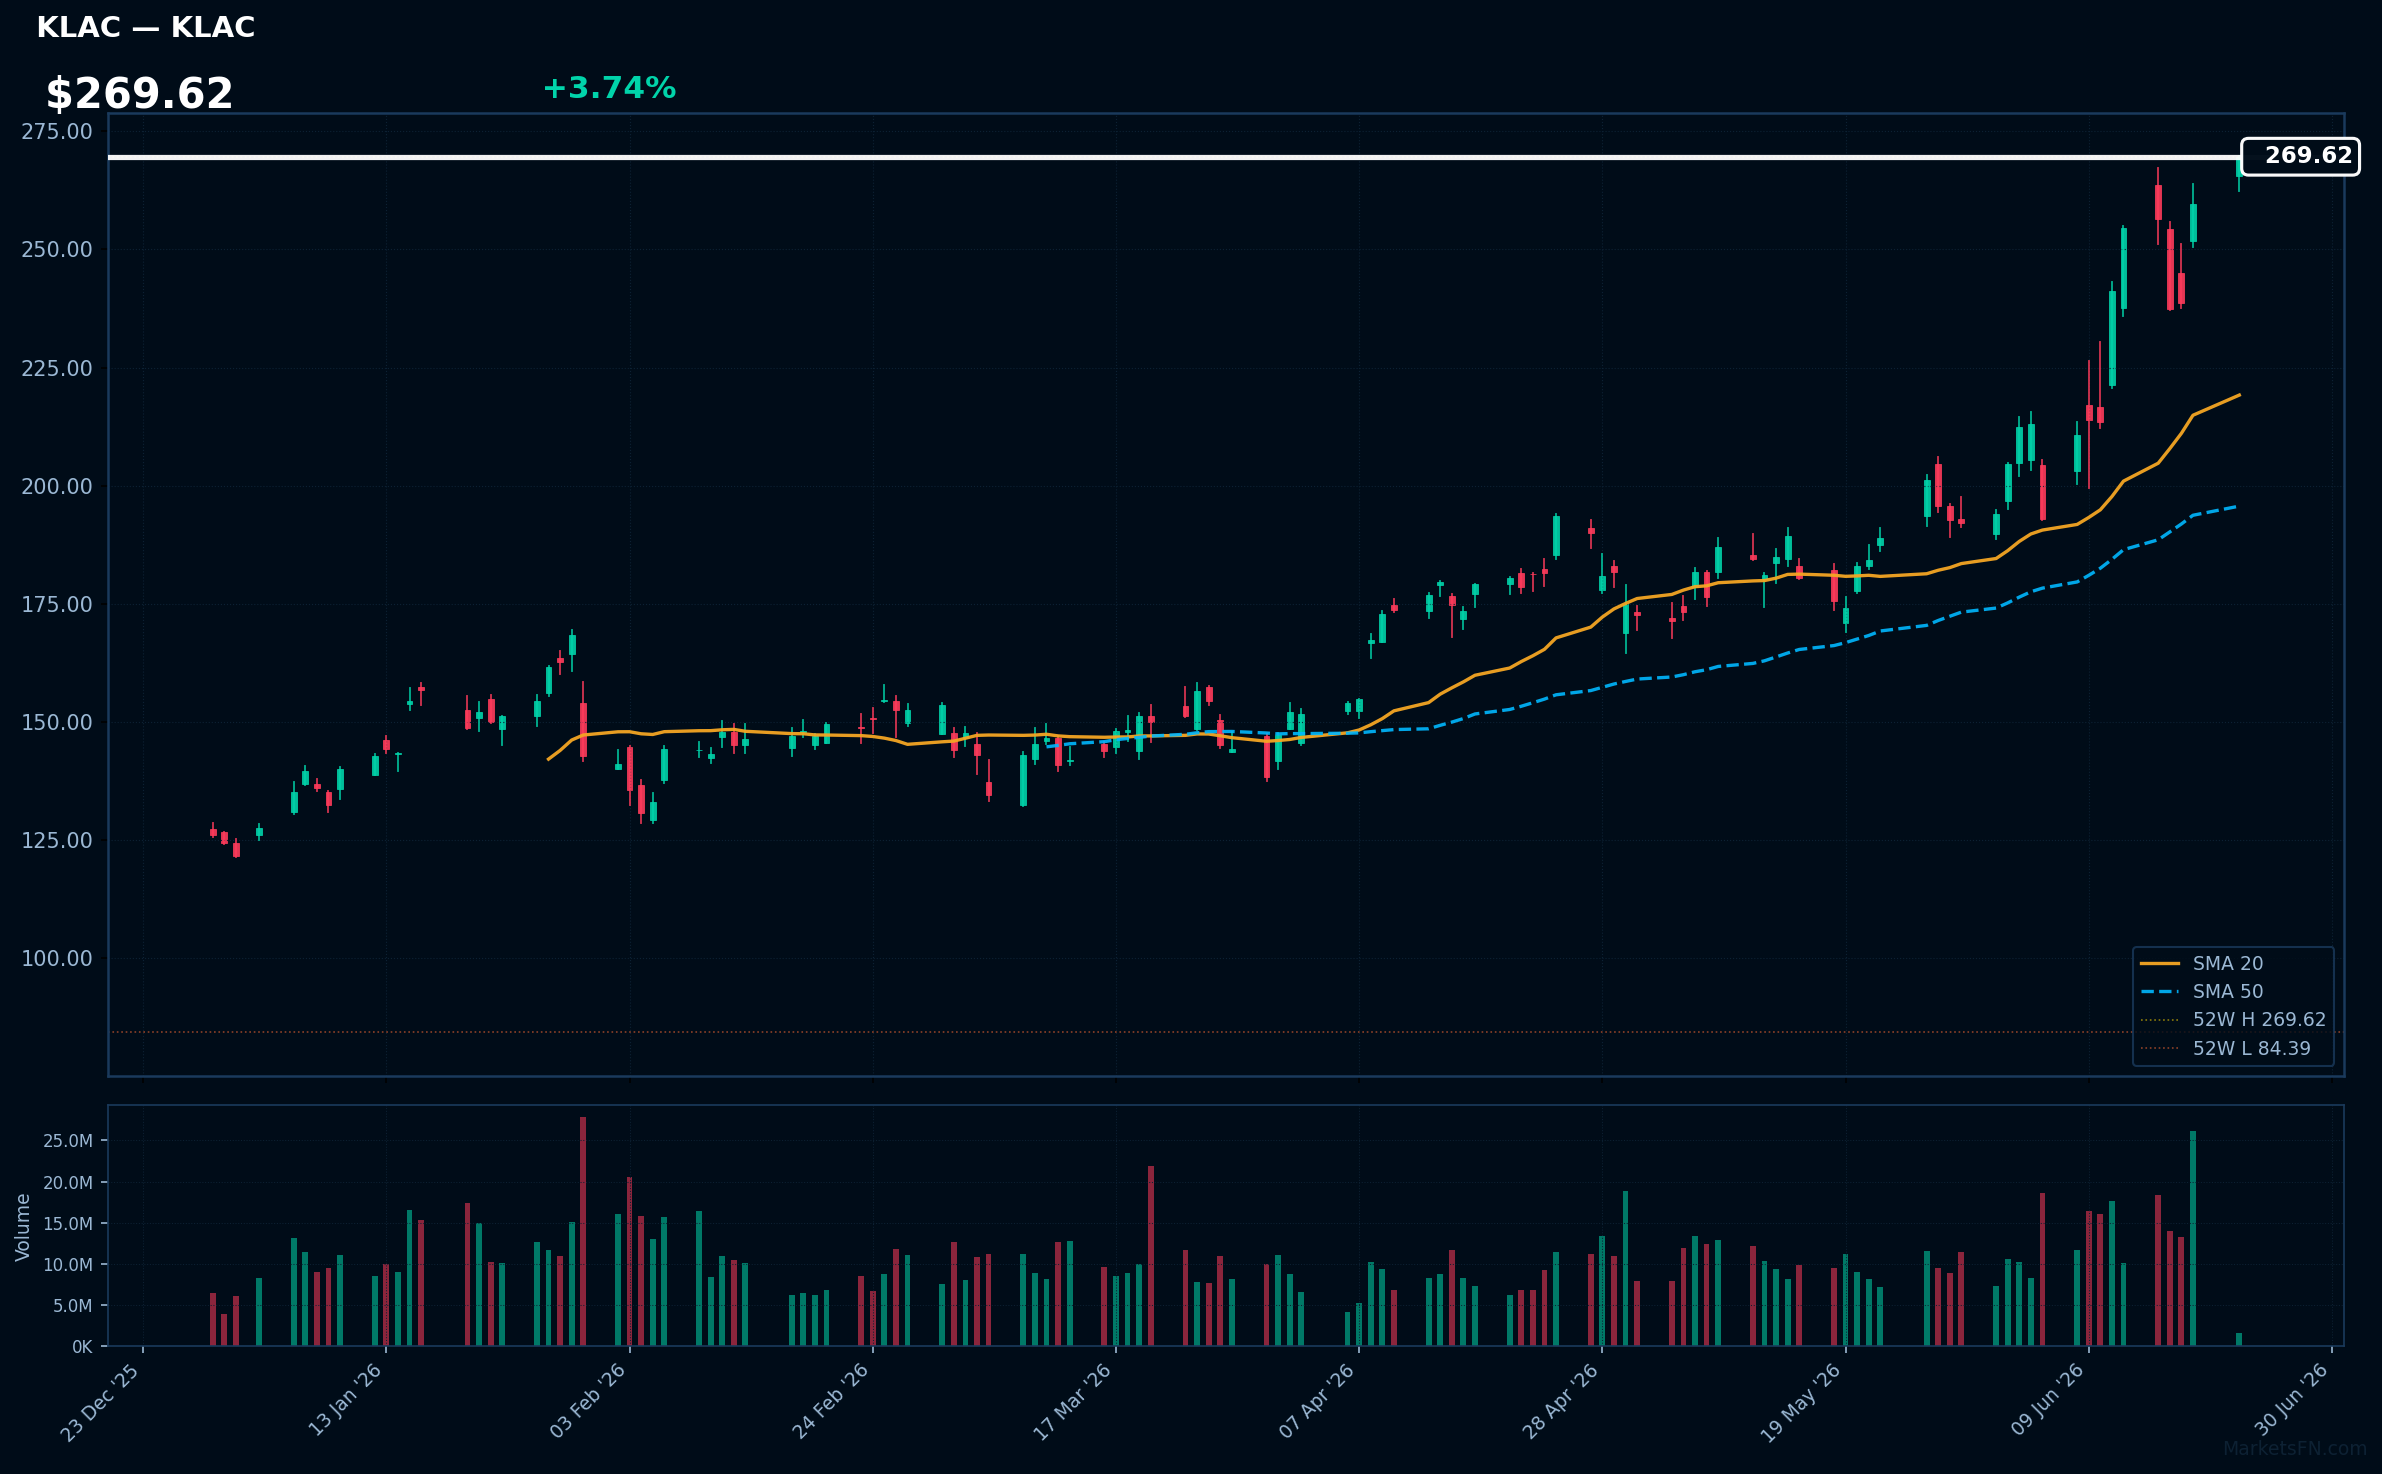
KLAC | KLA Corp | Technology | Price: $269.27 | Day: +3.74% | 1W: +5.93% | 1M: +47.38% | RSI: 72.6 | vs MA200: +85.3% | Trend: Above MA20, MA50, MA200
Recent headlines (last 12h)
- Chipmaking tool firm Nearfield Instruments raises $380 million at $1.6 billion valuation
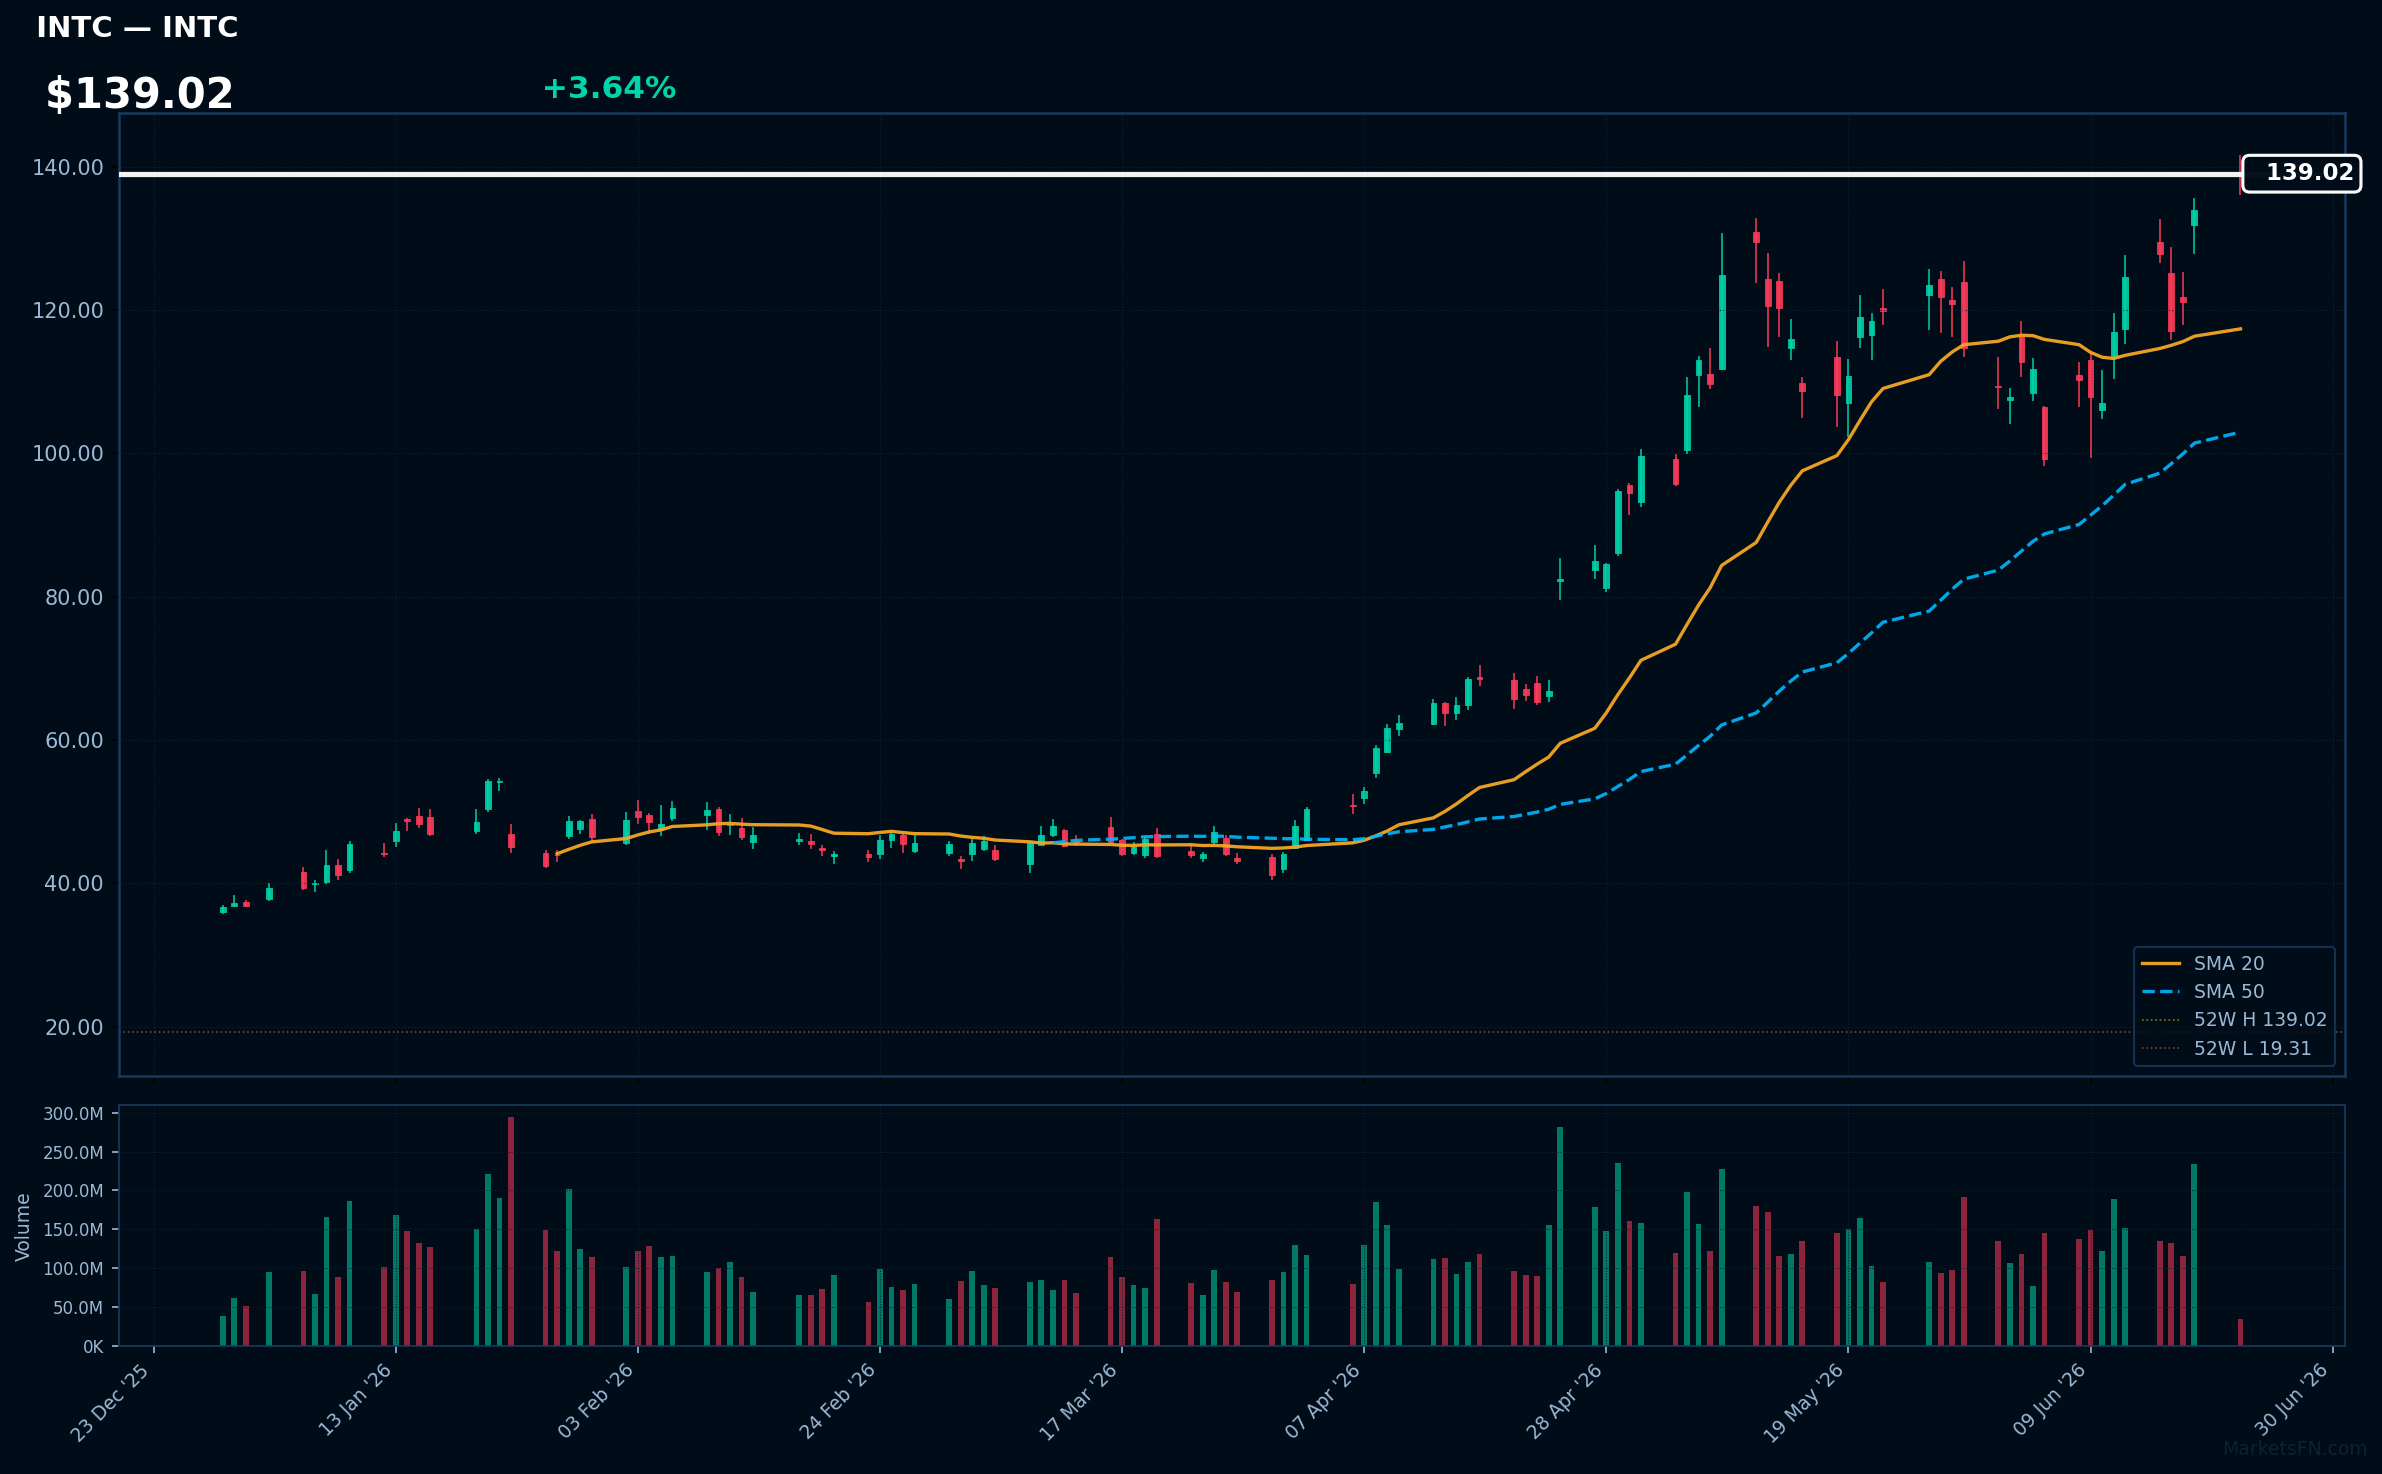
INTC | Intel Corp | Technology | Price: $138.86 | Day: +3.64% | 1W: +11.60% | 1M: +16.86% | RSI: 66.5 | vs MA200: +147.6% | Trend: Above MA20, MA50, MA200
Recent headlines (last 12h)
- AMD's Rally Has Wall Street Paying Attention
- Intel Extends Its Rally
- Intel, Micron, SpaceX, Apogee Therapeutics, and More Stocks That Explain Today's Market
- Nasdaq, S&P 500, Dow Futures Mixed As Hormuz Tensions Ease, China Tightens Export Curbs: Why SPCX, MU, INTC, SLS, MLTX, GETY Are In Focus
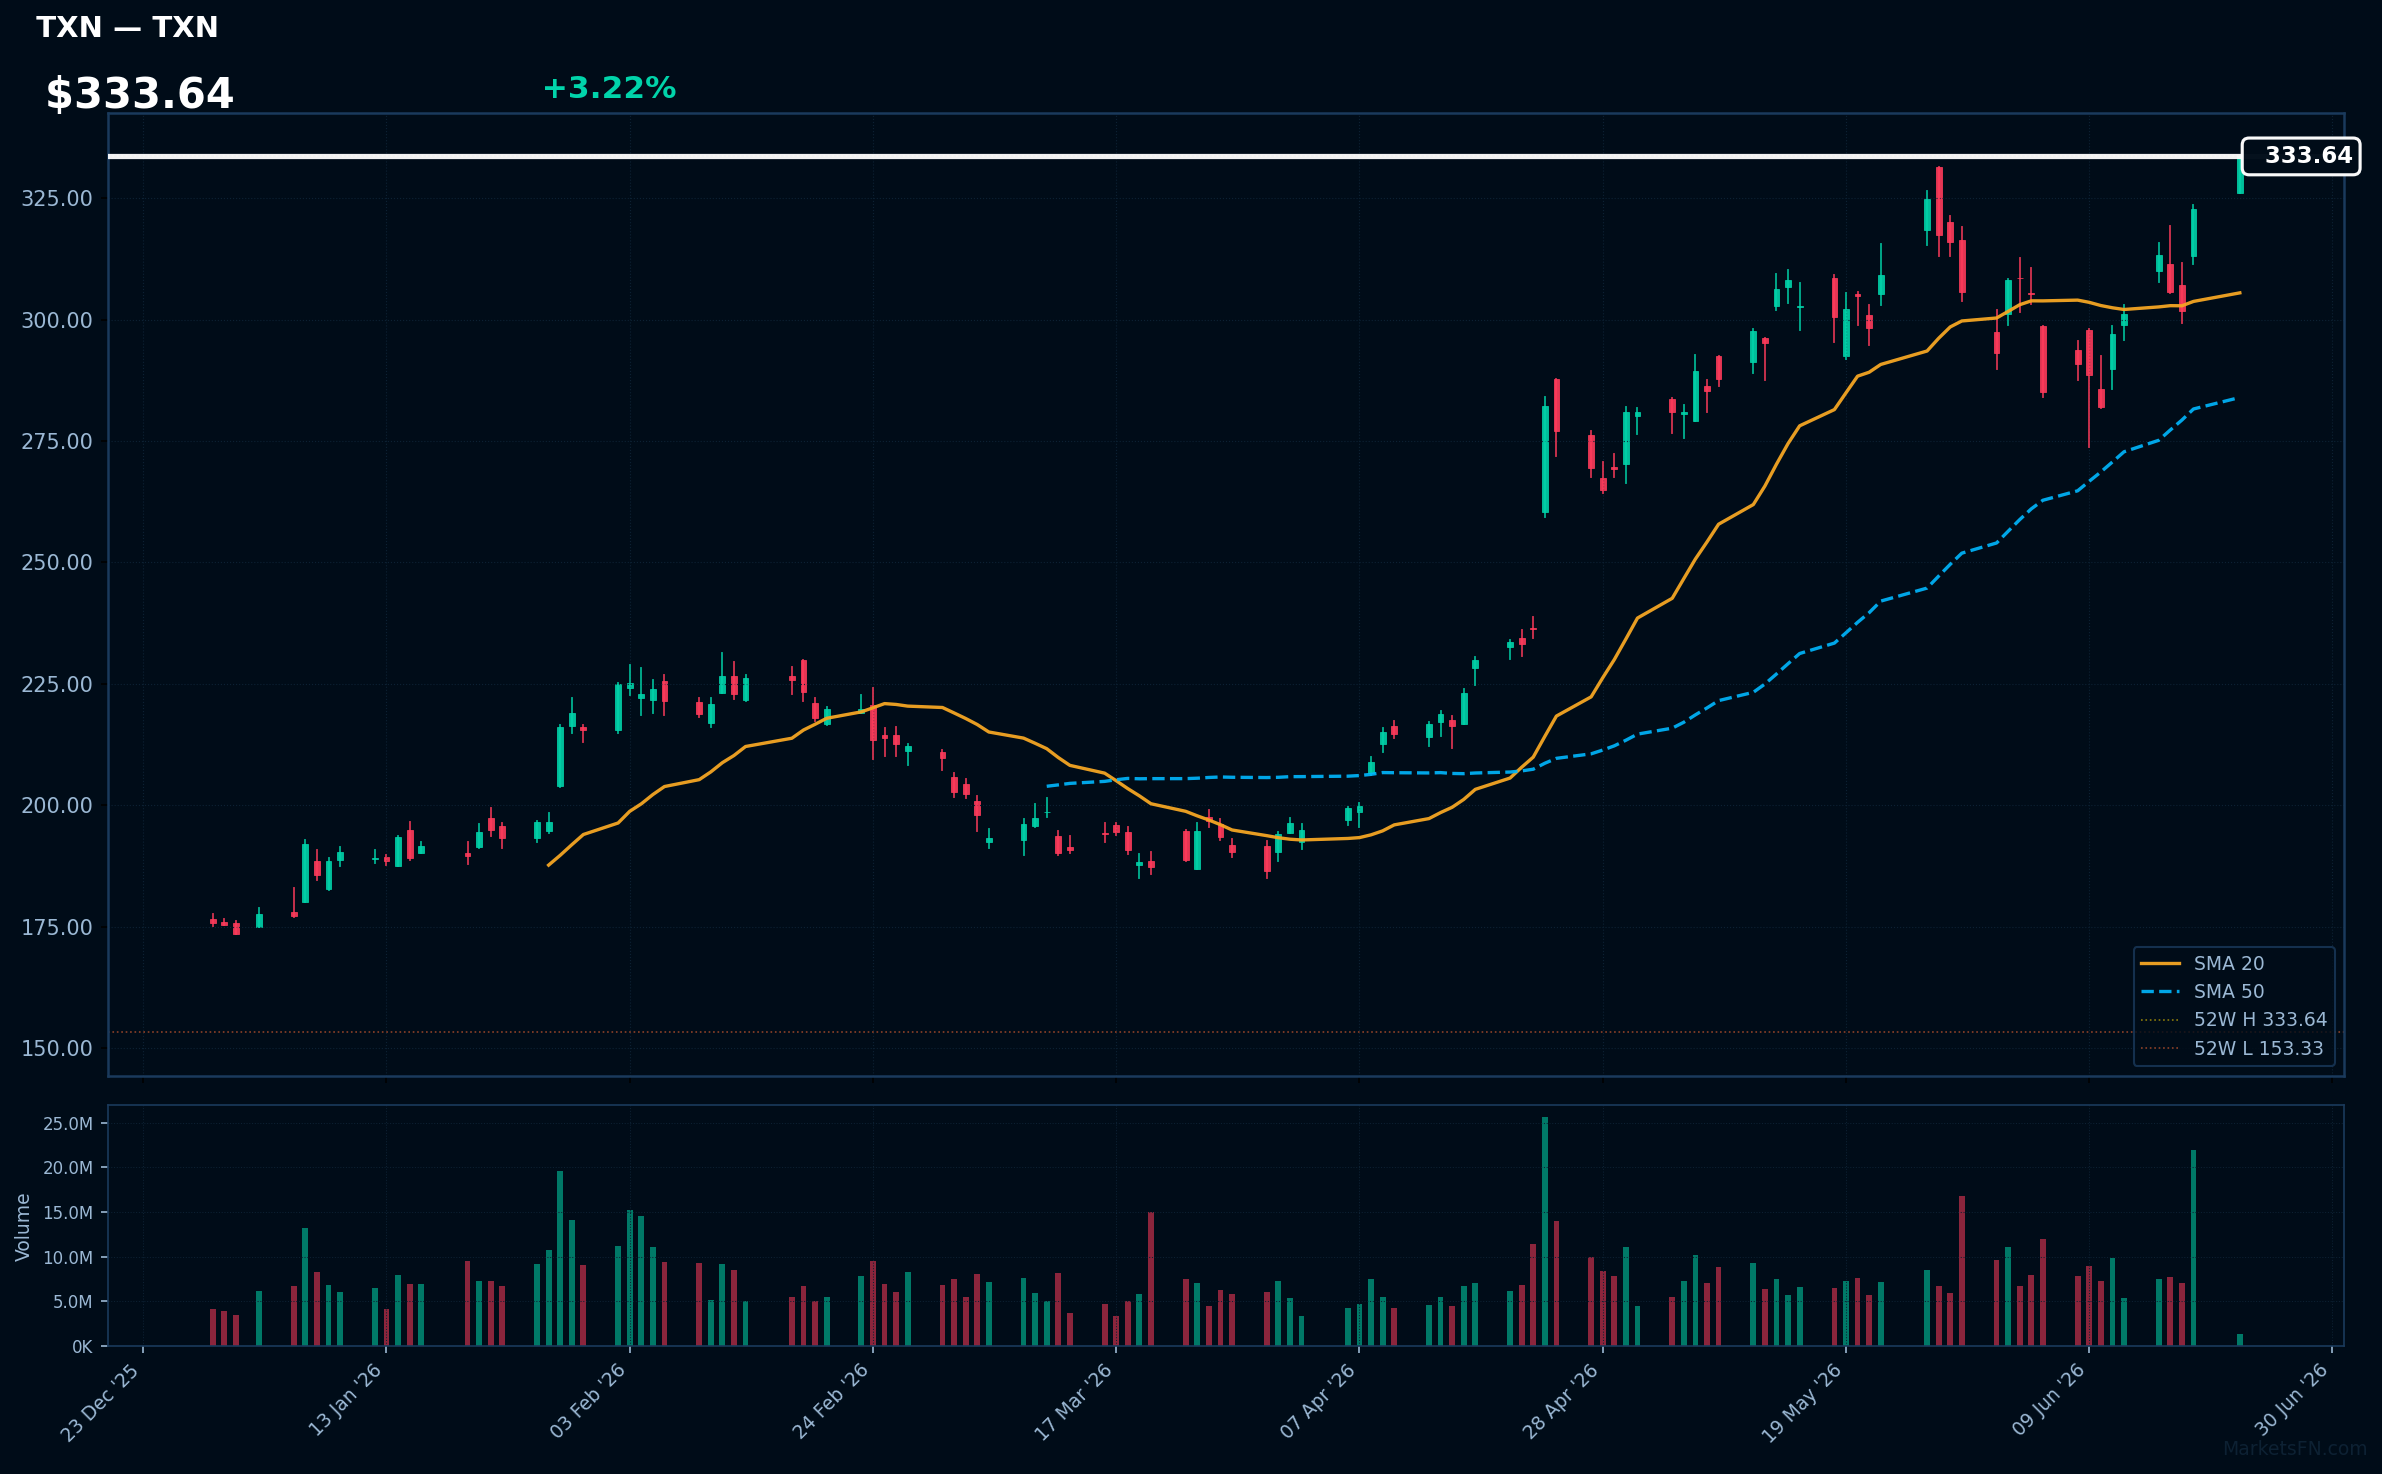
TXN | Texas Instruments Inc | Technology | Price: $333.26 | Day: +3.22% | 1W: +10.80% | 1M: +9.43% | RSI: 65.4 | vs MA200: +58.0% | Trend: Above MA20, MA50, MA200
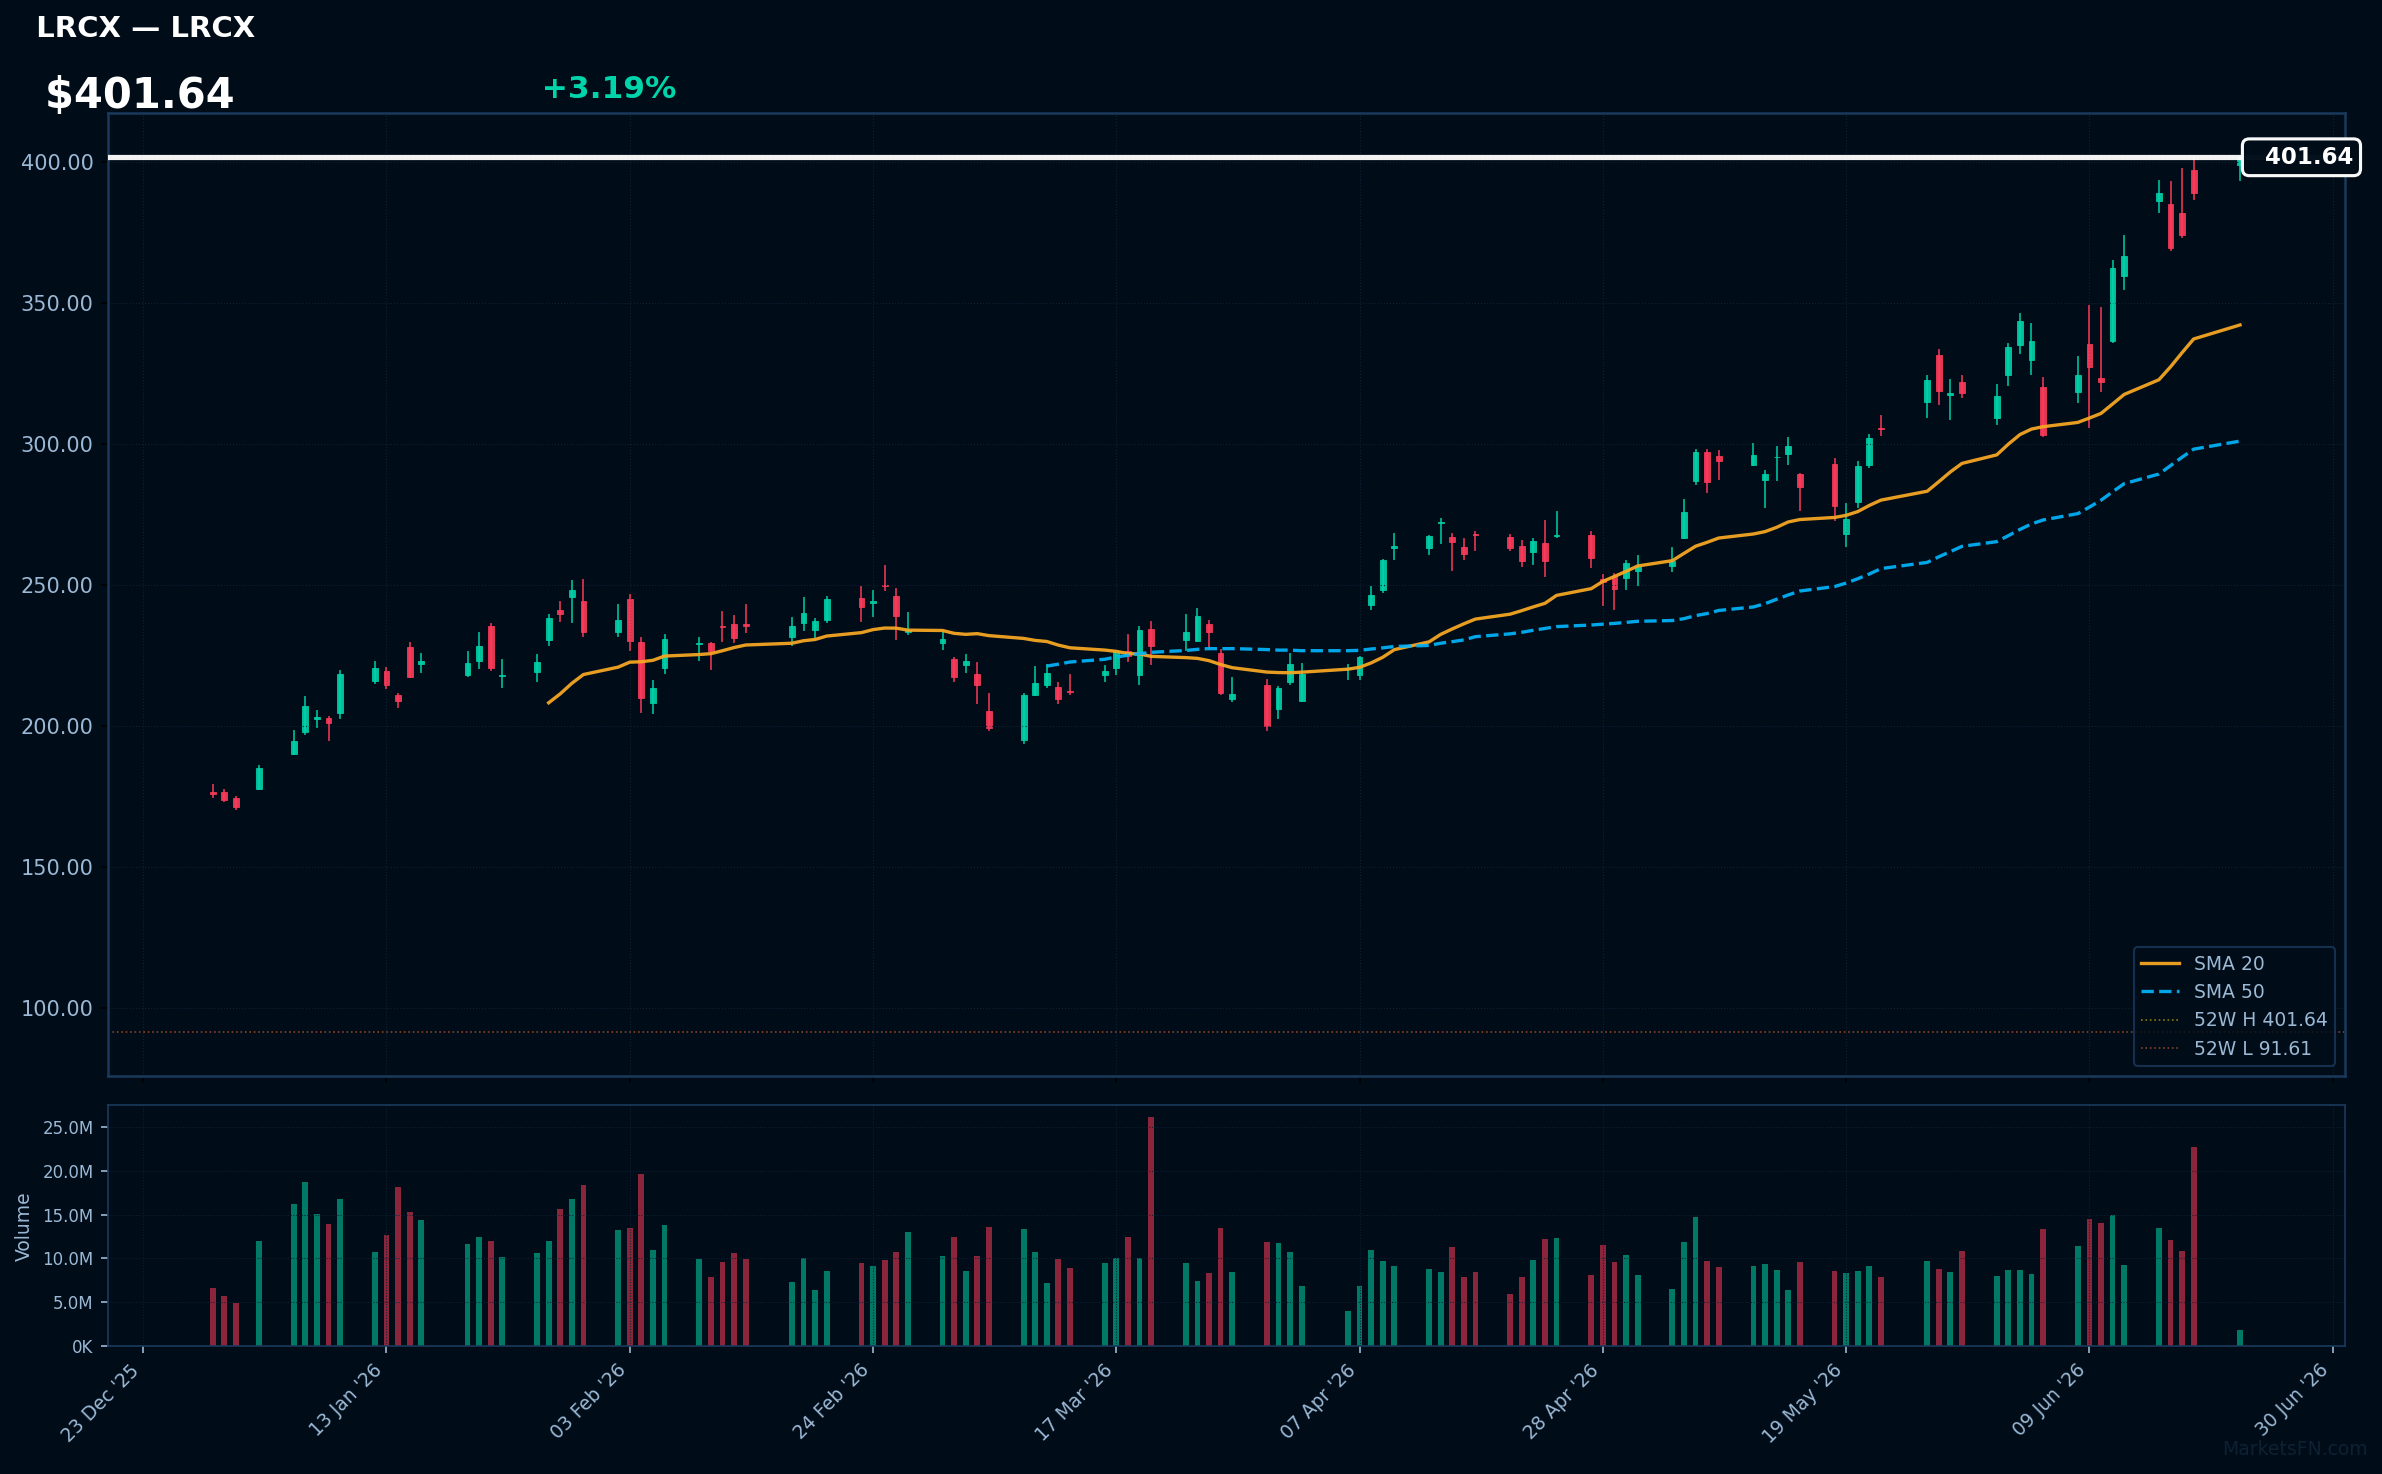
LRCX | Lam Research Corp | Technology | Price: $401.45 | Day: +3.19% | 1W: +9.50% | 1M: +37.51% | RSI: 70.9 | vs MA200: +89.7% | Trend: Above MA20, MA50, MA200
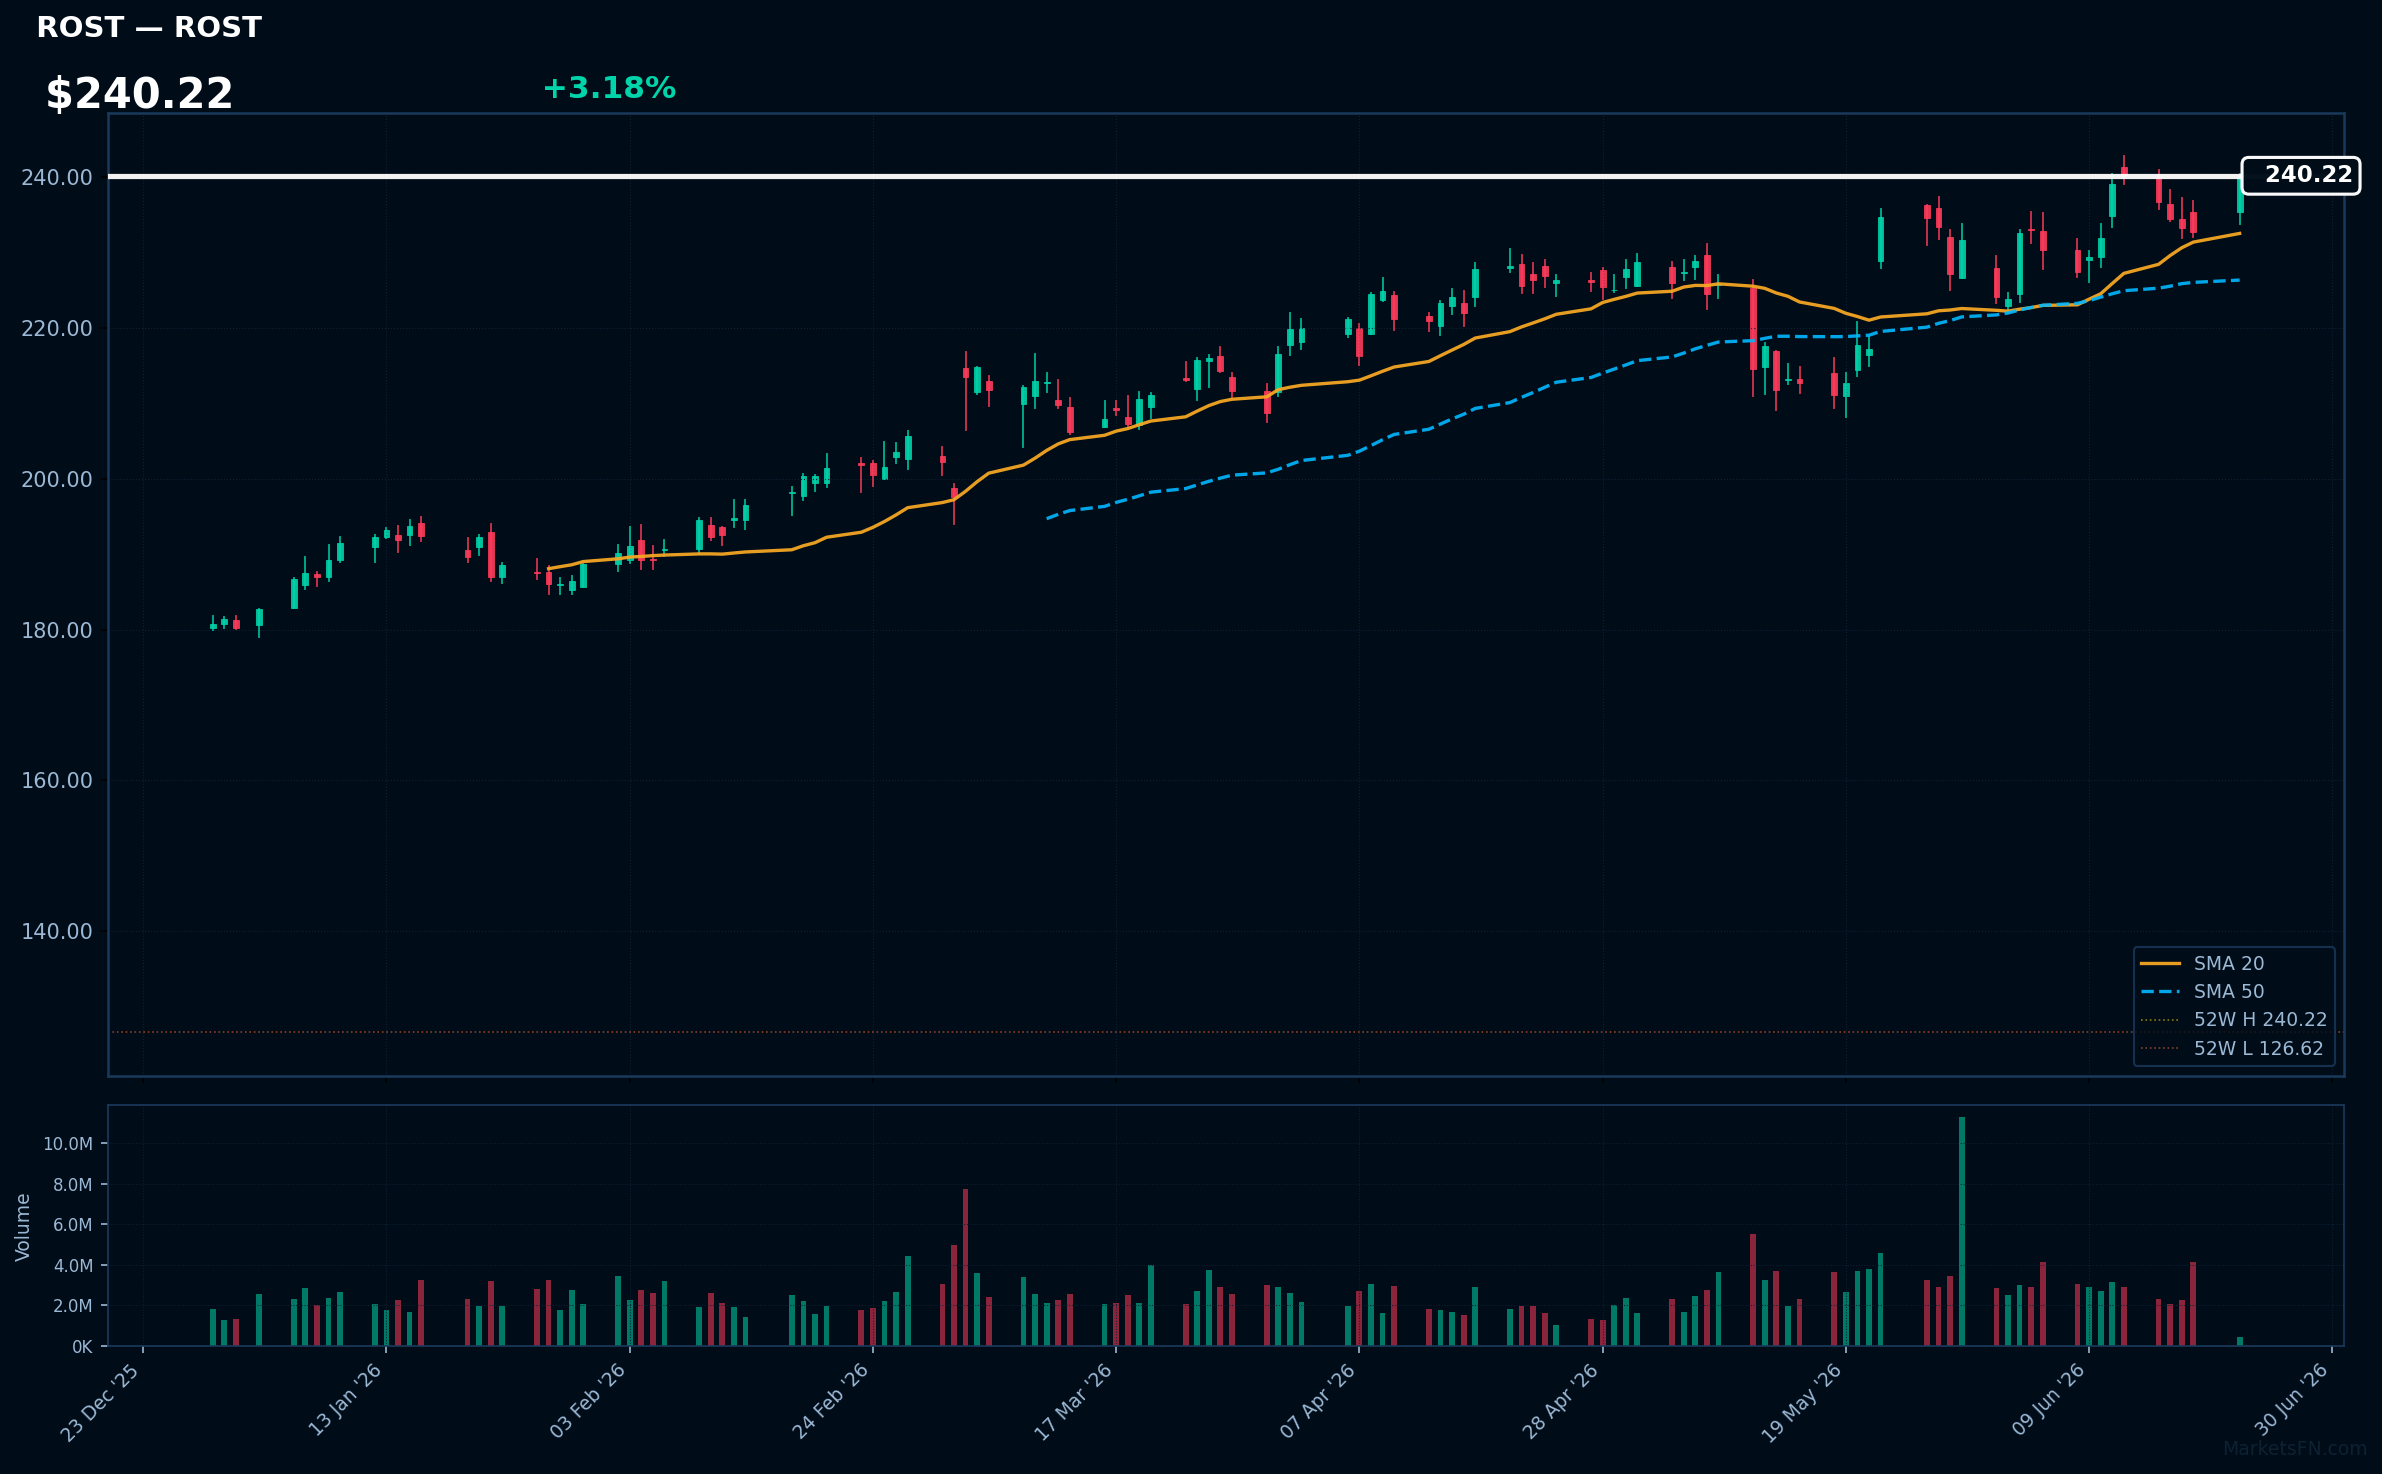
ROST | Ross Stores, Inc | Consumer Cyclical | Price: $240.20 | Day: +3.18% | 1W: +0.04% | 1M: +10.30% | RSI: 61.5 | vs MA200: +25.4% | Trend: Above MA20, MA50, MA200
Top 10 Losers
Today's weakest Nasdaq 100 performers. Sector drag: Consumer Cyclical (3), Communication Services (3), Technology (2), Industrials (1), Healthcare (1).
| Ticker | Company | Sector | Price | Day % | 1W % | 1M % | RSI | vs MA200 | Trend |
|---|---|---|---|---|---|---|---|---|---|
| ORLY | O'Reilly Automotive, Inc | Consumer Cyclical | $85.07 | -2.04% | -6.54% | -7.75% | 34.7 | -10.9% | Below MA20, MA50, MA200 |
| NFLX | Netflix Inc | Communication Services | $75.53 | -2.40% | -5.99% | -14.26% | 24.9 | -23.0% | Below MA20, MA50, MA200 |
| AVGO | Broadcom Inc | Technology | $399.91 | -2.78% | +4.67% | -4.27% | 48.2 | +11.0% | Above MA200 · Below MA20, MA50 |
| AXON | Axon Enterprise Inc | Industrials | $411.22 | -2.88% | -6.91% | +3.21% | 42.1 | -24.3% | Below MA20, MA50, MA200 |
| AMZN | Amazon.com Inc | Consumer Cyclical | $237.29 | -2.90% | -0.53% | -10.46% | 39.1 | +1.9% | Above MA200 · Below MA20, MA50 |
| DXCM | Dexcom Inc | Healthcare | $70.27 | -3.04% | -6.77% | -1.64% | 47.8 | +4.1% | Above MA50, MA200 · Below MA20 |
| LULU | Lululemon Athletica inc | Consumer Cyclical | $108.08 | -3.30% | -9.00% | -13.67% | 29.0 | -35.3% | Below MA20, MA50, MA200 |
| ARM | Arm Holdings plc. ADR | Technology | $420.10 | -4.41% | +10.28% | +63.58% | 64.4 | +148.2% | Above MA20, MA50, MA200 |
| GOOGL | Alphabet Inc | Communication Services | $350.77 | -4.69% | -2.49% | -9.82% | 39.4 | +12.5% | Above MA200 · Below MA20, MA50 |
| GOOG | Alphabet Inc | Communication Services | $349.91 | -4.78% | -2.32% | -9.10% | 40.5 | +12.4% | Above MA200 · Below MA20, MA50 |
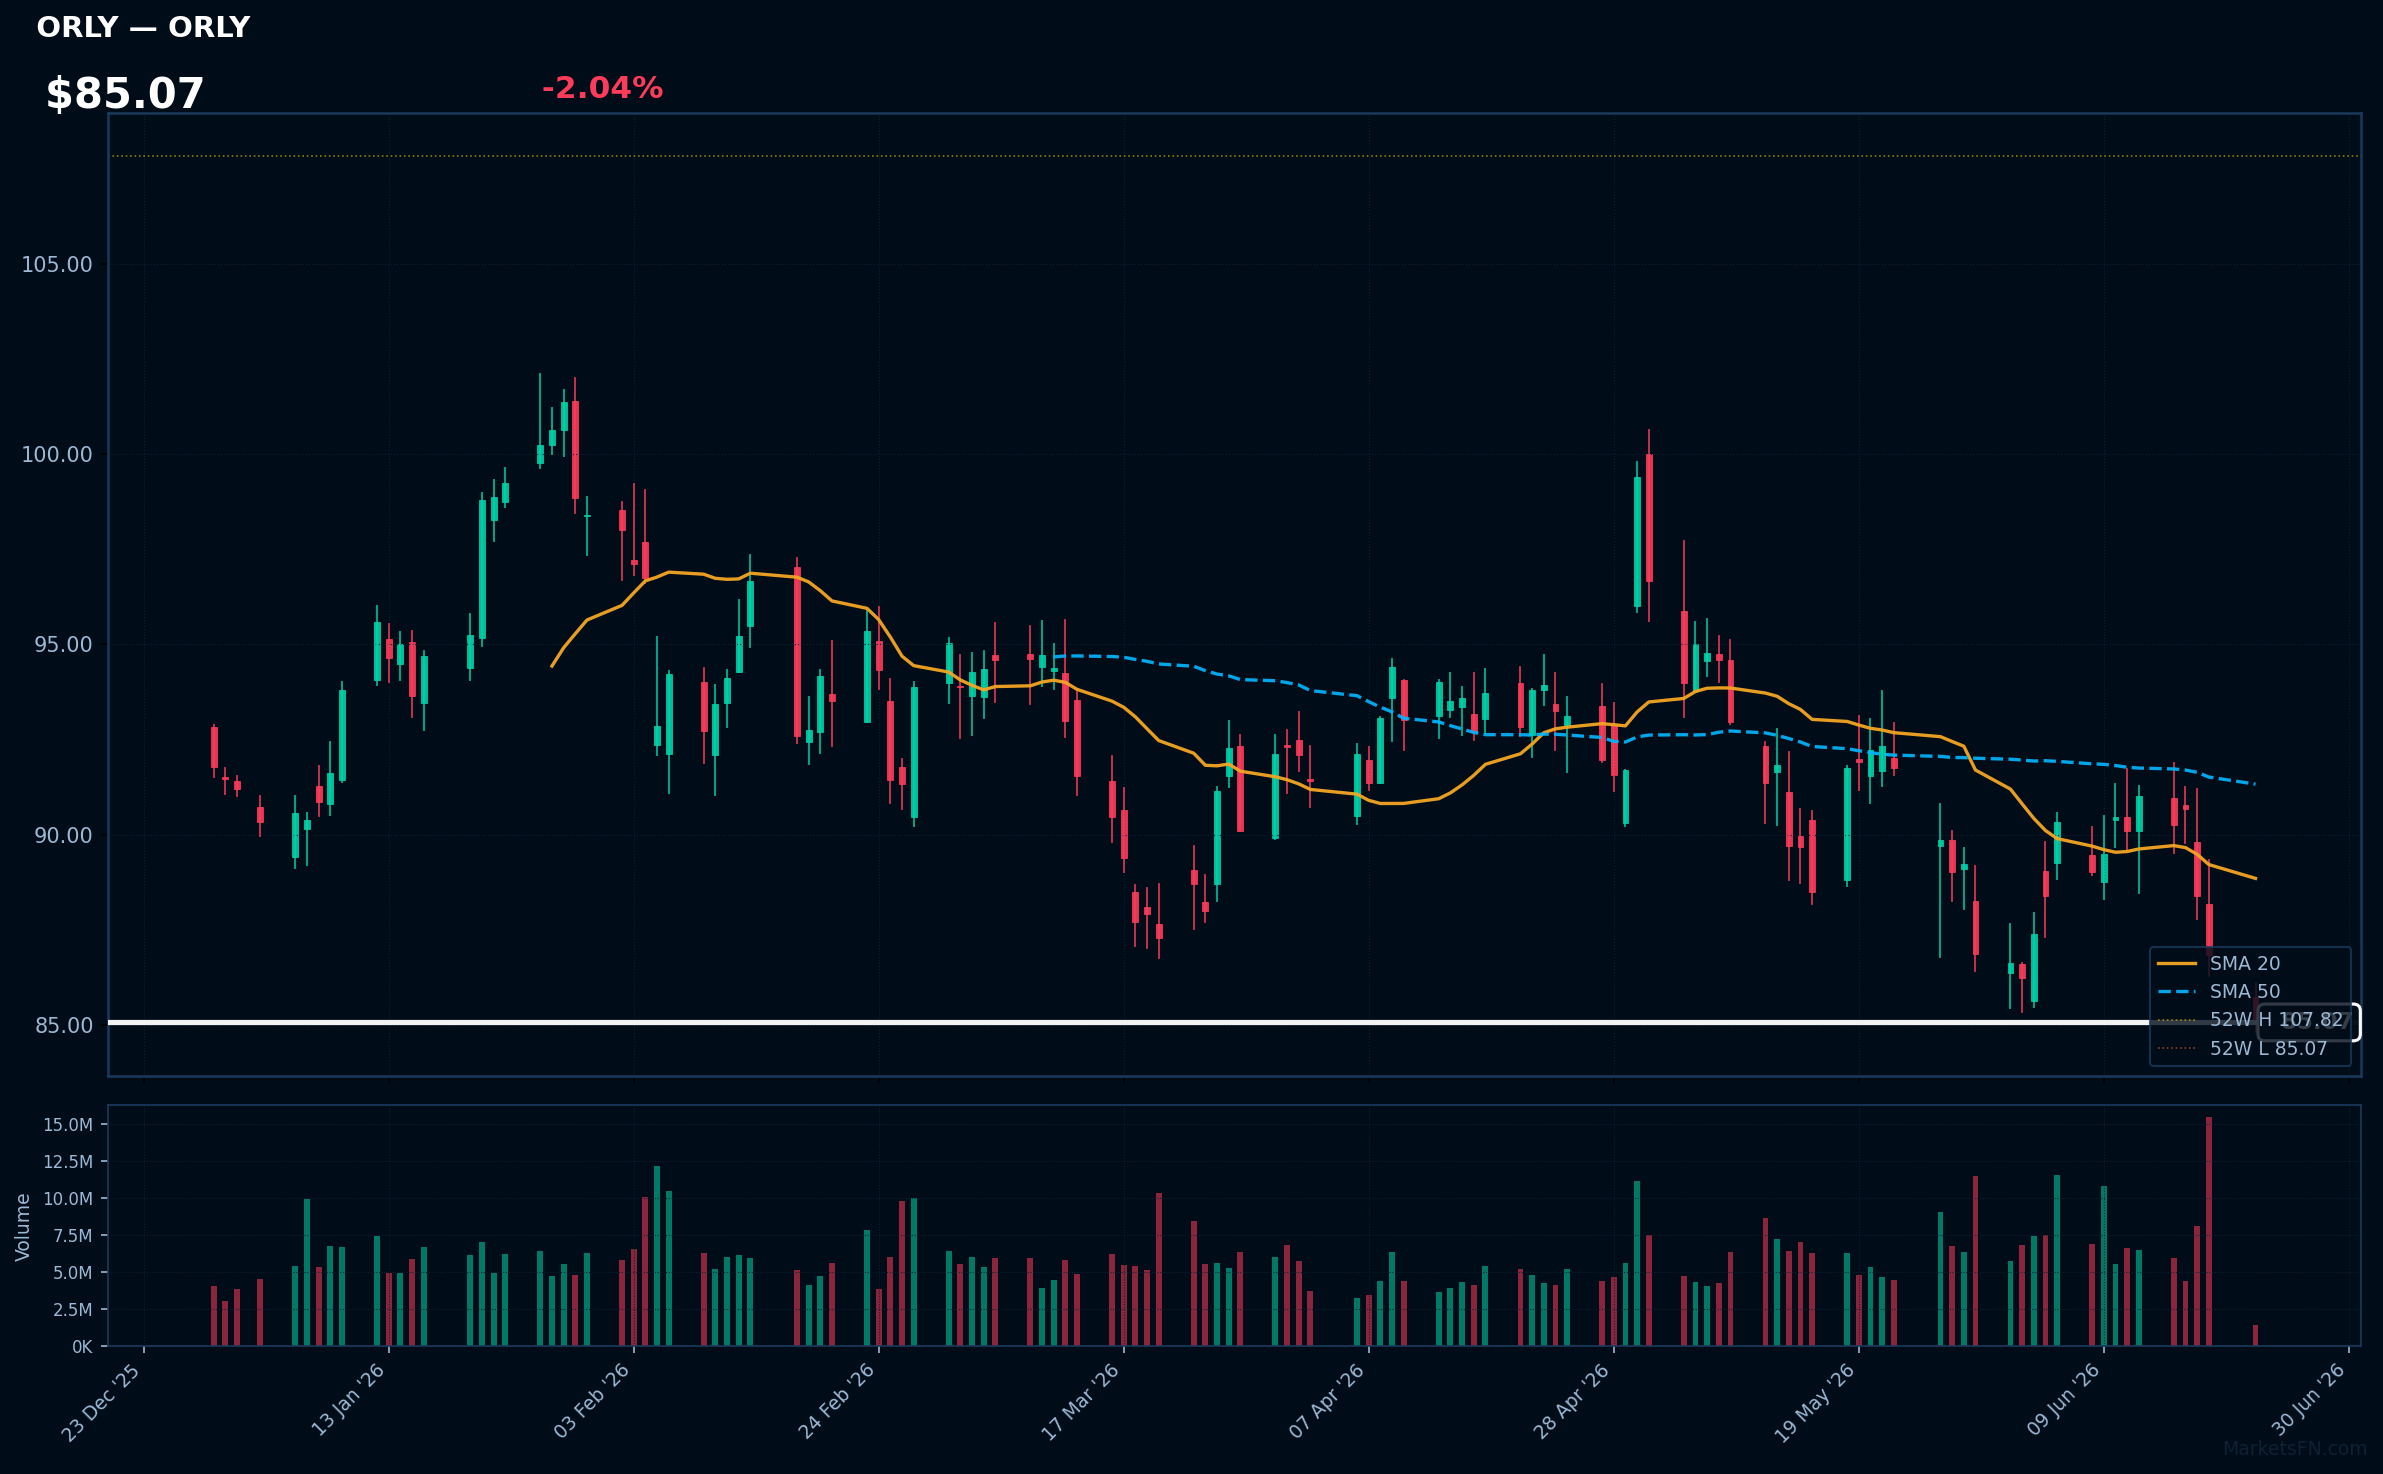
ORLY | O'Reilly Automotive, Inc | Consumer Cyclical | Price: $85.07 | Day: -2.04% | 1W: -6.54% | 1M: -7.75% | RSI: 34.7 | vs MA200: -10.9% | Trend: Below MA20, MA50, MA200
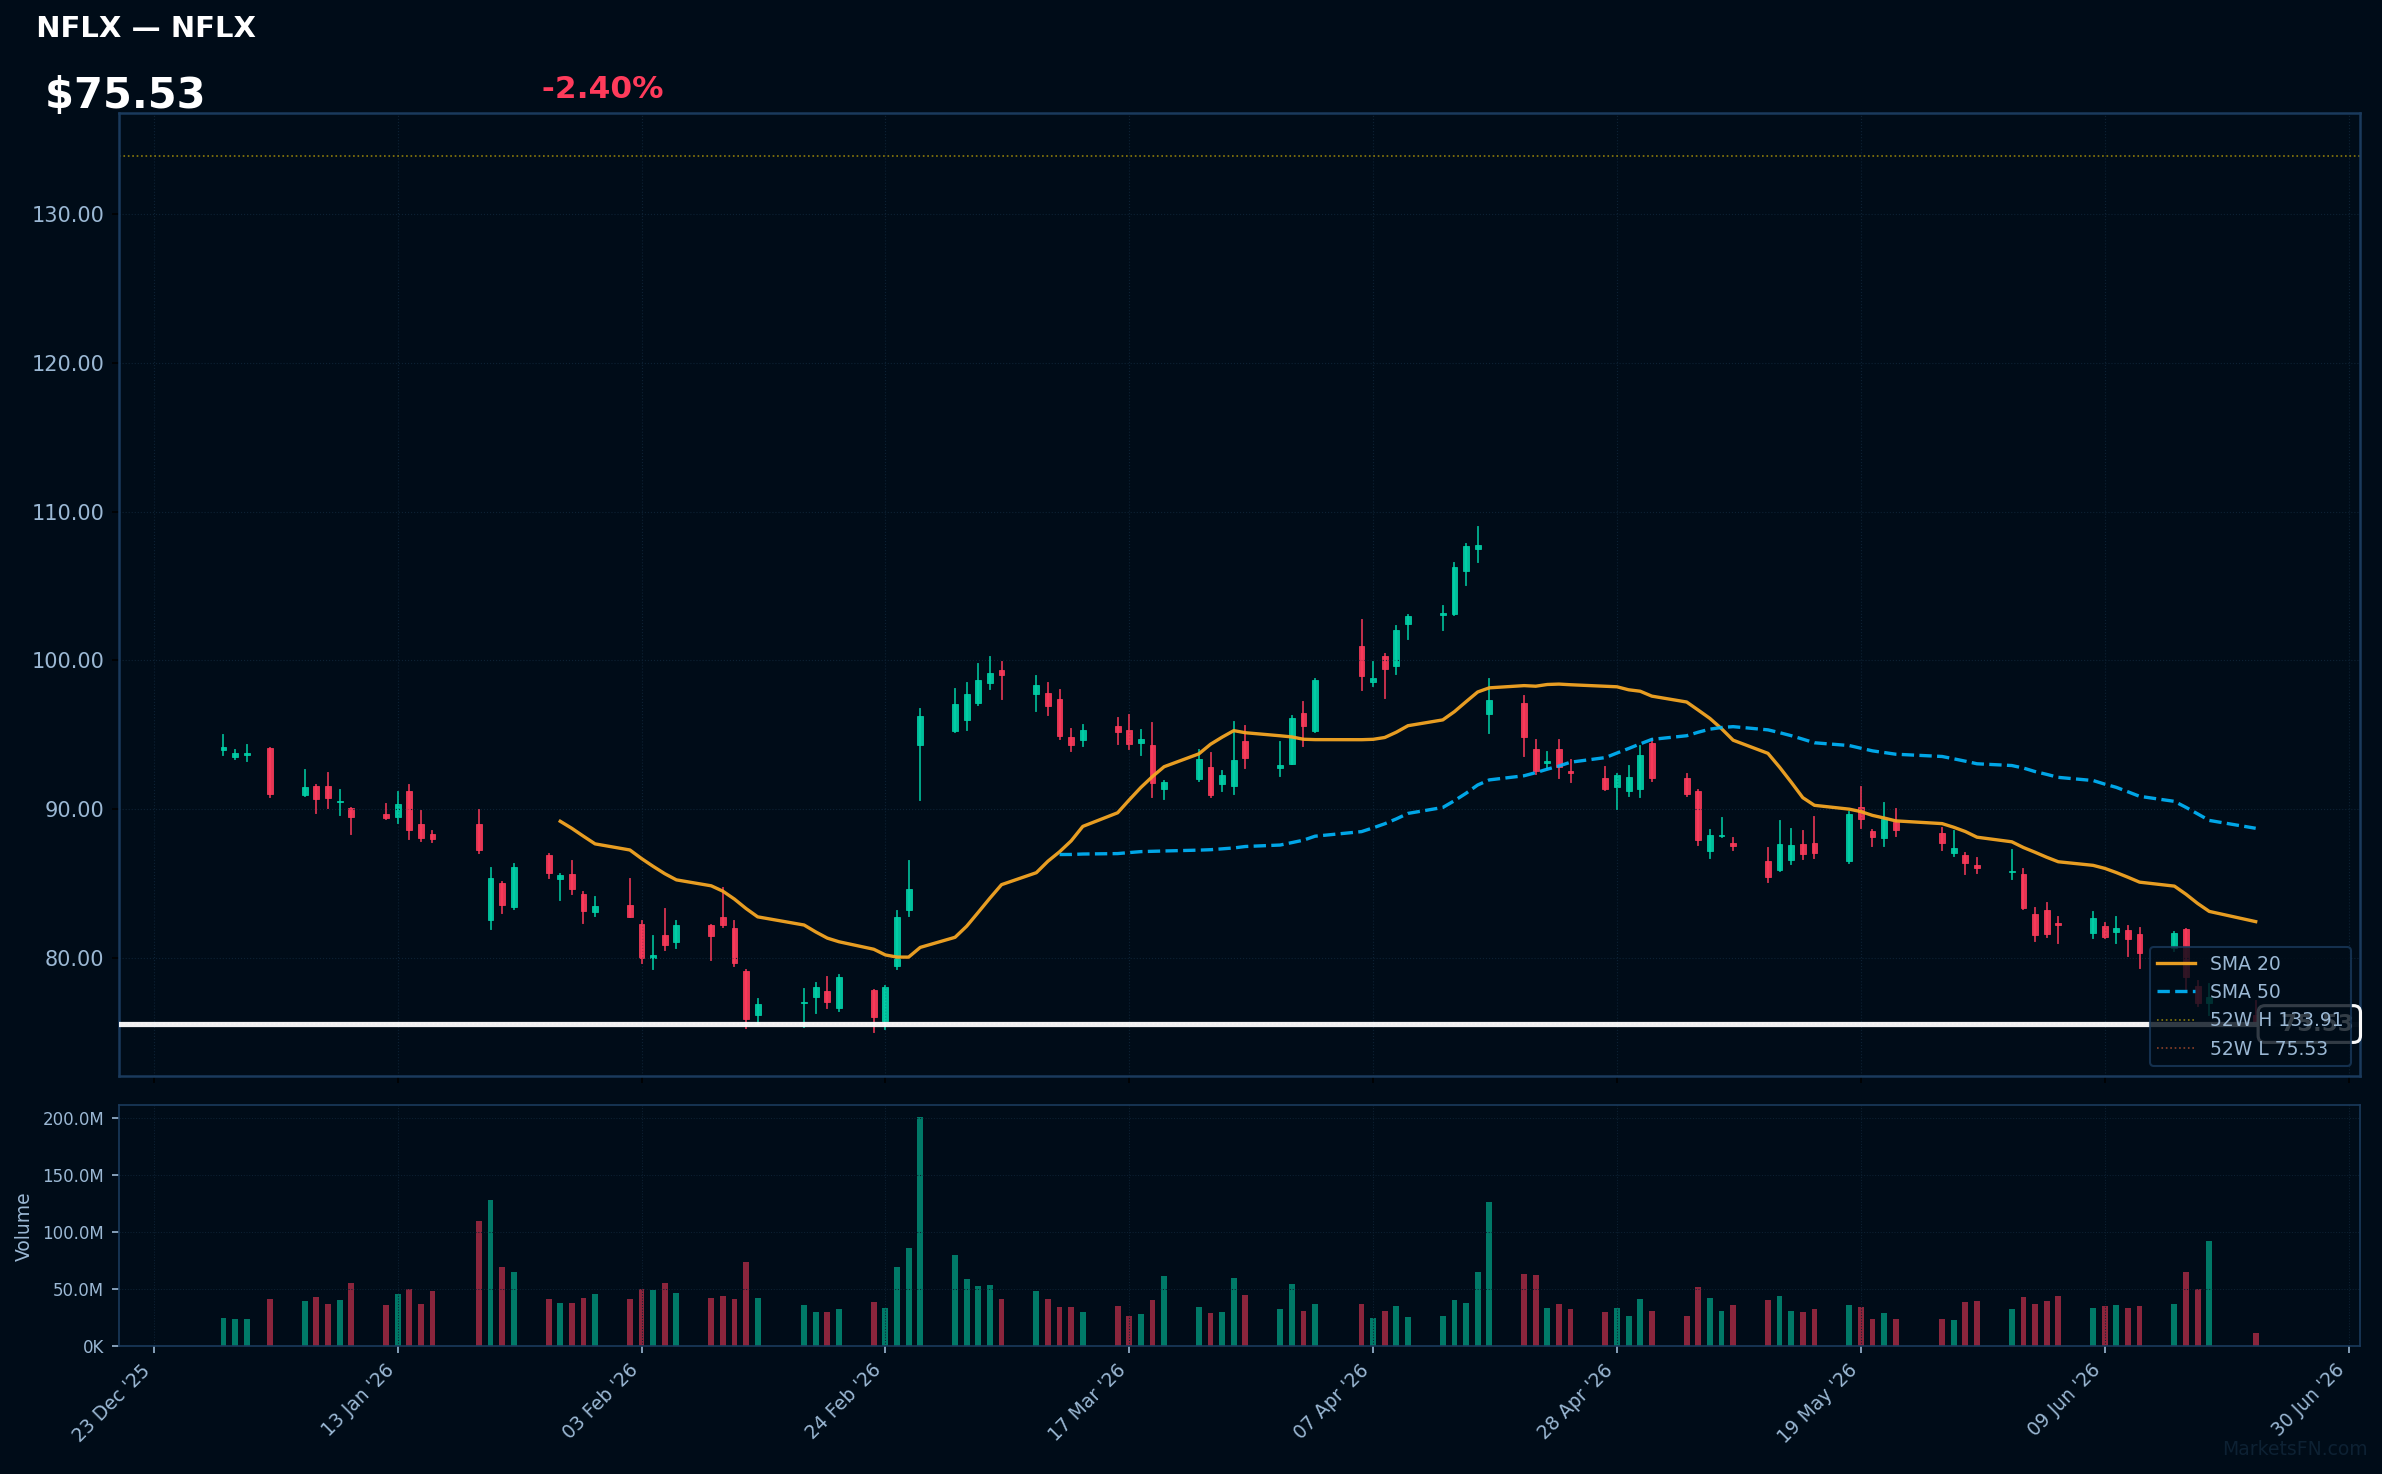
NFLX | Netflix Inc | Communication Services | Price: $75.53 | Day: -2.40% | 1W: -5.99% | 1M: -14.26% | RSI: 24.9 | vs MA200: -23.0% | Trend: Below MA20, MA50, MA200
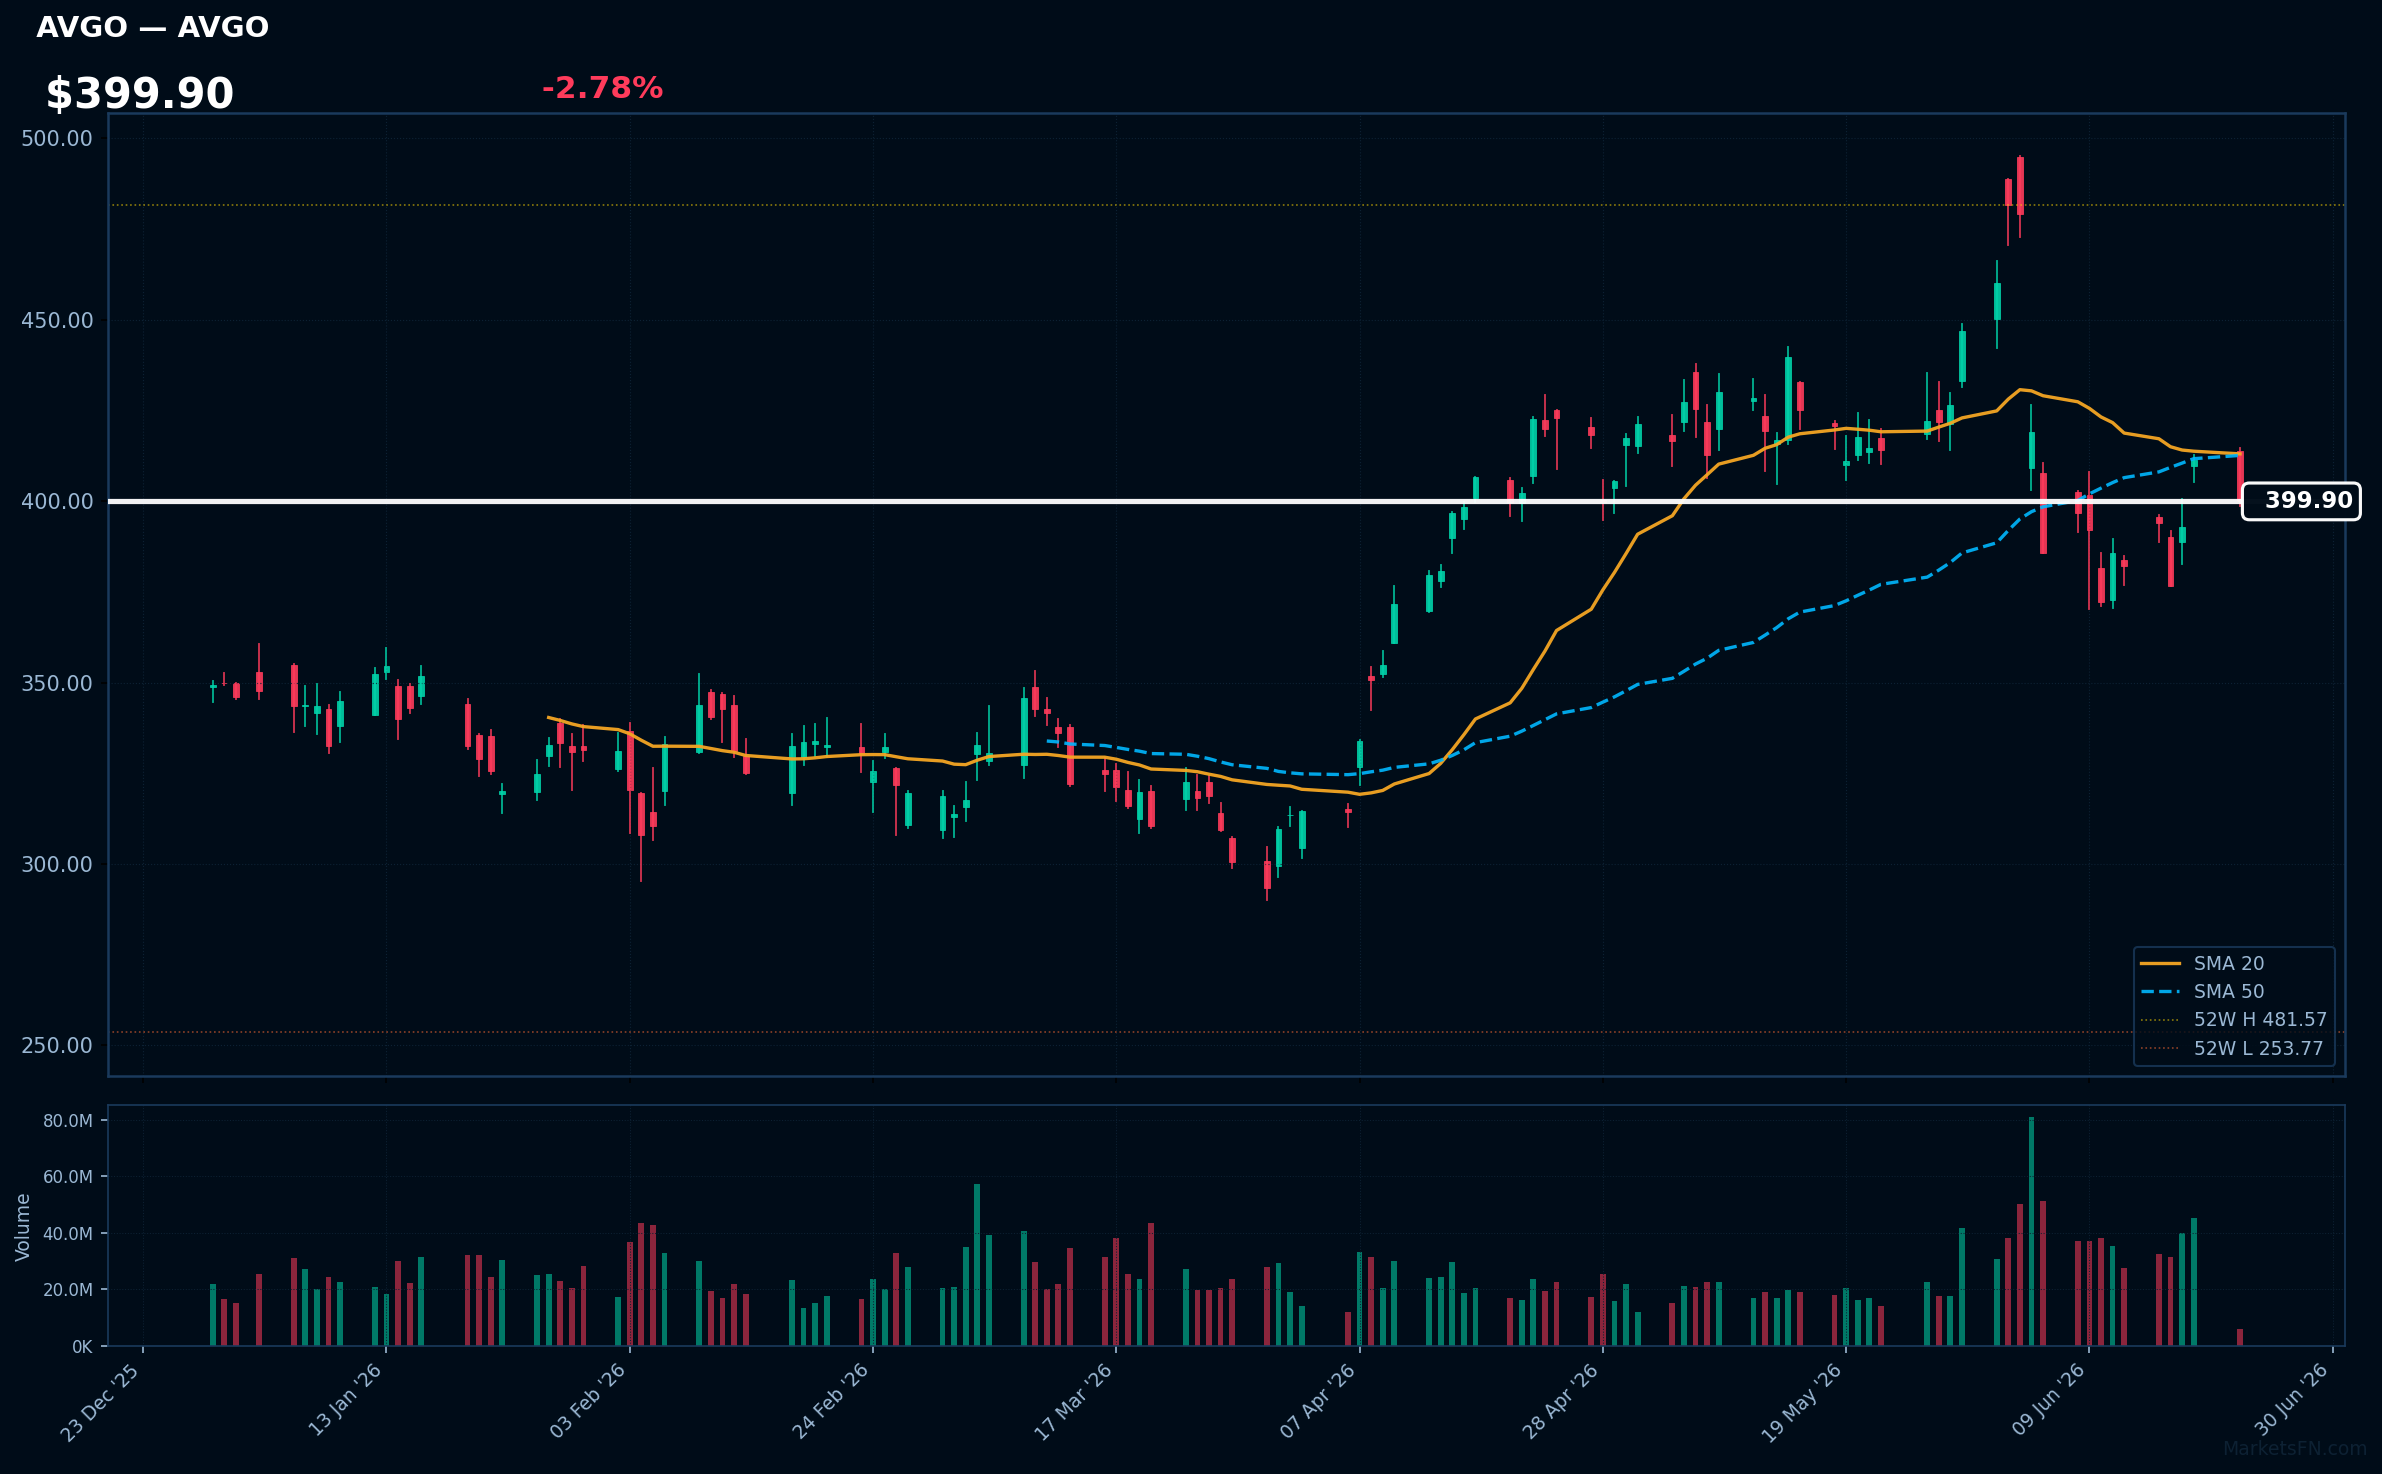
AVGO | Broadcom Inc | Technology | Price: $399.91 | Day: -2.78% | 1W: +4.67% | 1M: -4.27% | RSI: 48.2 | vs MA200: +11.0% | Trend: Above MA200 · Below MA20, MA50
Recent headlines (last 12h)
- J.P. Morgan Fires Back at Google Rumors Threatening Broadcom Stock
- GOOGL Stock Dips Premarket After Breakout Week: Analyst Says Google Developing Next-Gen AI Chip With MediaTek
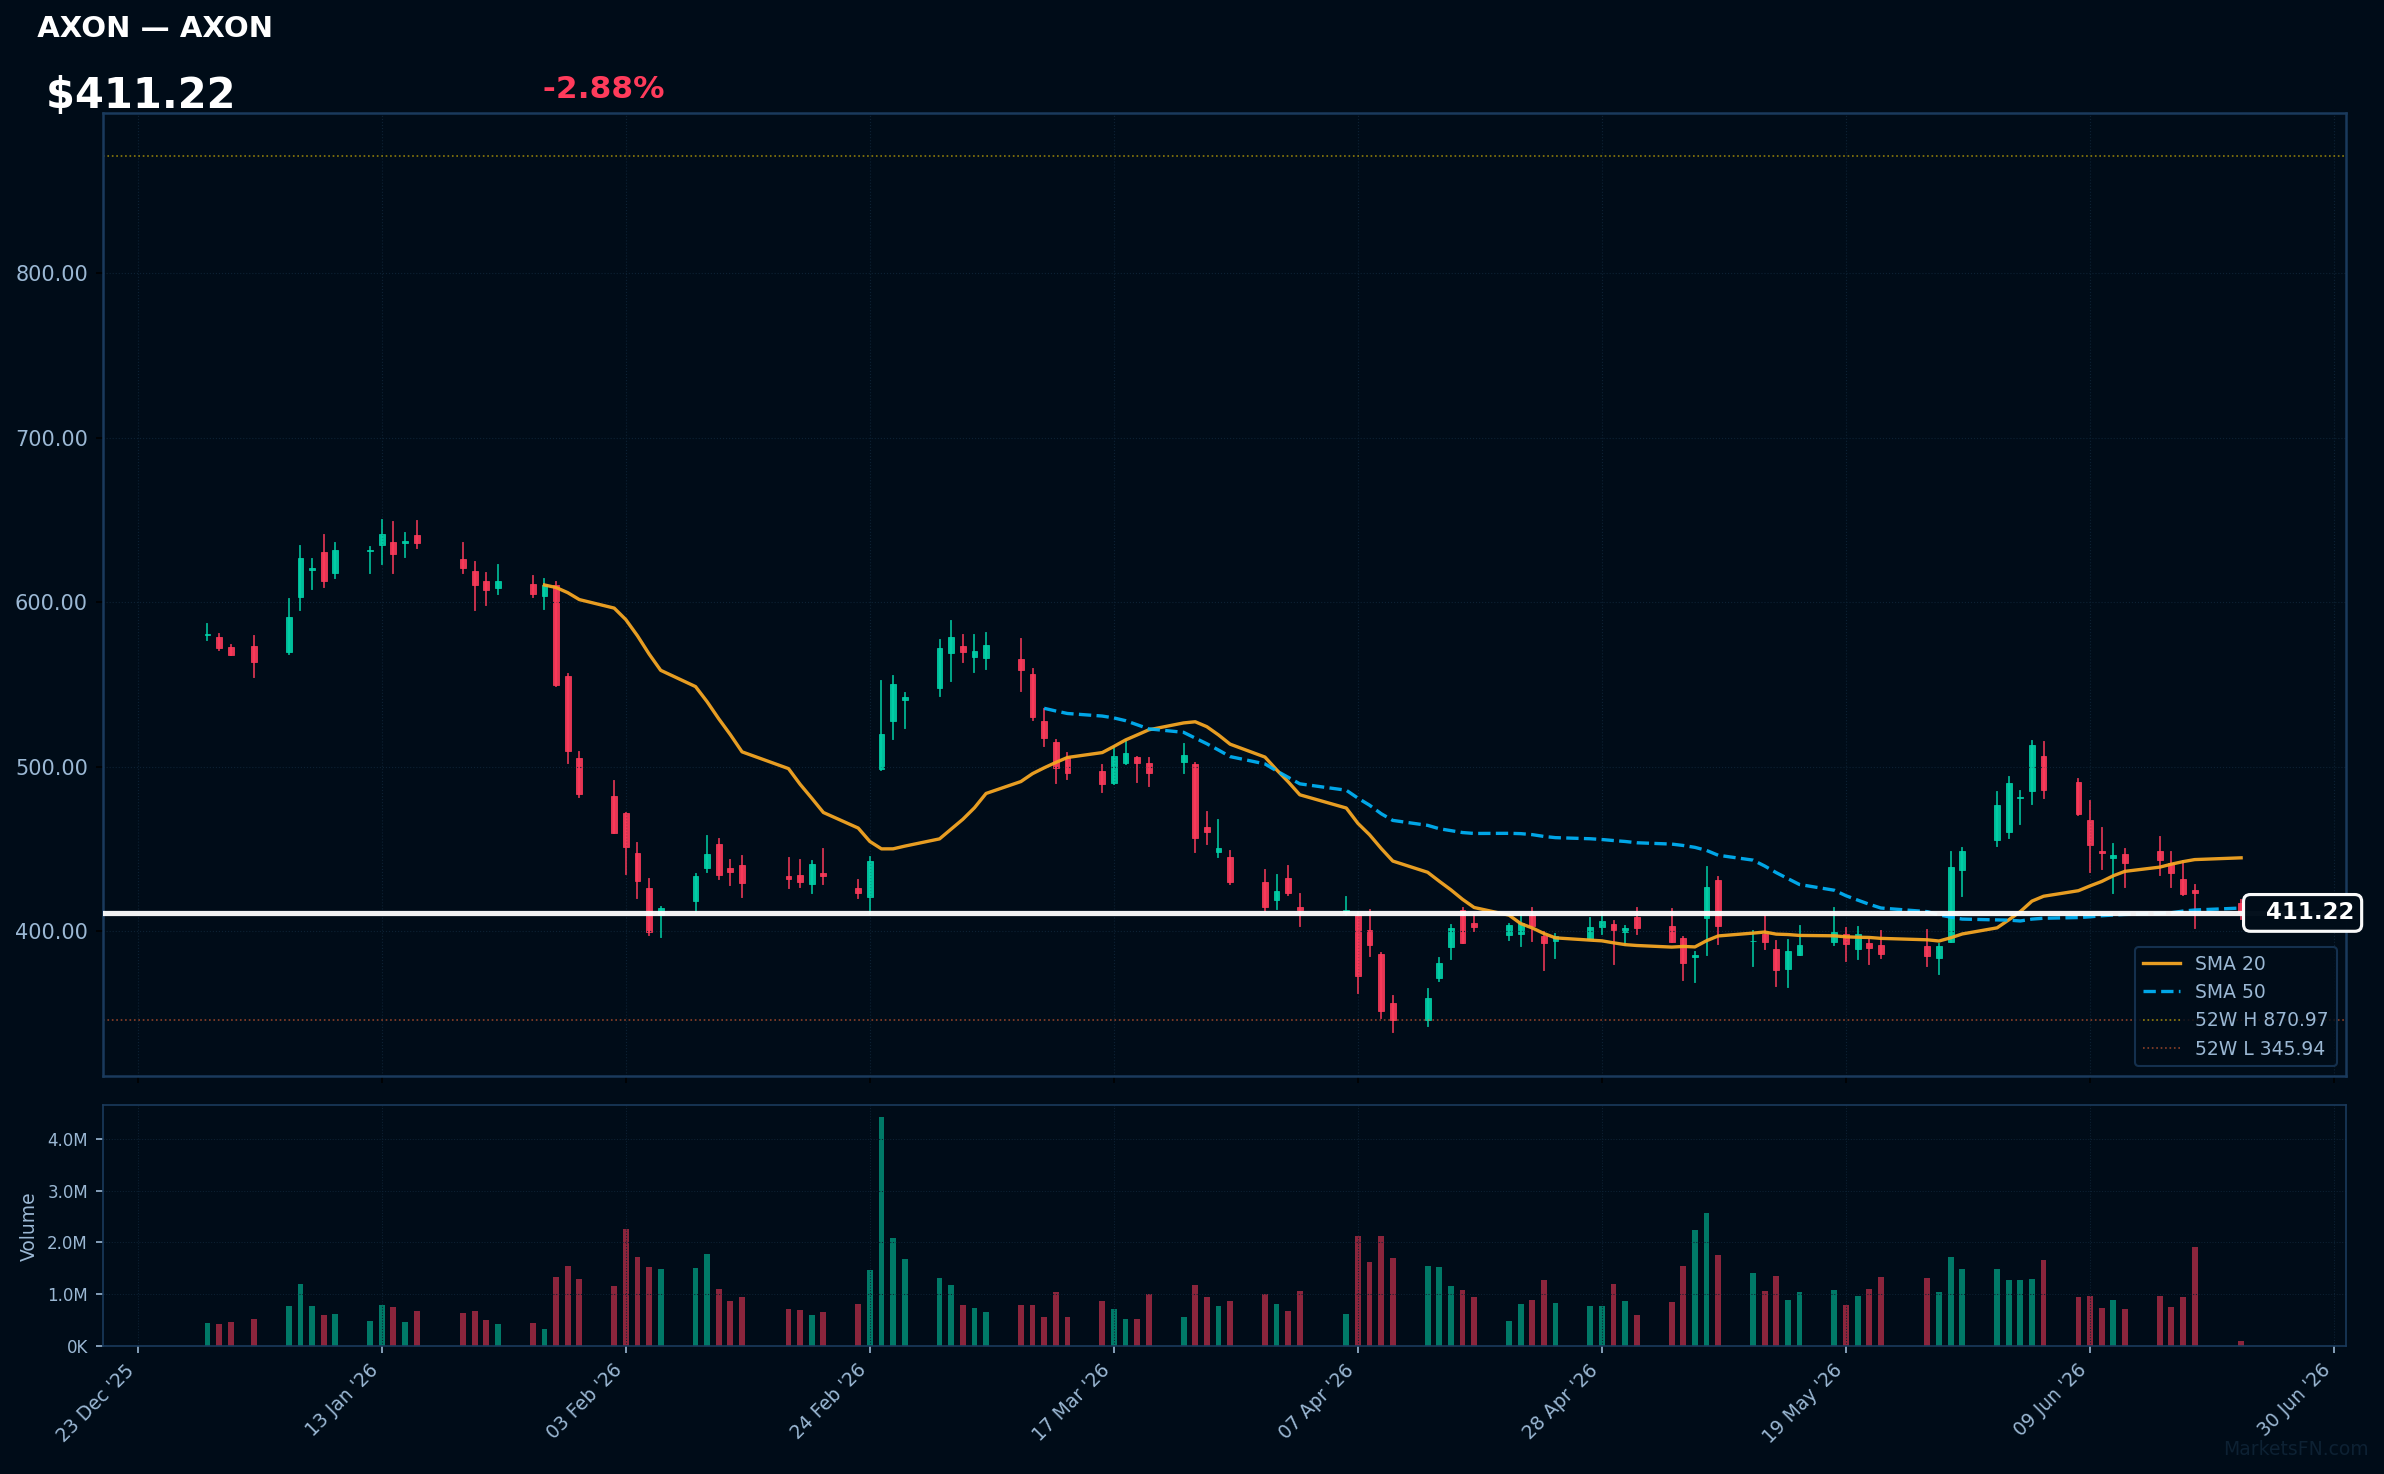
AXON | Axon Enterprise Inc | Industrials | Price: $411.22 | Day: -2.88% | 1W: -6.91% | 1M: +3.21% | RSI: 42.1 | vs MA200: -24.3% | Trend: Below MA20, MA50, MA200
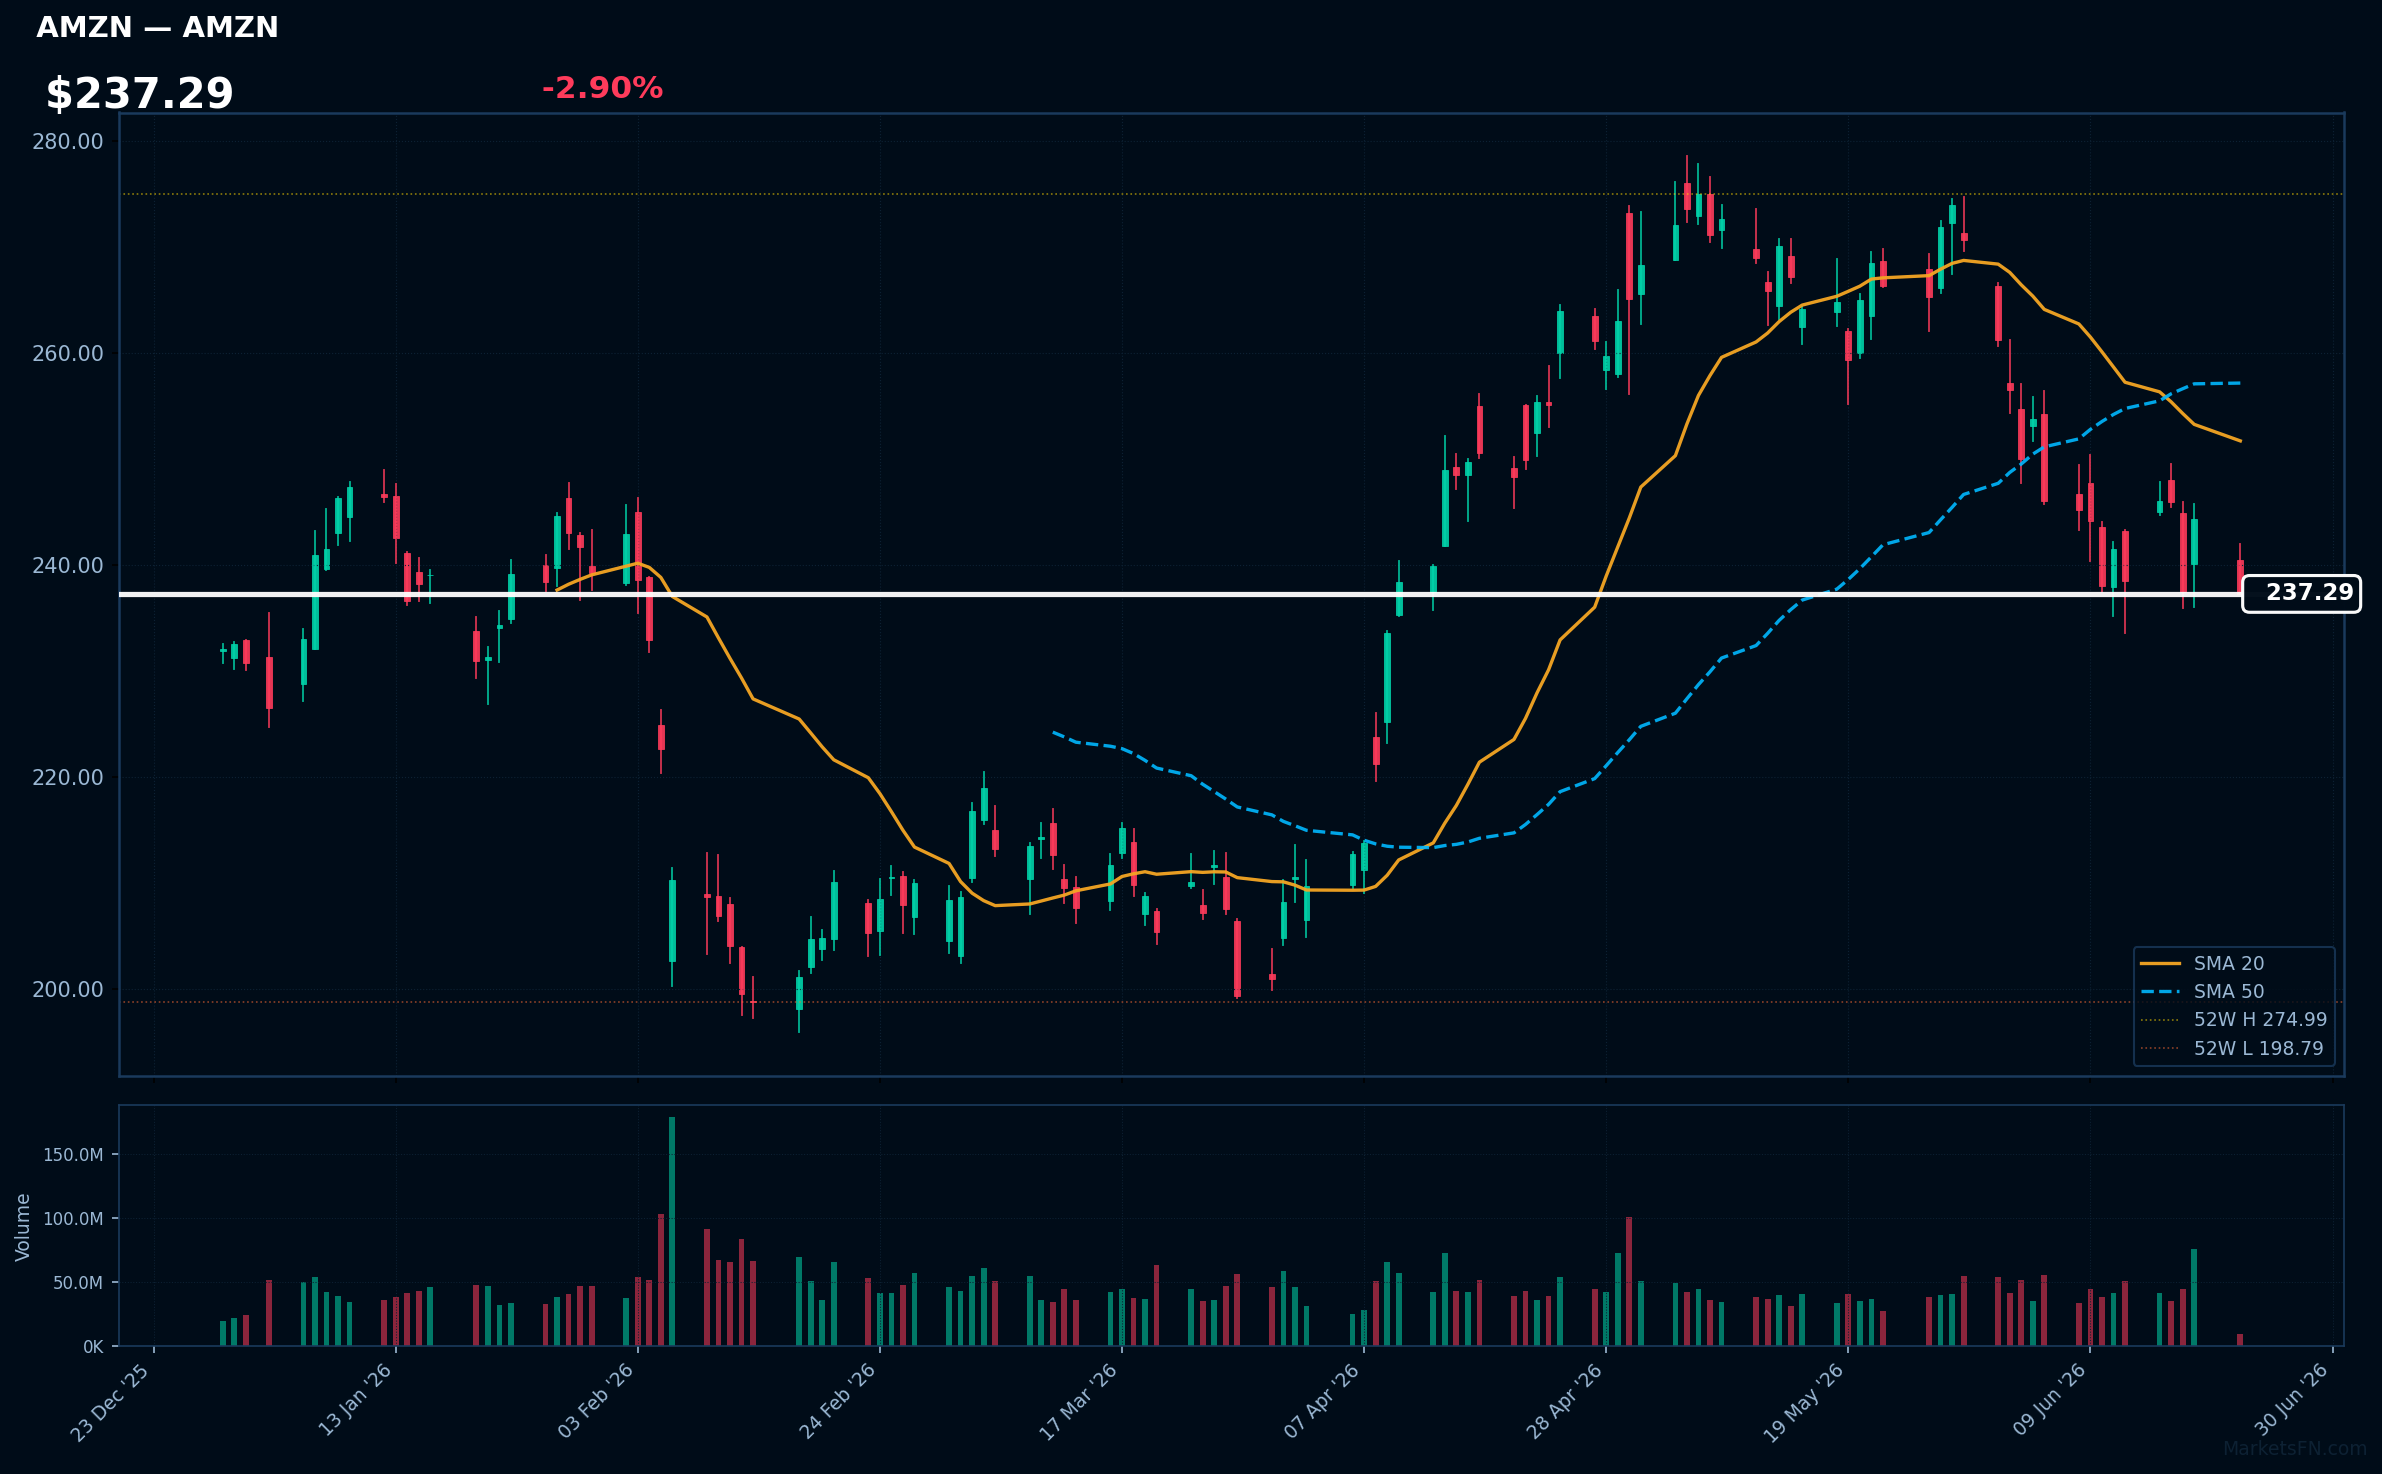
AMZN | Amazon.com Inc | Consumer Cyclical | Price: $237.29 | Day: -2.90% | 1W: -0.53% | 1M: -10.46% | RSI: 39.1 | vs MA200: +1.9% | Trend: Above MA200 · Below MA20, MA50
Recent headlines (last 12h)
- CPSC is recalling 70,000 teething toys sold on Amazon after children choked on silicone strings
- Amazon Prime Day Puts Retail Demand in Focus
- Amazon Prime Day Set to Generate Record Online Spending as Retailers Compete for Shoppers (AMZN)
- Dow Jones opens higher but Nasdaq flat as hawkish Fed still looms
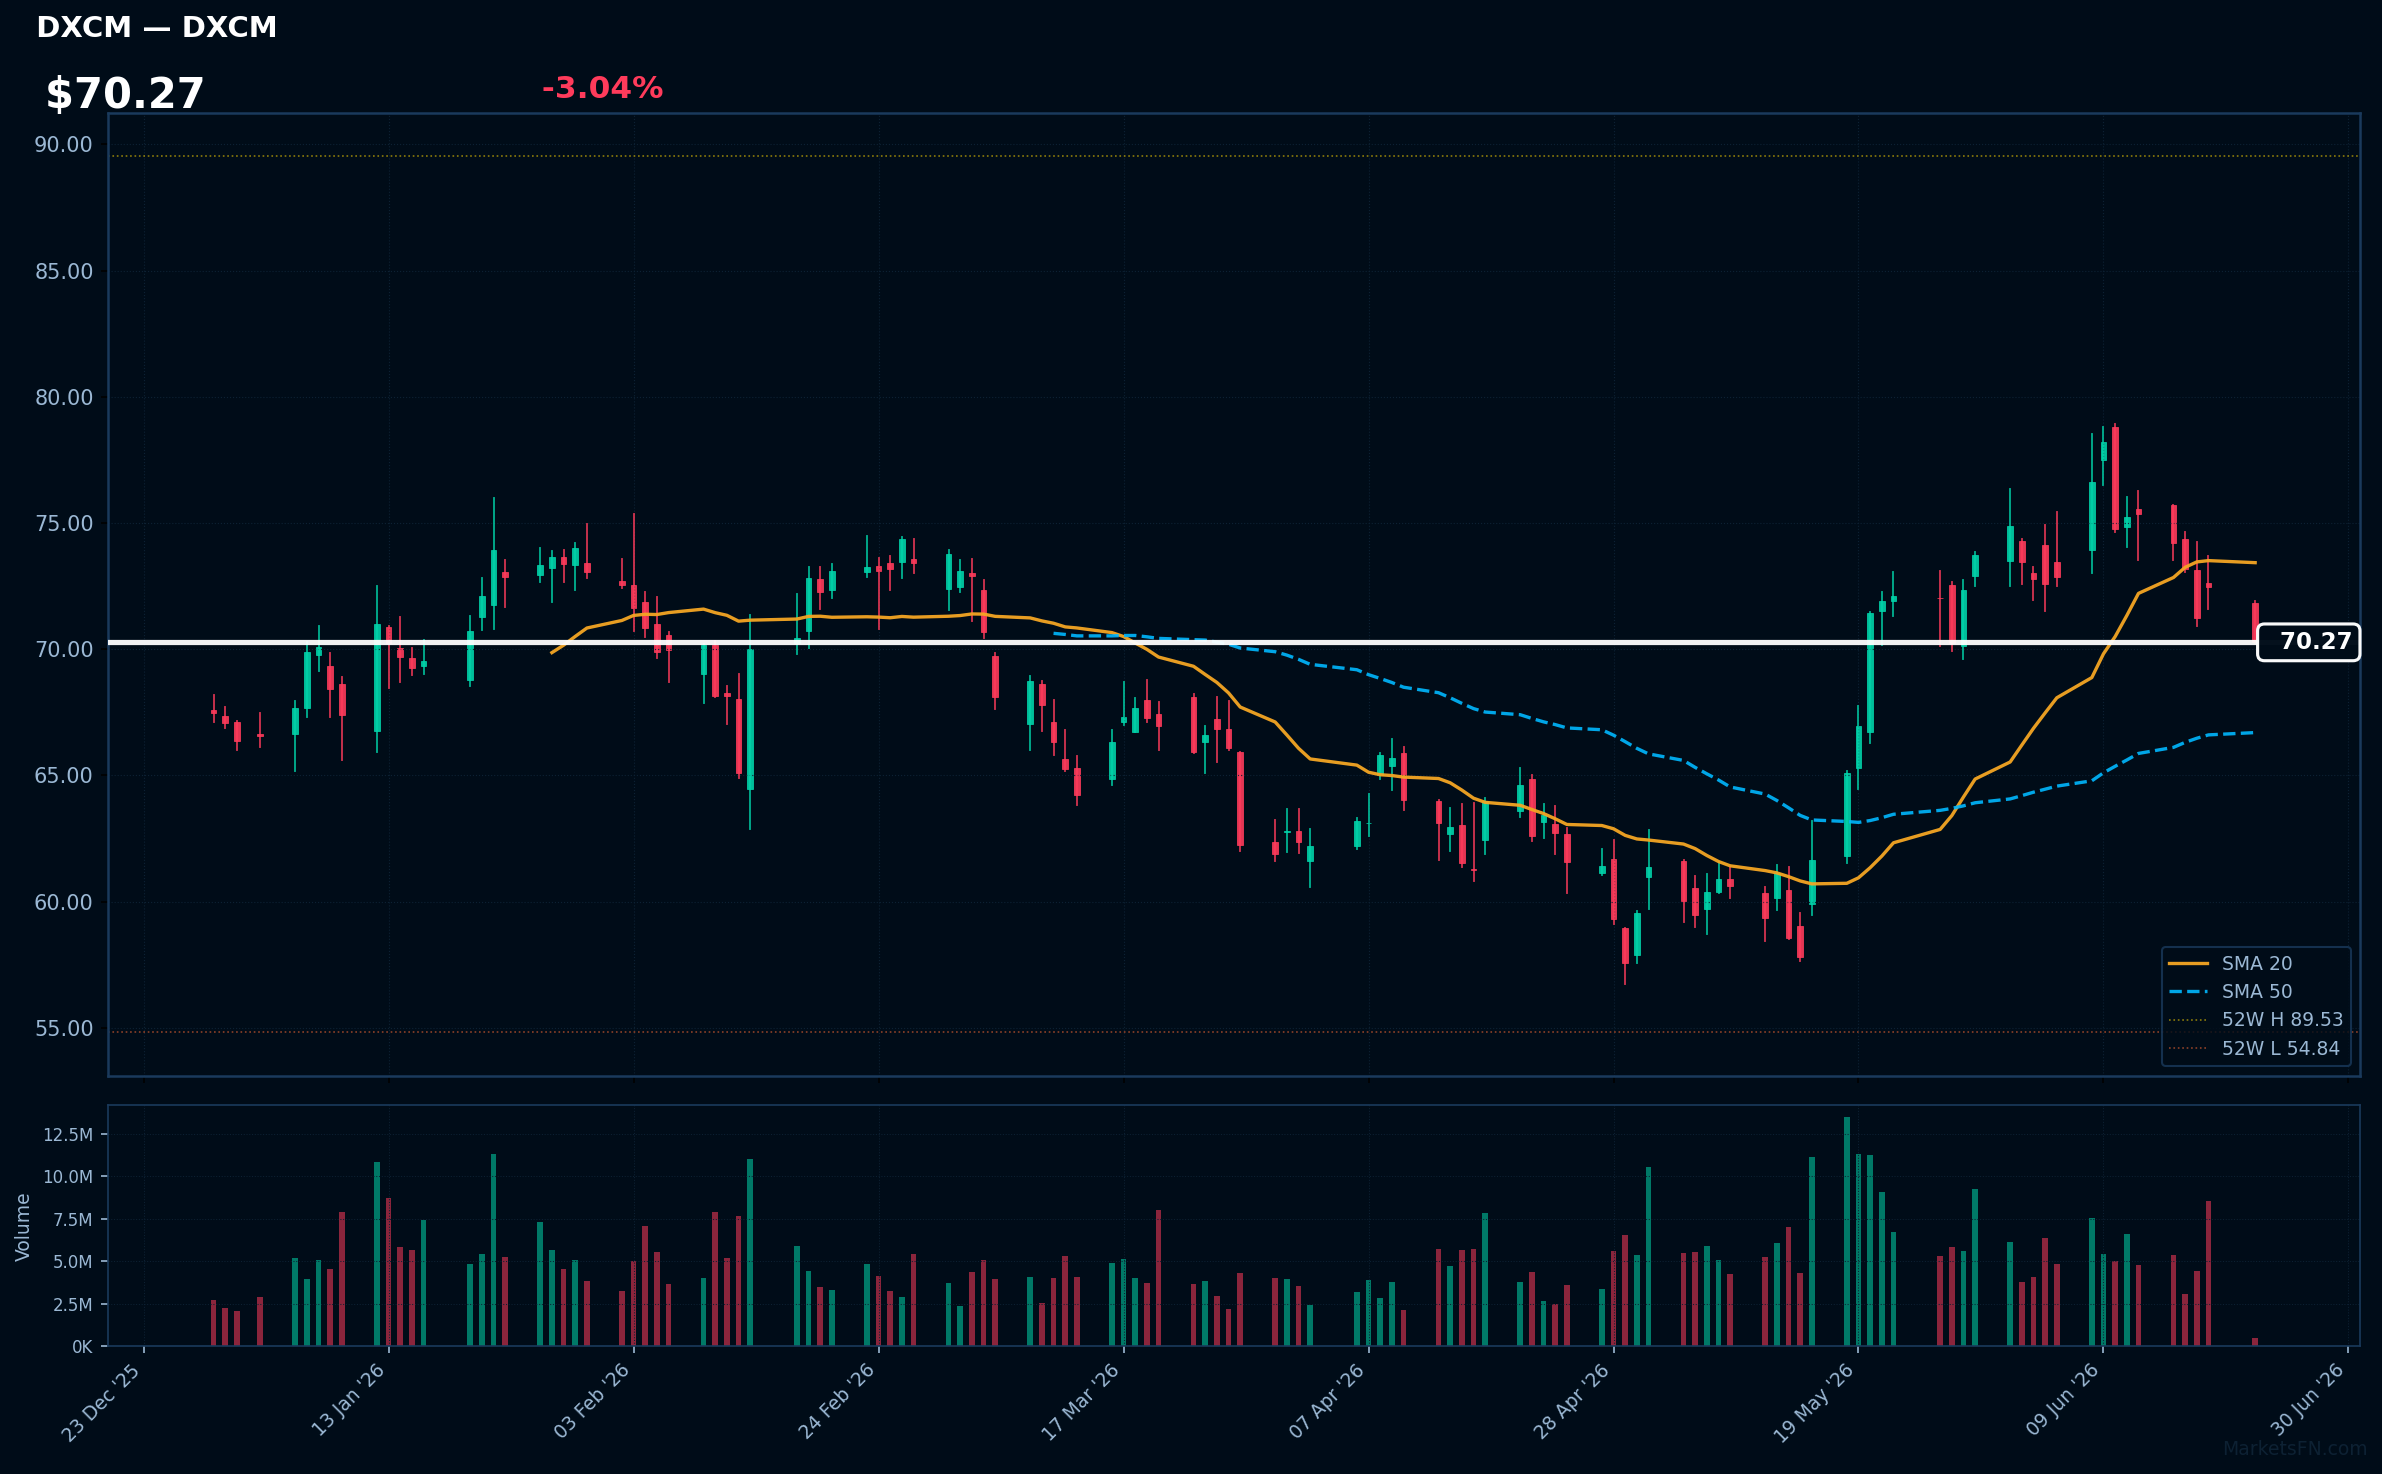
DXCM | Dexcom Inc | Healthcare | Price: $70.27 | Day: -3.04% | 1W: -6.77% | 1M: -1.64% | RSI: 47.8 | vs MA200: +4.1% | Trend: Above MA50, MA200 · Below MA20
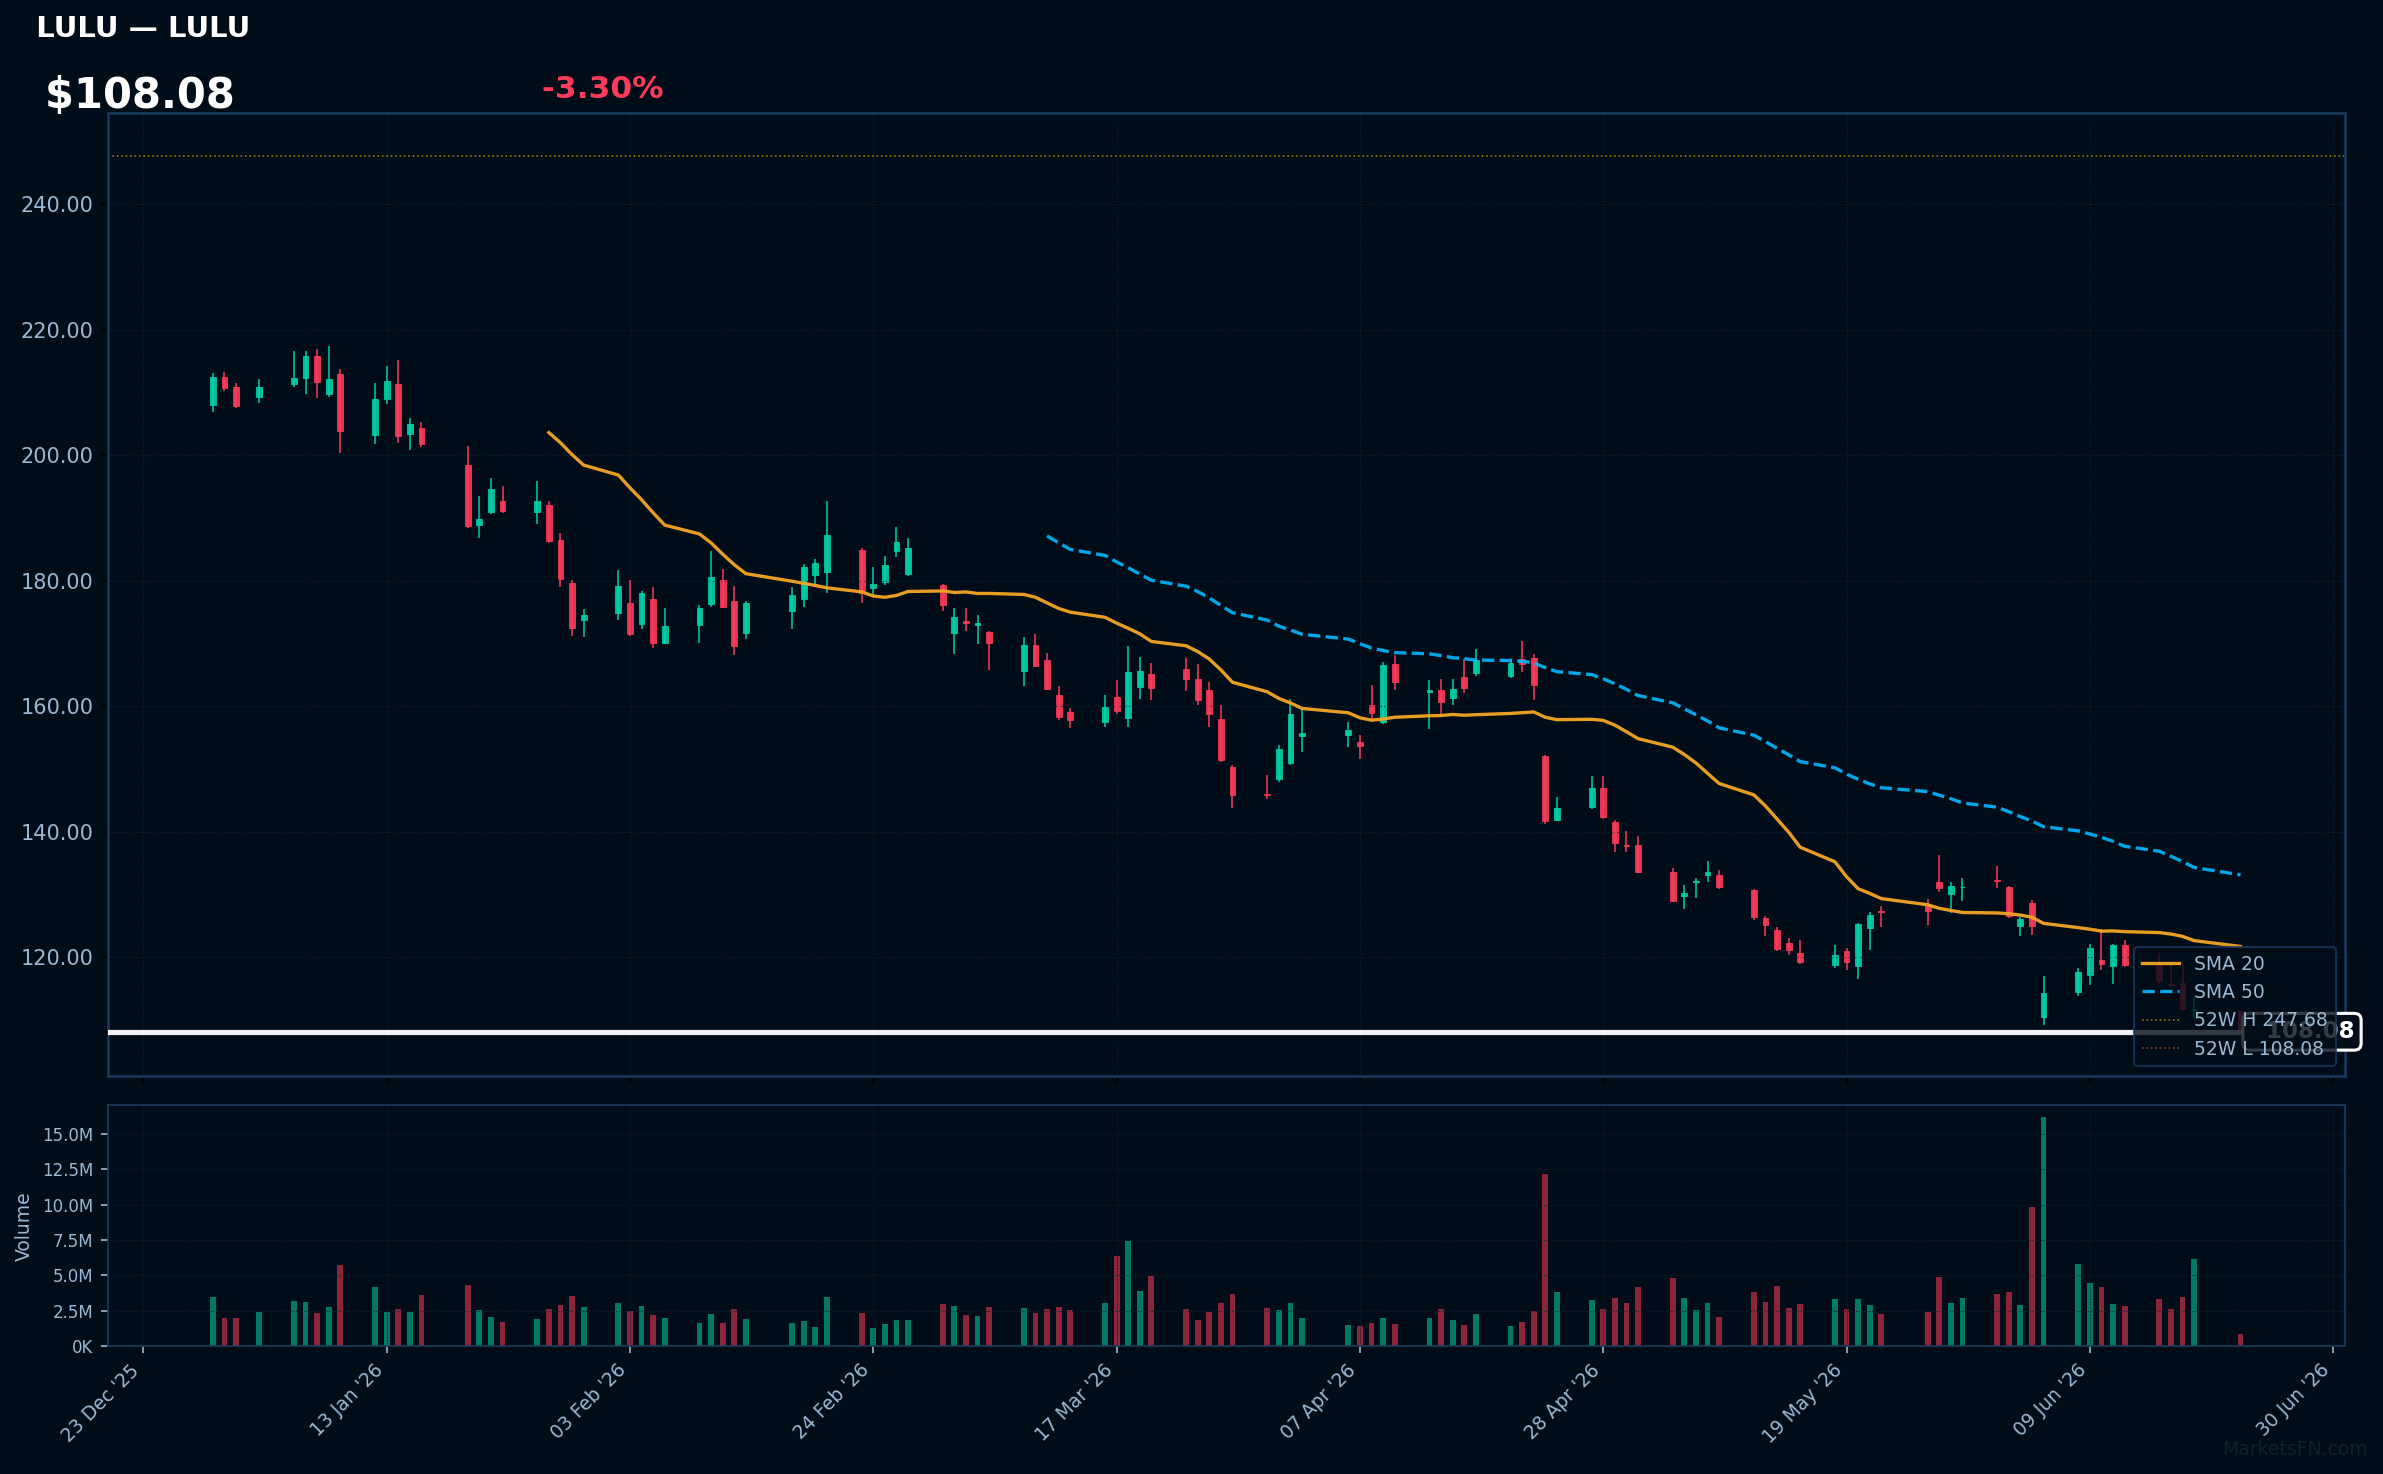
LULU | Lululemon Athletica inc | Consumer Cyclical | Price: $108.08 | Day: -3.30% | 1W: -9.00% | 1M: -13.67% | RSI: 29.0 | vs MA200: -35.3% | Trend: Below MA20, MA50, MA200
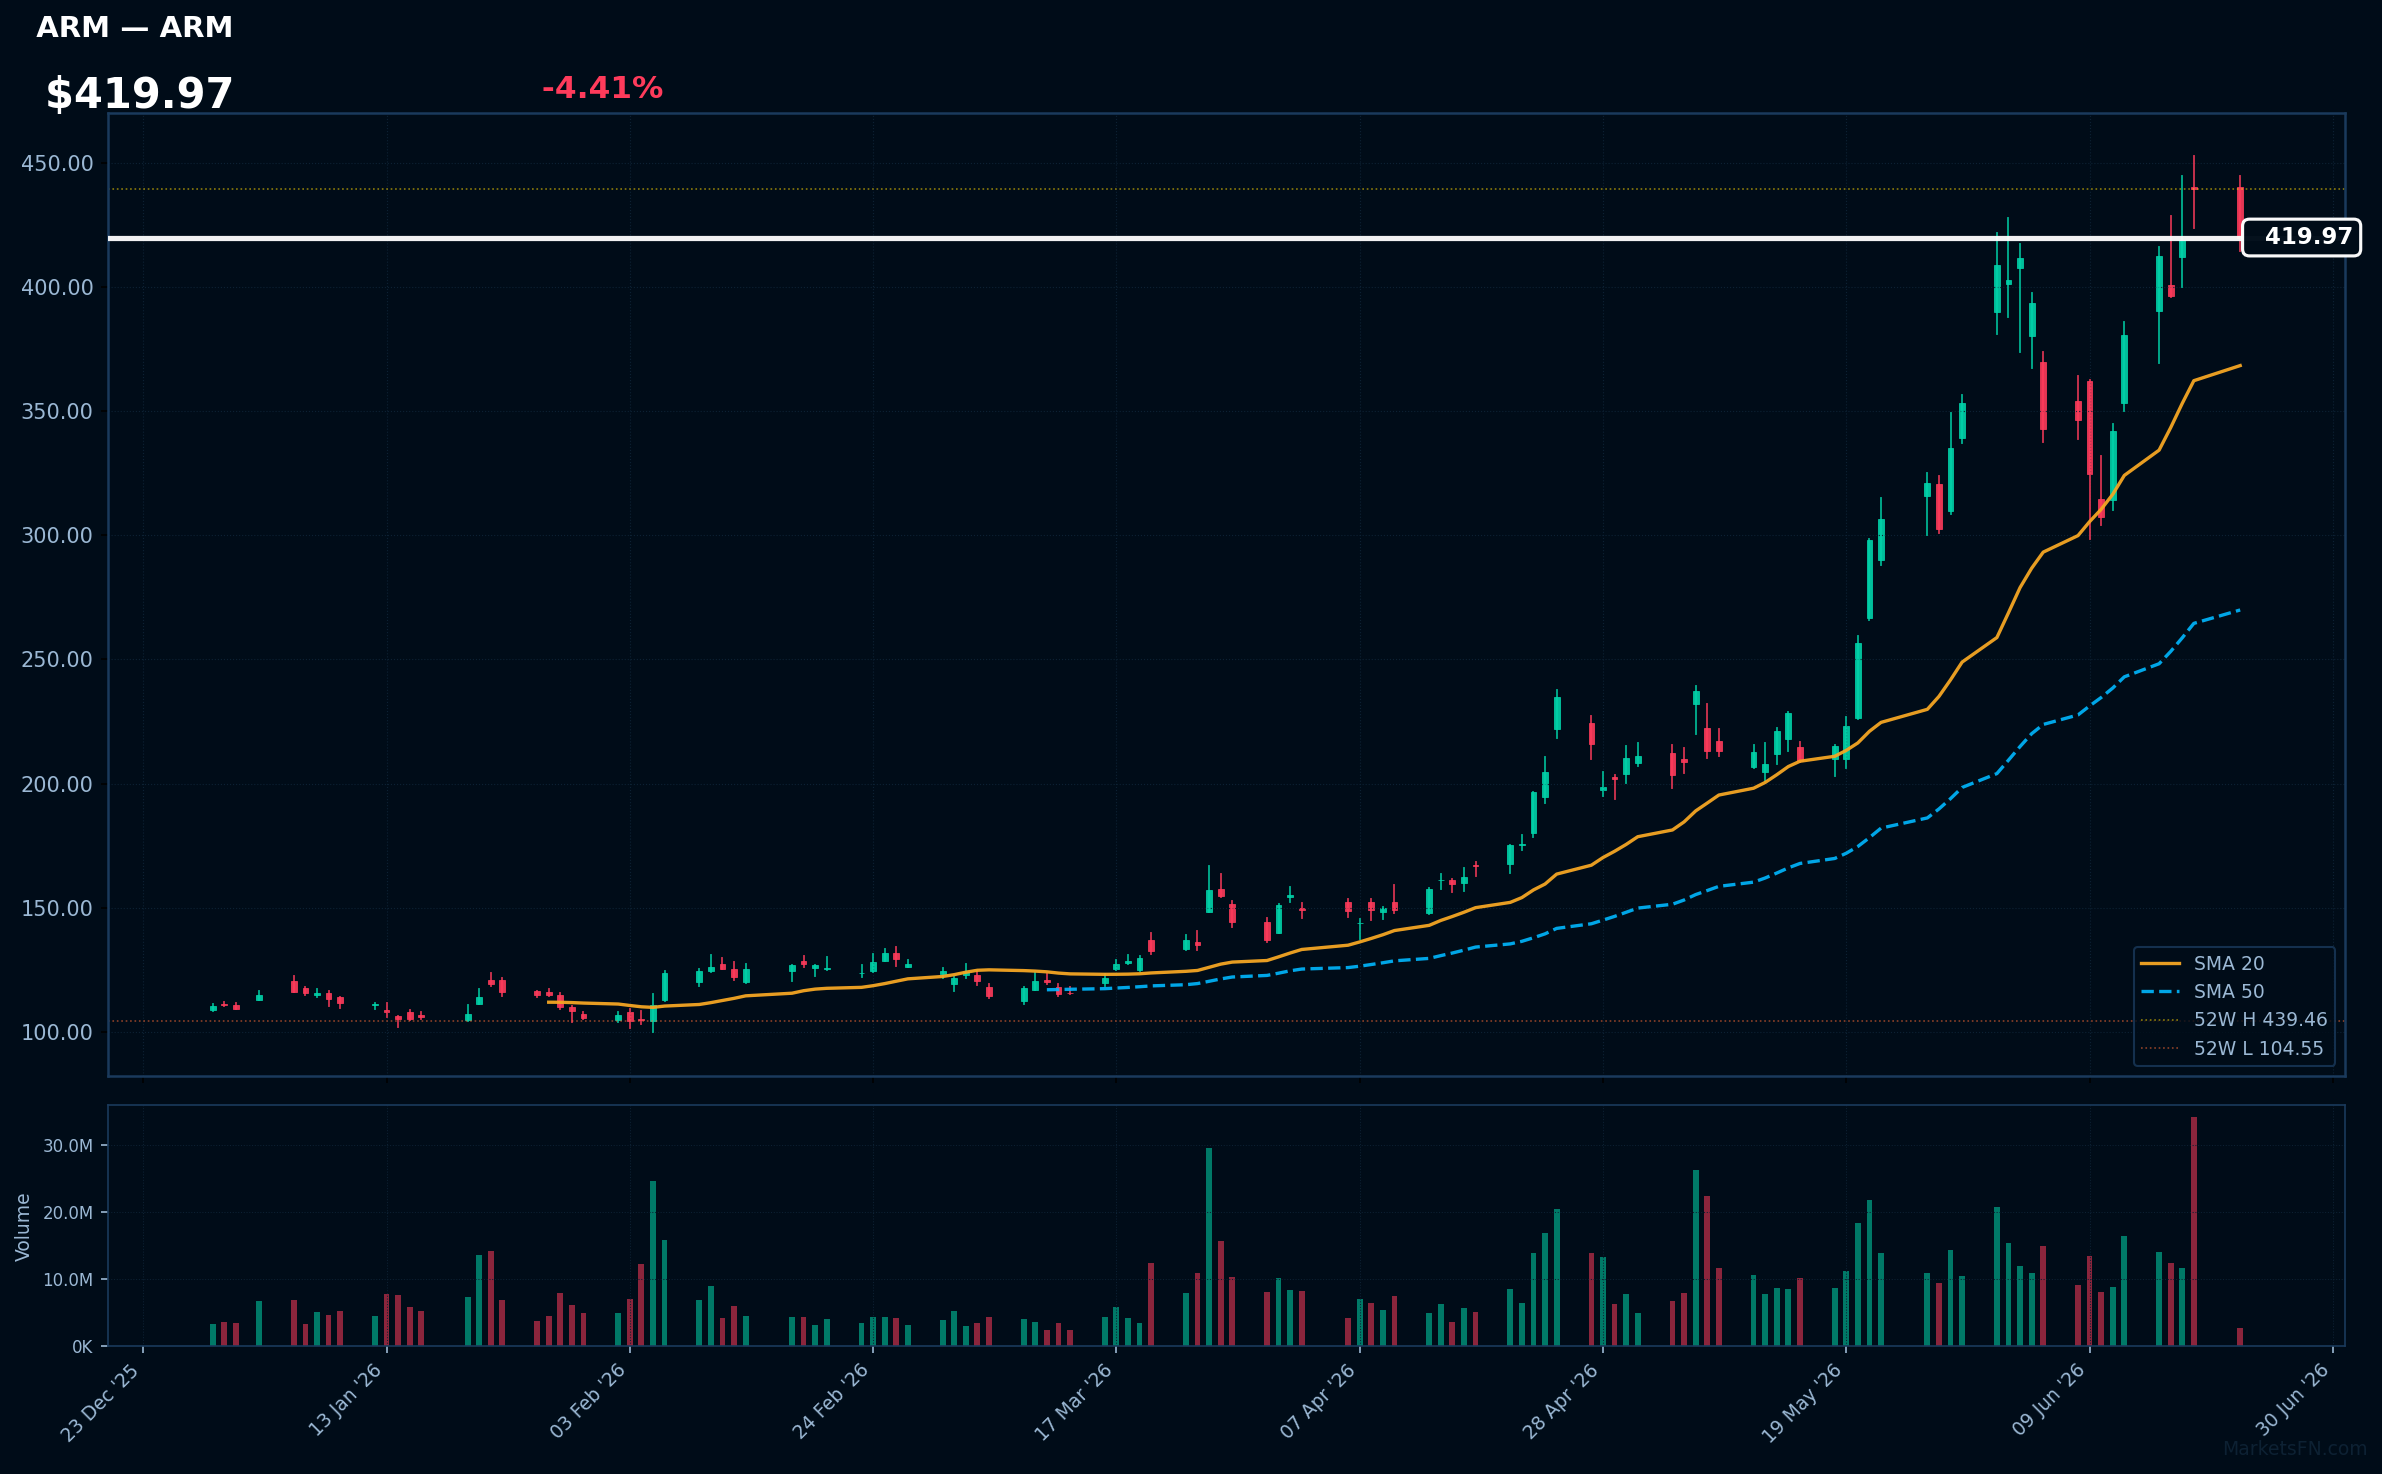
ARM | Arm Holdings plc. ADR | Technology | Price: $420.10 | Day: -4.41% | 1W: +10.28% | 1M: +63.58% | RSI: 64.4 | vs MA200: +148.2% | Trend: Above MA20, MA50, MA200
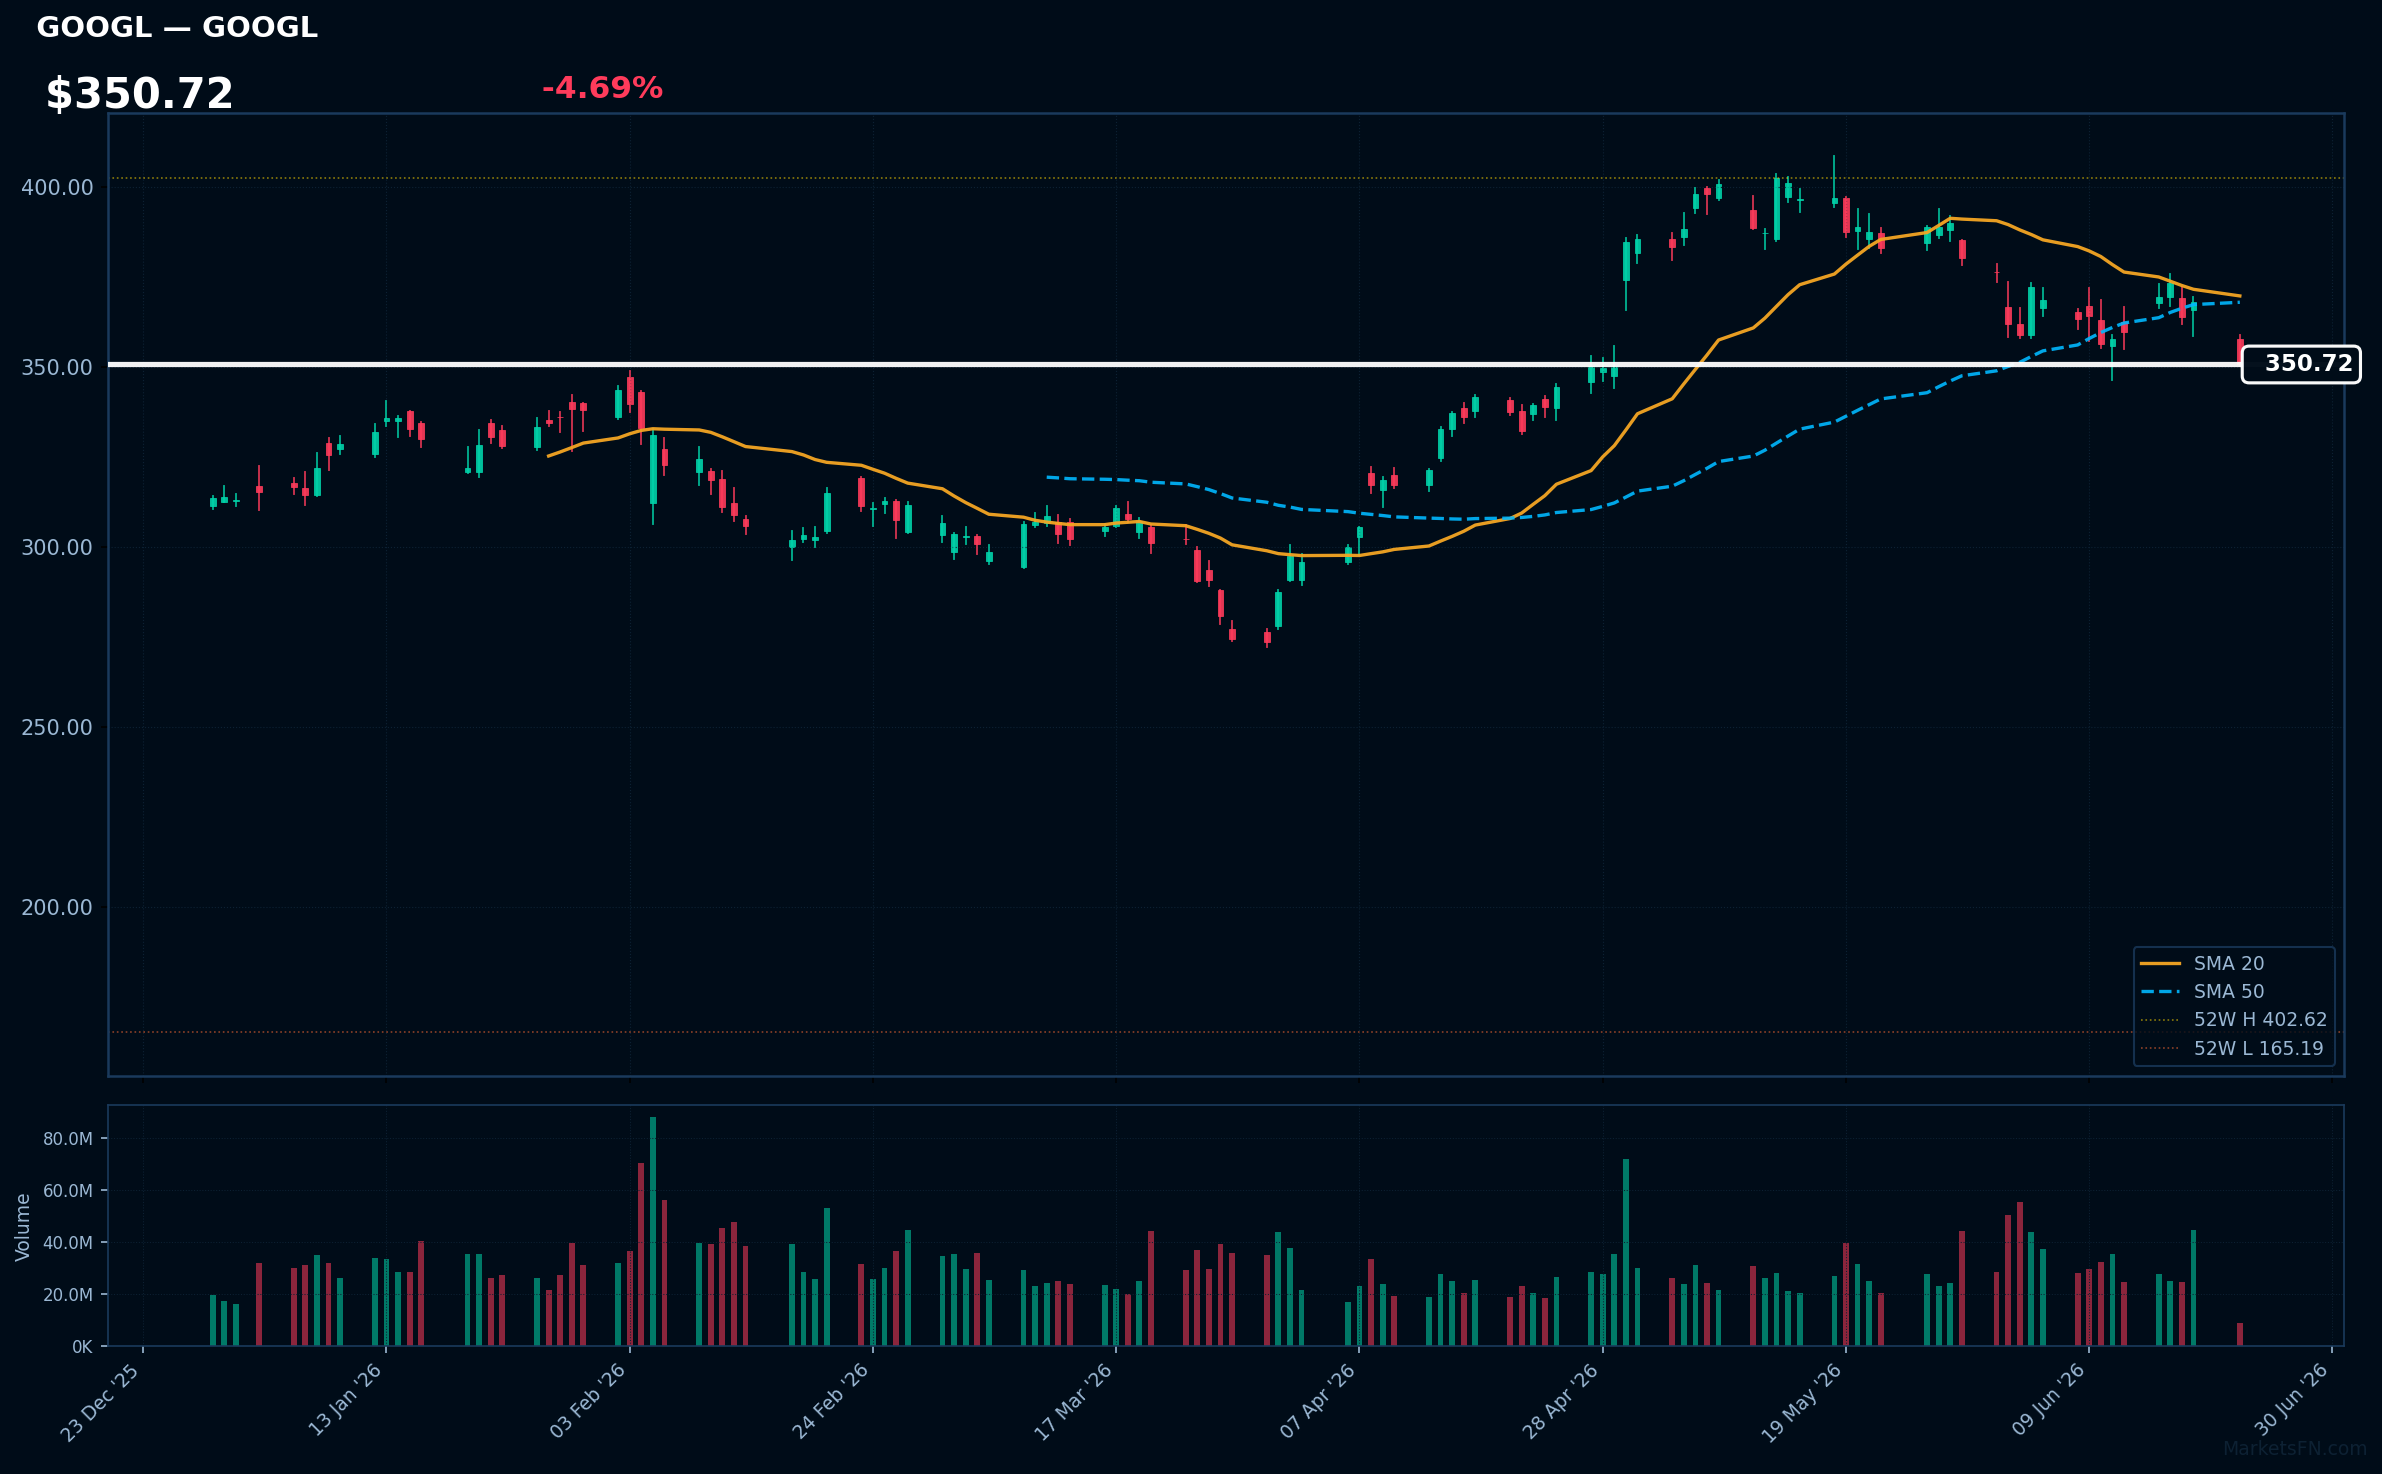
GOOGL | Alphabet Inc | Communication Services | Price: $350.77 | Day: -4.69% | 1W: -2.49% | 1M: -9.82% | RSI: 39.4 | vs MA200: +12.5% | Trend: Above MA200 · Below MA20, MA50
Recent headlines (last 12h)
- SK Hynix overtakes Samsung to become South Korea's most valuable company
- Why Wait For Adobe Stock To Bottom When You Can Get Paid Today?
- Google Backs $3.2B AI Chip Push Against Nvidia
- J.P. Morgan Fires Back at Google Rumors Threatening Broadcom Stock
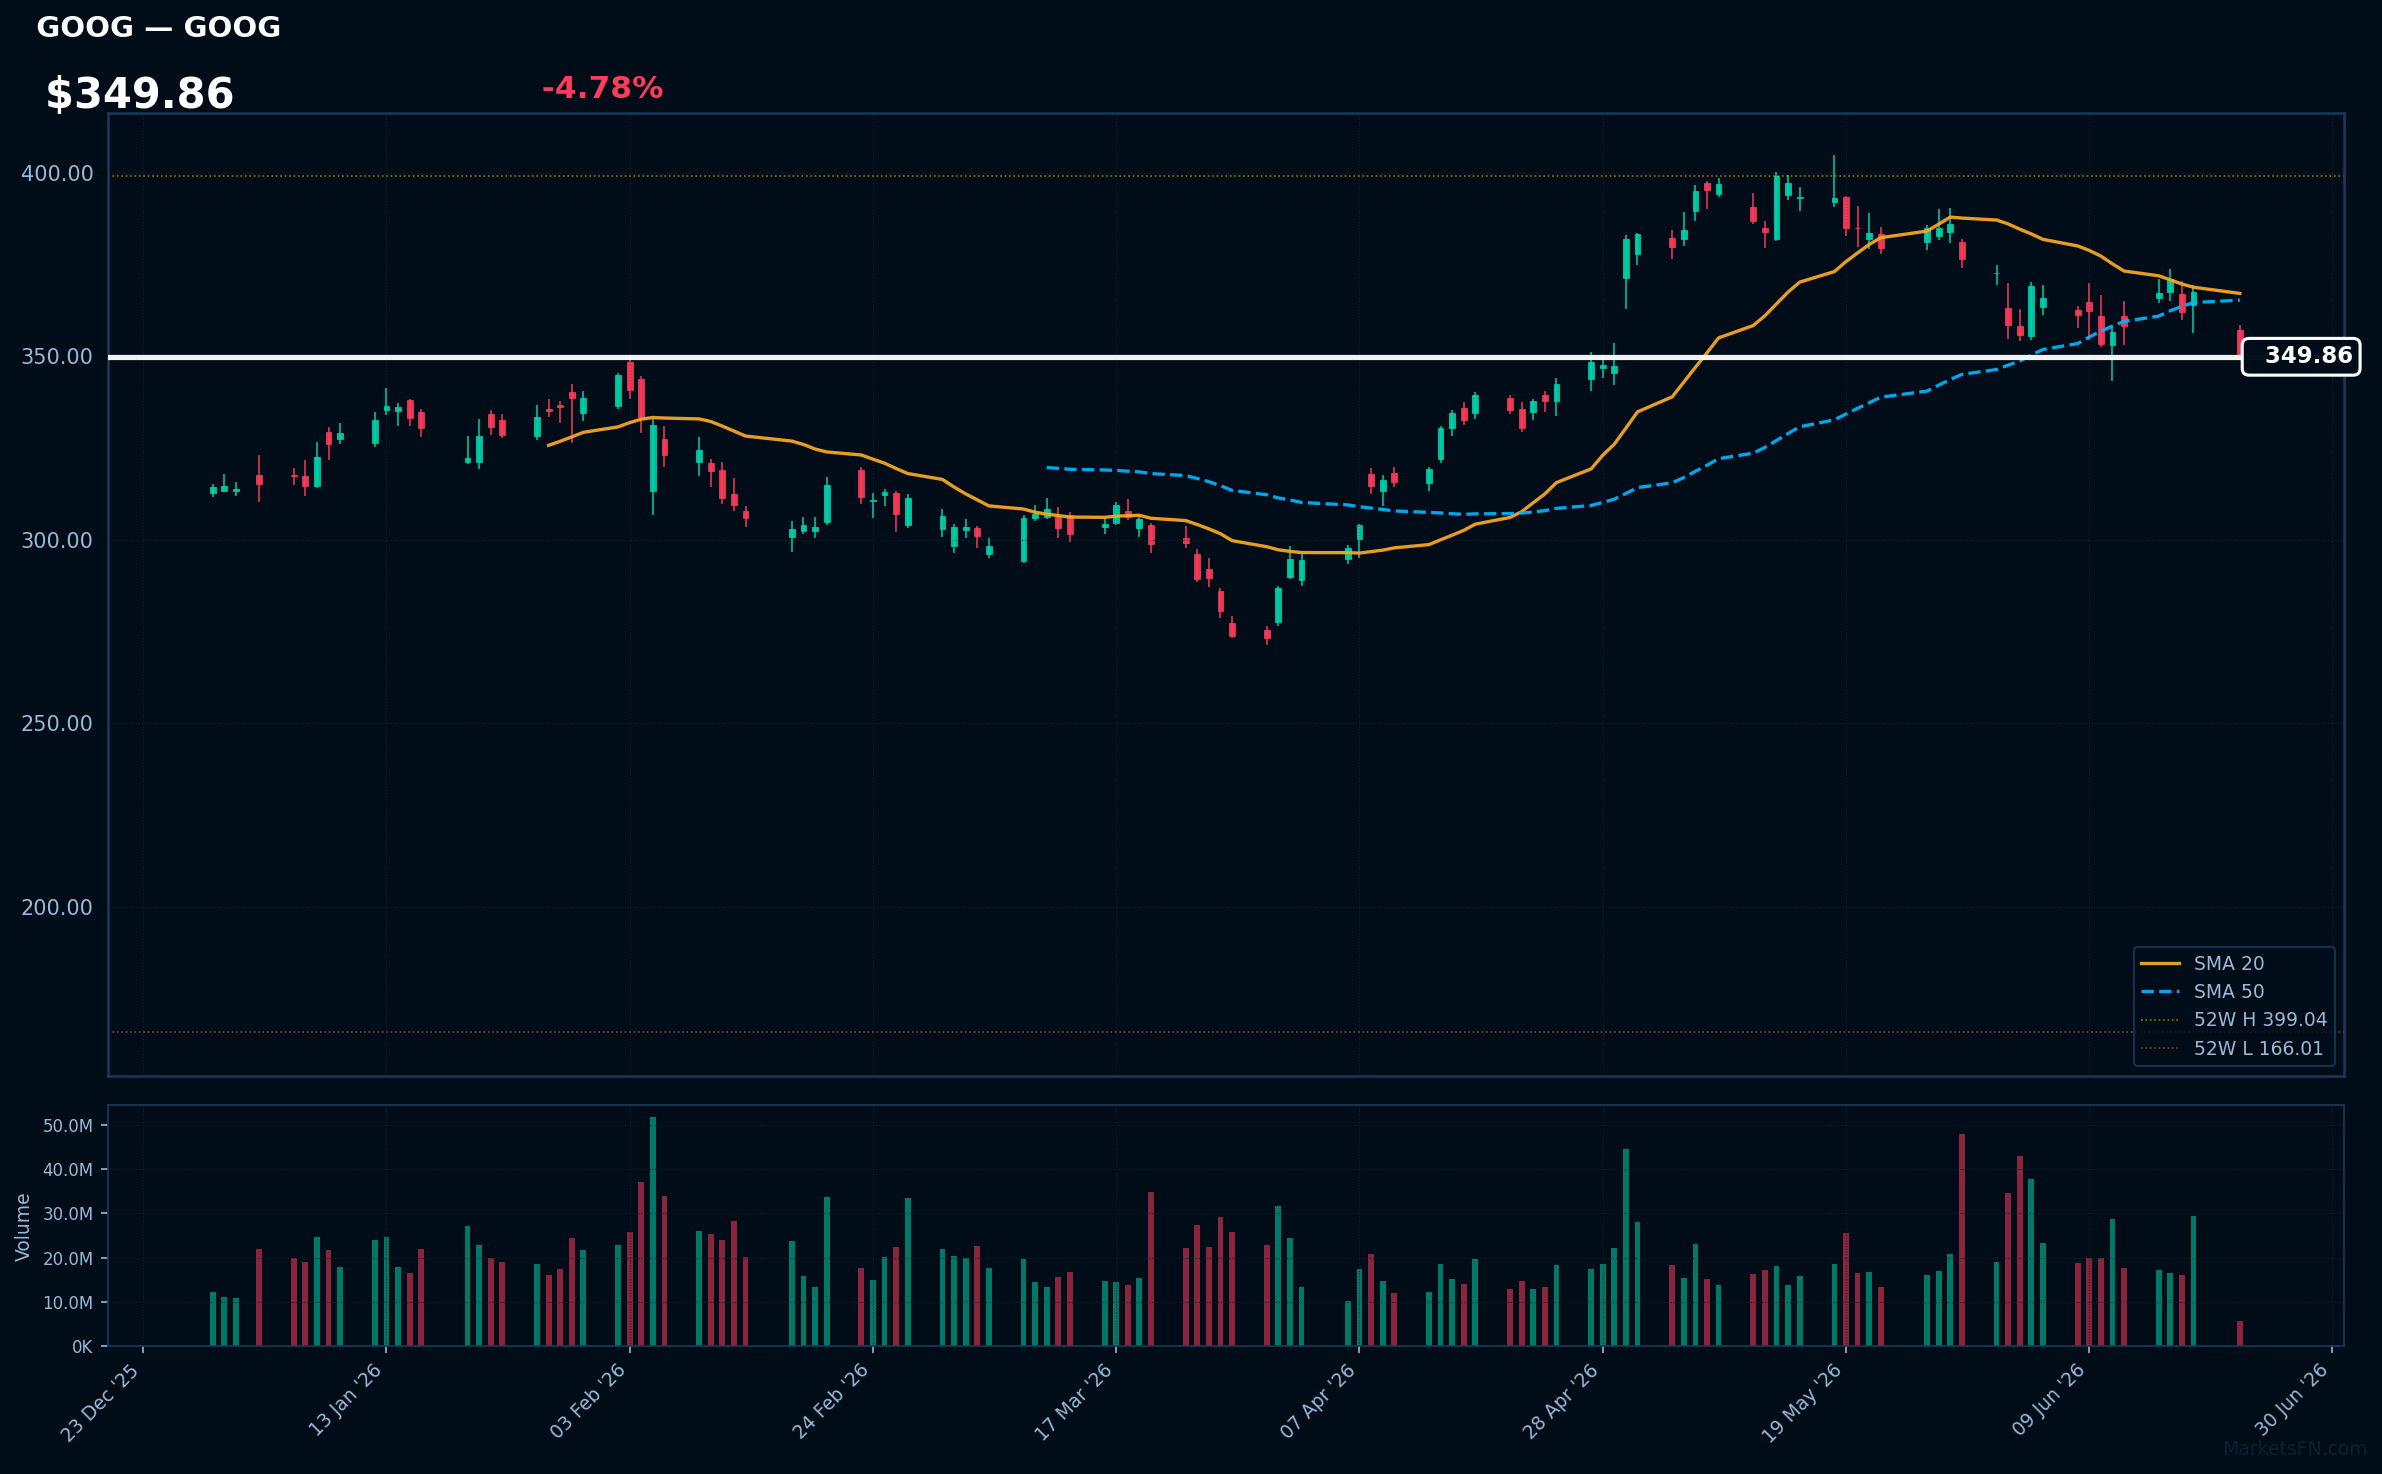
GOOG | Alphabet Inc | Communication Services | Price: $349.91 | Day: -4.78% | 1W: -2.32% | 1M: -9.10% | RSI: 40.5 | vs MA200: +12.4% | Trend: Above MA200 · Below MA20, MA50
Recent headlines (last 12h)
- SK Hynix overtakes Samsung to become South Korea's most valuable company
- Why Wait For Adobe Stock To Bottom When You Can Get Paid Today?
- Google Backs $3.2B AI Chip Push Against Nvidia
- J.P. Morgan Fires Back at Google Rumors Threatening Broadcom Stock
Market Commentary
The Nasdaq 100 session on June 22, 2026, showed a moderately positive tone with 58 constituents advancing (58.0%) versus 41 declining (41.0%), accompanied by a +0.39% average daily change. This suggests a relatively broad-based rally, though not a strongly one-sided move.
The technology sector exhibited a mixed performance, with stocks like ON, MU, and INTC among the top 10 gainers, while others such as AVGO, AXON, and GOOG were among the top losers. This divergence indicates potential rotation within the sector, with some technology names outperforming while others lag. The presence of both semiconductor stocks (MU, NXPI, KLAC) and tech giants (INTC, TXN) among gainers suggests a nuanced sector dynamic.
With only 16 stocks (16.0%) trading above their MA200, traders should monitor whether this rally can gain further momentum or if it will stall. A break above or below this level could signal a shift in market sentiment. The next key data point to watch will be the sector's reaction to upcoming earnings reports from major technology companies.
Methodology
Daily ranking uses the latest session close versus the prior close. RSI (14-day EWM), MA20, MA50, and MA200 are computed from 12 months of daily OHLCV data sourced from Yahoo Finance. Charts show the last 120 trading sessions with SMA 20/50, 52-week H/L markers, and volume. Recent news (last 12 h) is sourced from FinViz. Updated every trading day.
Disclaimer
The content on MarketsFN.com is provided for educational and informational purposes only. It does not constitute financial advice, investment recommendations, or trading guidance. All investments involve risks, and past performance does not guarantee future results. You are solely responsible for your investment decisions and should conduct independent research and consult a qualified financial advisor before acting. MarketsFN.com and its authors are not liable for any losses or damages arising from your use of this information.
Related Articles
- S&P 500 52-Week Highs & Lows Radar: GE Aerospace (GE), Palantir (PLTR) and more — S&P 500 stocks nearest to their 52-week high and low. Bloomberg-style charts, RSI/MA analysis and Grok commentary.
- S&P 500 52-Week Highs & Lows Radar: GE Aerospace (GE), Salesforce (CRM) and more — S&P 500 stocks nearest to their 52-week high and low. Bloomberg-style charts, RSI/MA analysis and Grok commentary.
- S&P 500 Bull & Bear Radar — June 19, 2026 — S&P 500 Bull & Bear Radar — June 19, 2026 A daily technical sweep of 495 S&P 500 constituents ranked by session…
- Nasdaq 100 Bull & Bear Radar — June 19, 2026 — Nasdaq 100 Bull & Bear Radar — June 19, 2026 A daily technical sweep of 101 Nasdaq 100 constituents ranked by session…
- Nasdaq 100 Bull & Bear Radar — June 18, 2026 — Nasdaq 100 Bull & Bear Radar — June 18, 2026 A daily technical sweep of 101 Nasdaq 100 constituents ranked by session…