Nasdaq 100 Bull & Bear Radar — June 19, 2026
· Stocks · QuoteReporter
Nasdaq 100 Bull & Bear Radar — June 19, 2026
A daily technical sweep of 101 Nasdaq 100 constituents ranked by session performance, enriched with RSI, MA20/MA50/MA200 trend signals, Bloomberg-style charts, and recent news.
Index-Wide Breadth
| Constituents tracked | 101 |
| Advancing | 17 (16.8%) |
| Declining | 83 (82.2%) |
| Average daily change | 1.77% |
| Above MA200 | 12 (11.9%) |
Top 10 Gainers
Today's strongest Nasdaq 100 performers. Sector leadership: Technology (9), Healthcare (1).
| Ticker | Company | Sector | Price | Day % | 1W % | 1M % | RSI | vs MA200 | Trend |
|---|---|---|---|---|---|---|---|---|---|
| ARM | Arm Holdings plc. ADR | Technology | $418.88 | +5.69% | +36.25% | +94.72% | 66.7 | +151.9% | Above MA20, MA50, MA200 |
| AMAT | Applied Materials Inc | Technology | $592.92 | +4.35% | +19.30% | +43.37% | 73.4 | +87.9% | Above MA20, MA50, MA200 |
| AVGO | Broadcom Inc | Technology | $392.90 | +4.30% | +5.59% | -6.61% | 46.1 | +9.3% | Above MA200 · Below MA20, MA50 |
| MRVL | Marvell Technology Inc | Technology | $289.54 | +3.90% | +14.63% | +71.40% | 61.2 | +158.9% | Above MA20, MA50, MA200 |
| ASML | ASML Holding NV | Technology | $1867.83 | +3.54% | +7.71% | +26.86% | 62.7 | +48.1% | Above MA20, MA50, MA200 |
| INTC | Intel Corp | Technology | $121.10 | +3.46% | +13.14% | +11.95% | 57.3 | +120.3% | Above MA20, MA50, MA200 |
| SNPS | Synopsys, Inc | Technology | $461.74 | +2.98% | +0.26% | -7.36% | 43.7 | +0.3% | Above MA200 · Below MA20, MA50 |
| MU | Micron Technology Inc | Technology | $1043.19 | +2.20% | +16.97% | +53.06% | 61.7 | +163.7% | Above MA20, MA50, MA200 |
| BIIB | Biogen Inc | Healthcare | $198.67 | +1.56% | +2.28% | +3.52% | 55.2 | +13.9% | Above MA20, MA50, MA200 |
| LRCX | Lam Research Corp | Technology | $374.18 | +1.31% | +16.28% | +34.62% | 65.6 | +79.4% | Above MA20, MA50, MA200 |
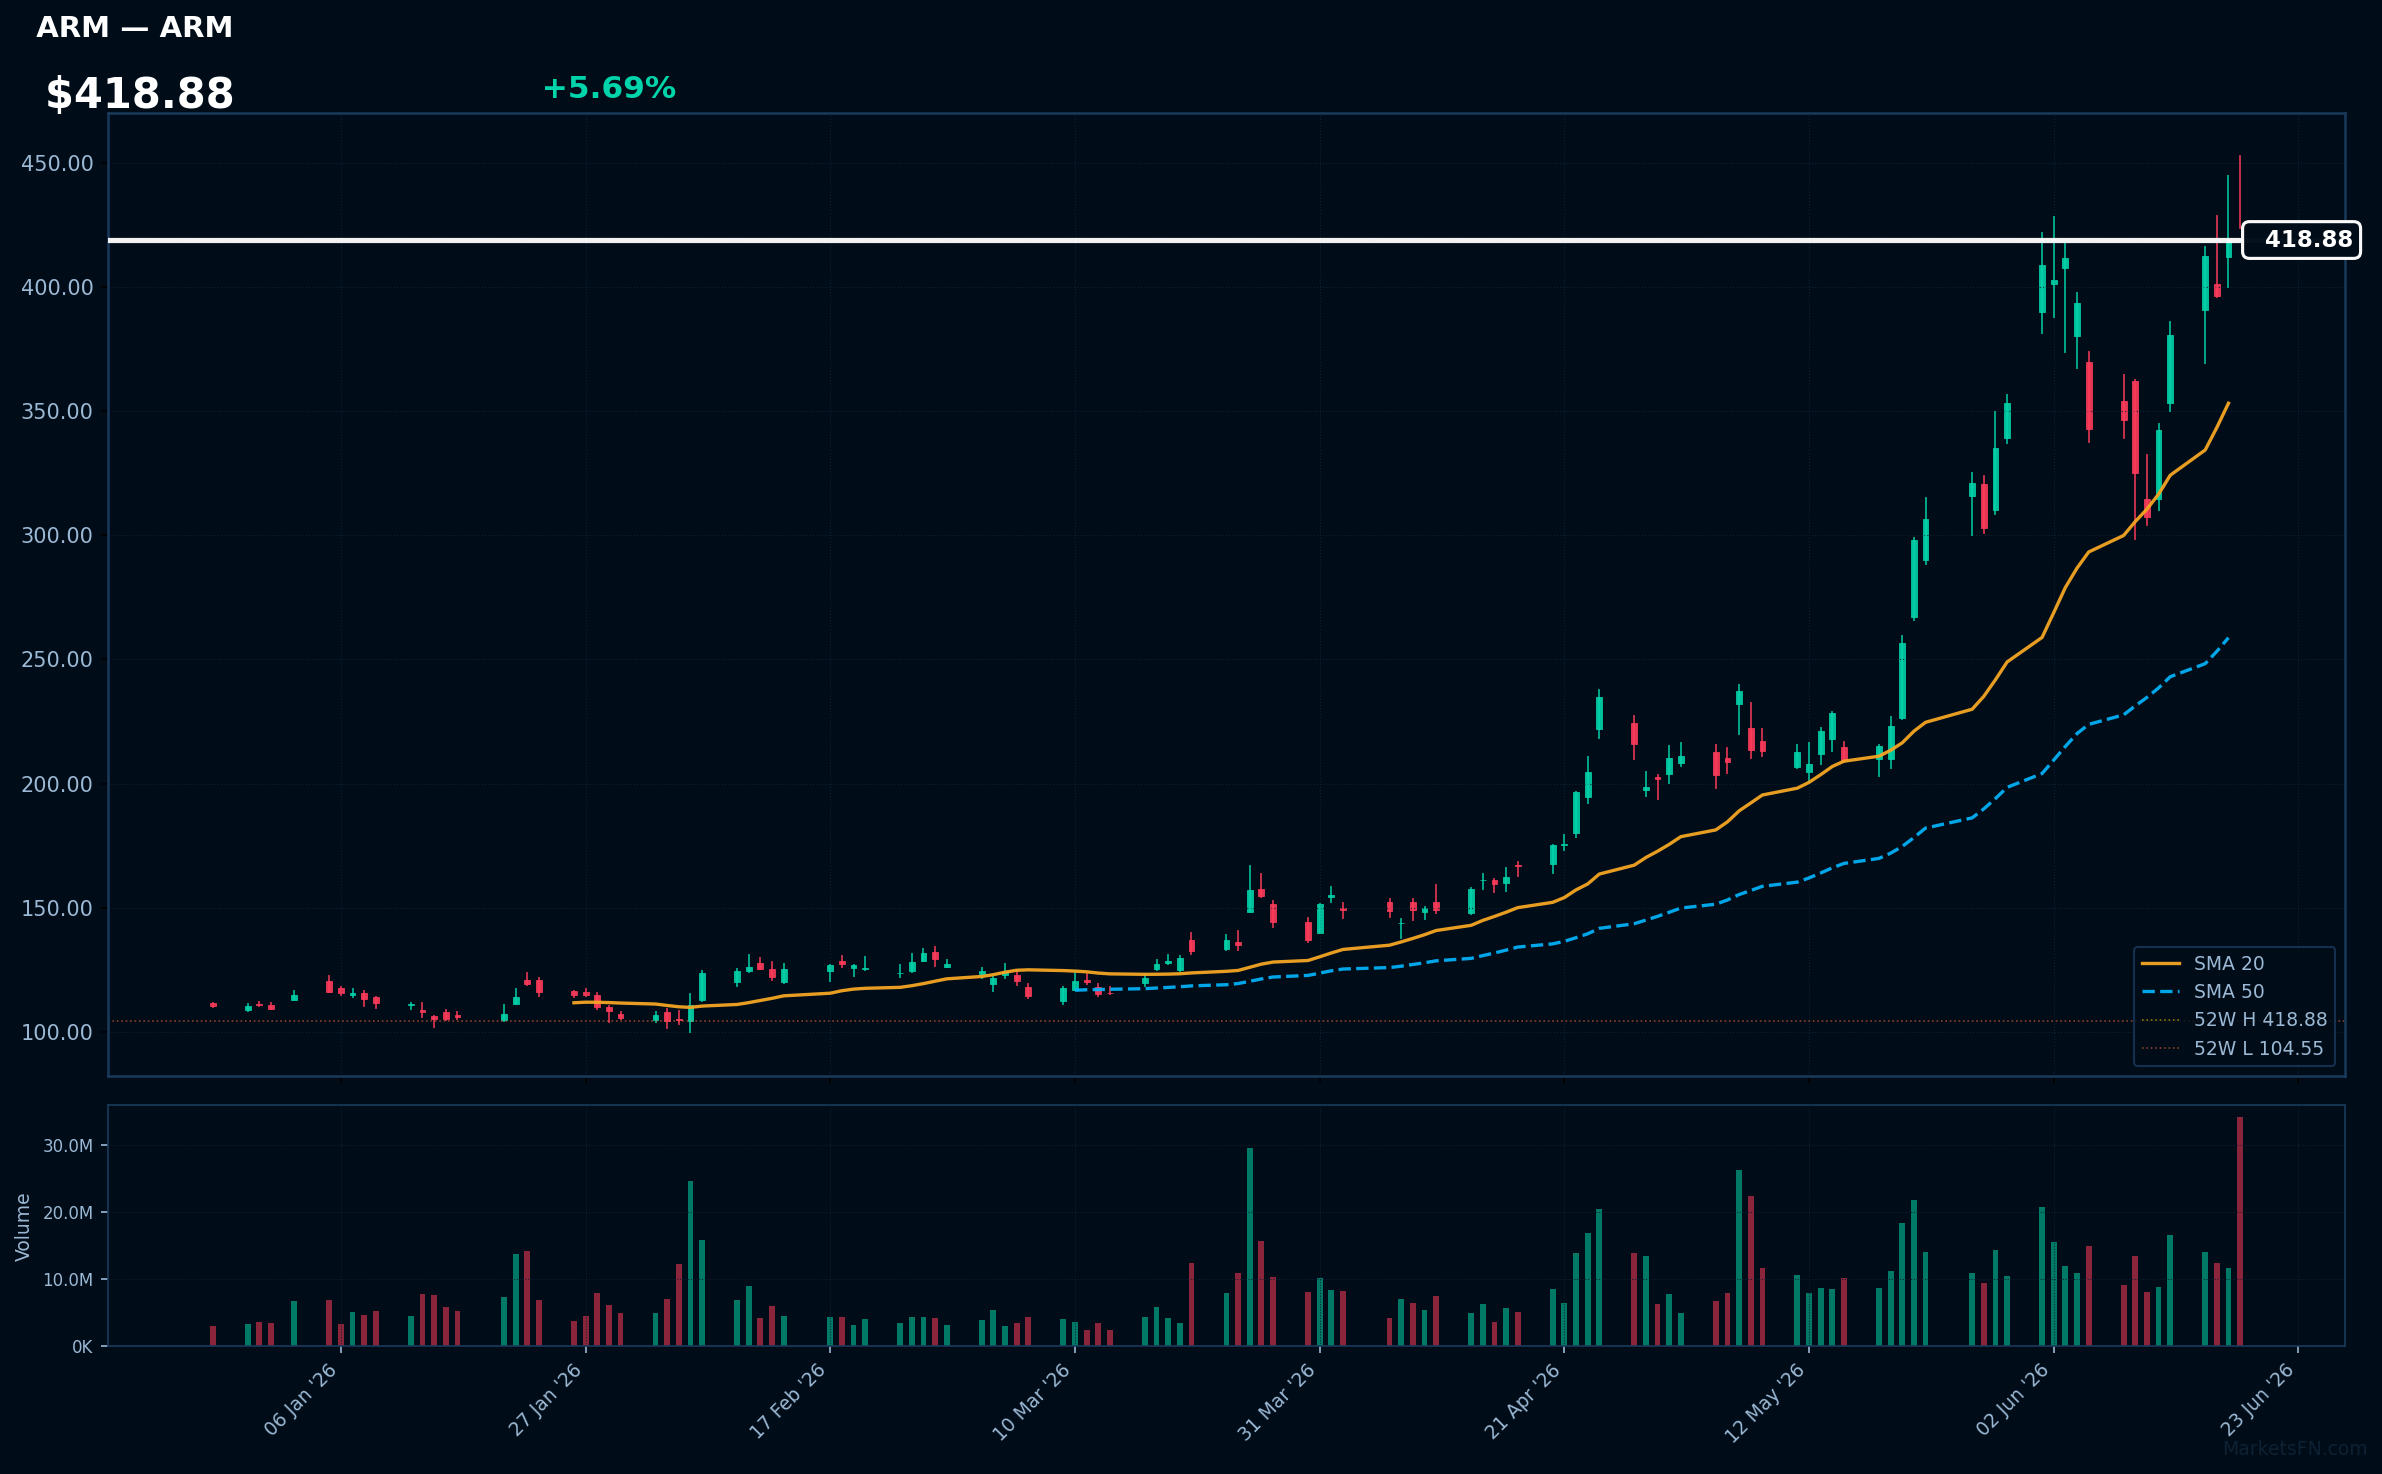
ARM | Arm Holdings plc. ADR | Technology | Price: $418.88 | Day: +5.69% | 1W: +36.25% | 1M: +94.72% | RSI: 66.7 | vs MA200: +151.9% | Trend: Above MA20, MA50, MA200
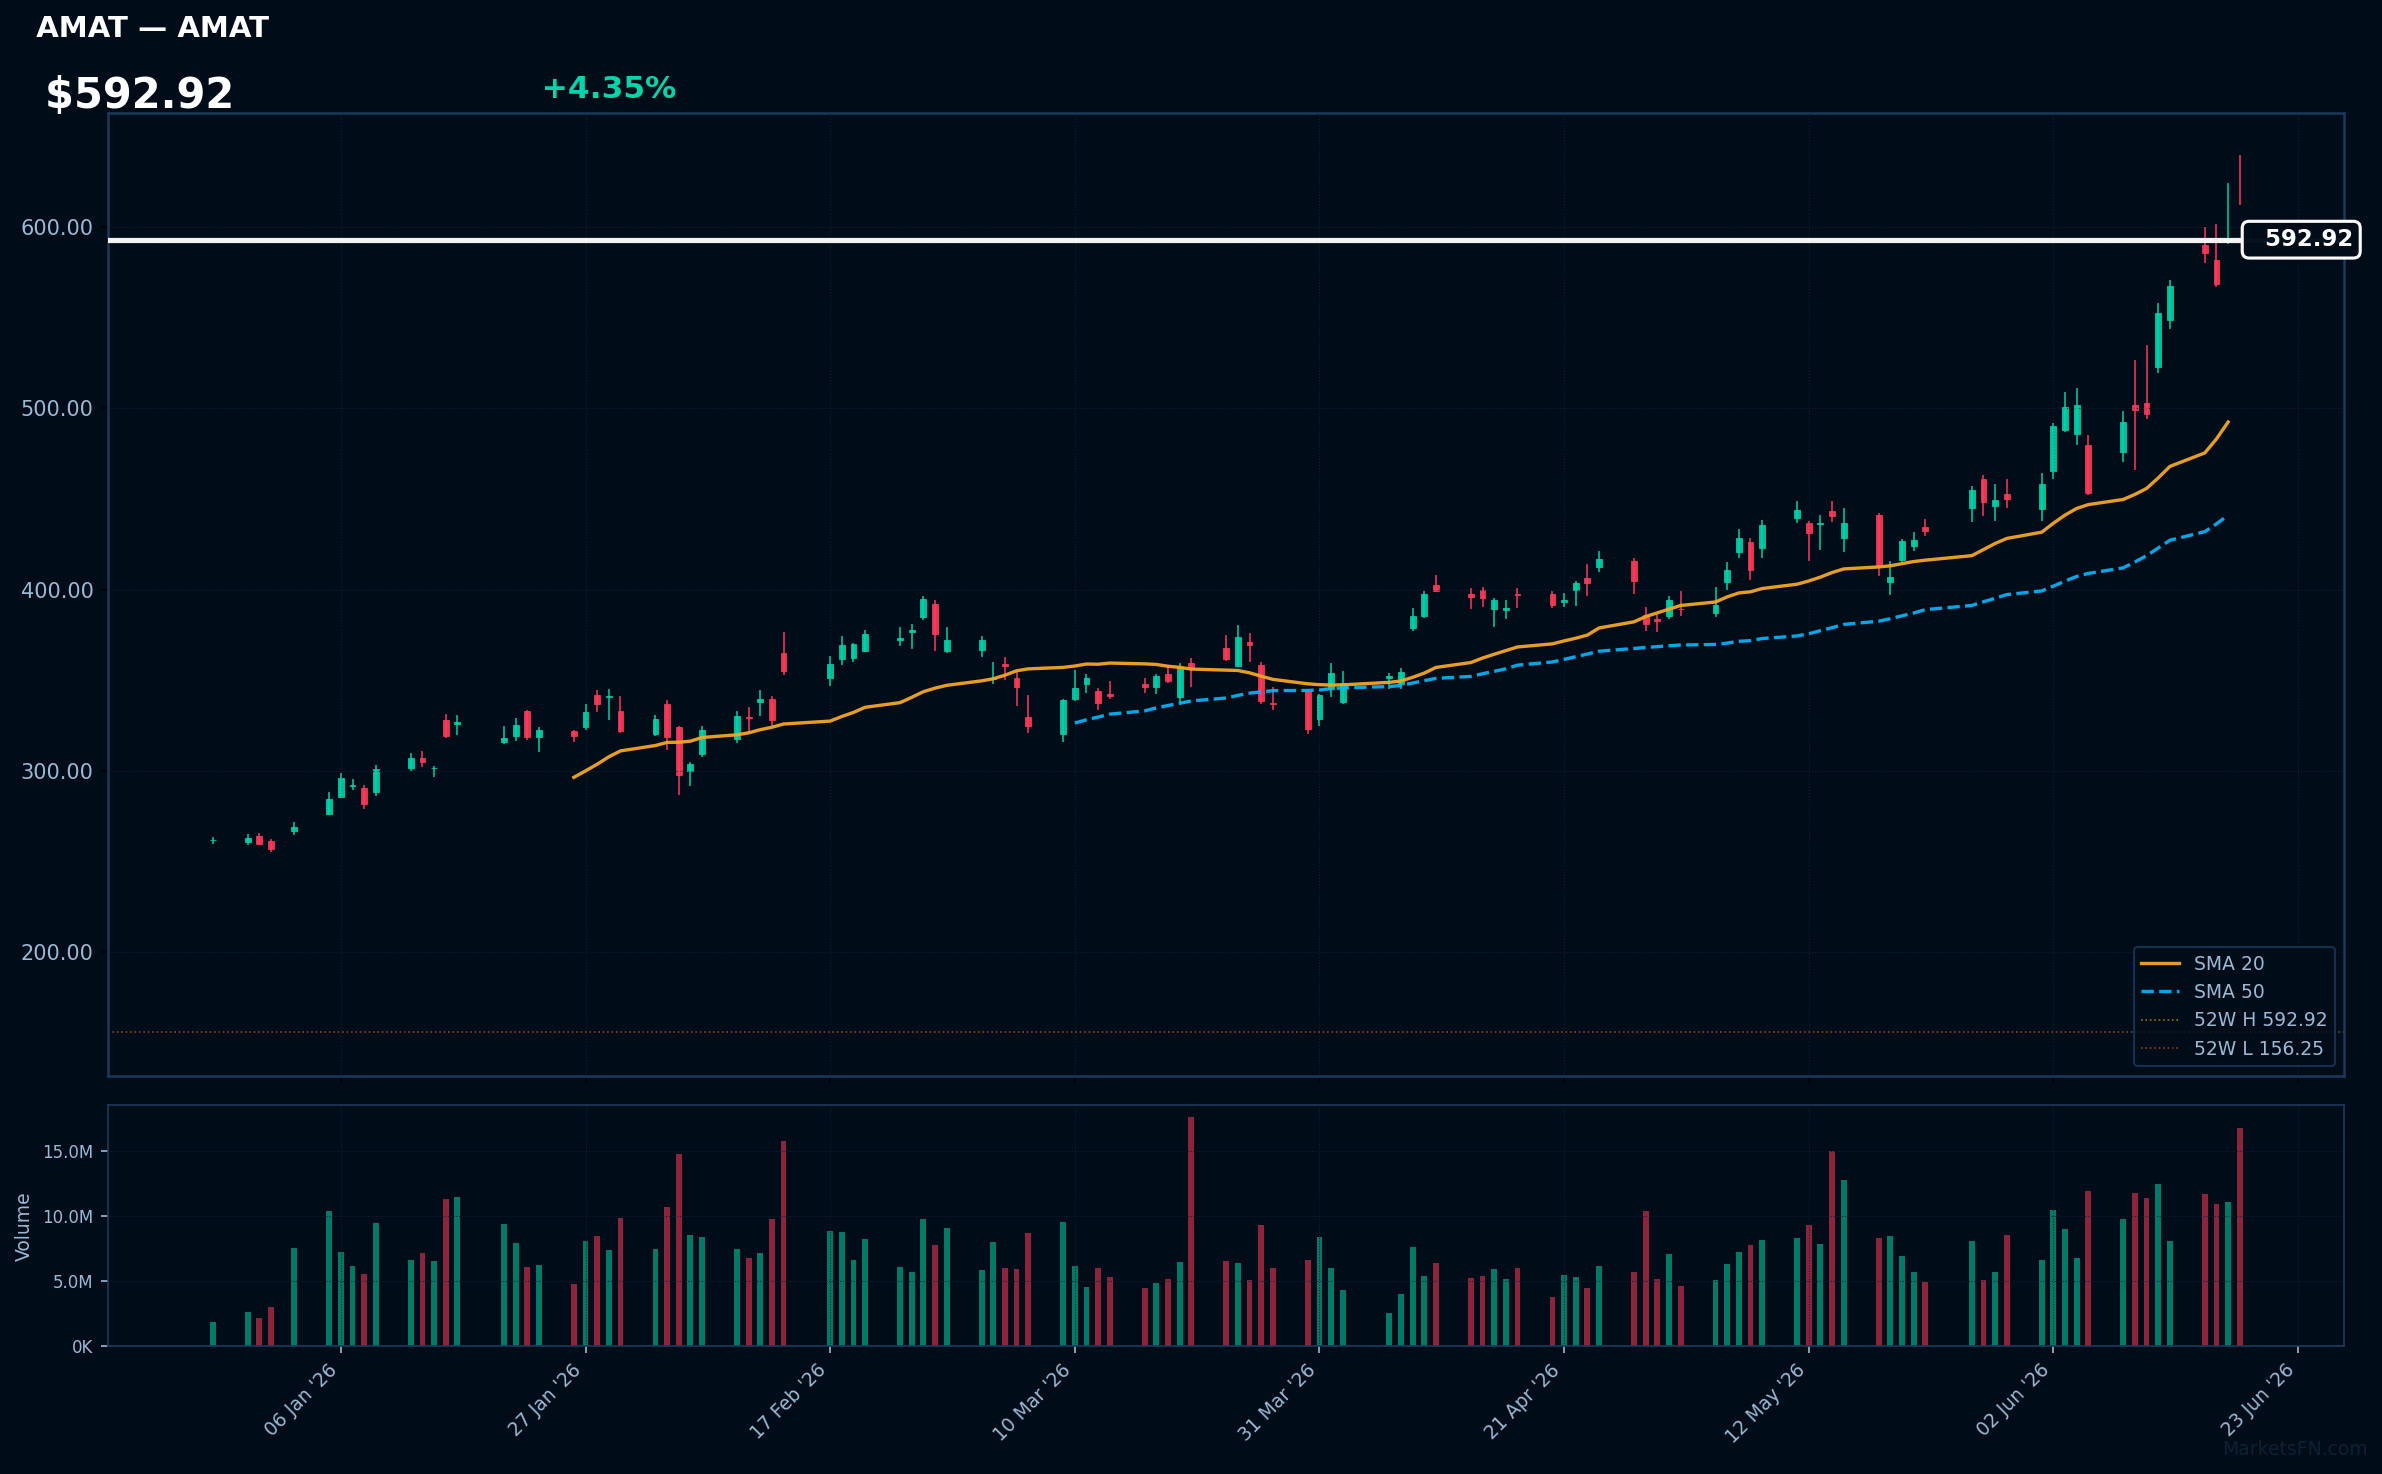
AMAT | Applied Materials Inc | Technology | Price: $592.92 | Day: +4.35% | 1W: +19.30% | 1M: +43.37% | RSI: 73.4 | vs MA200: +87.9% | Trend: Above MA20, MA50, MA200
Recent headlines (last 12h)
- US Tells ASML Its Concerned China May Have Top Chip Tool
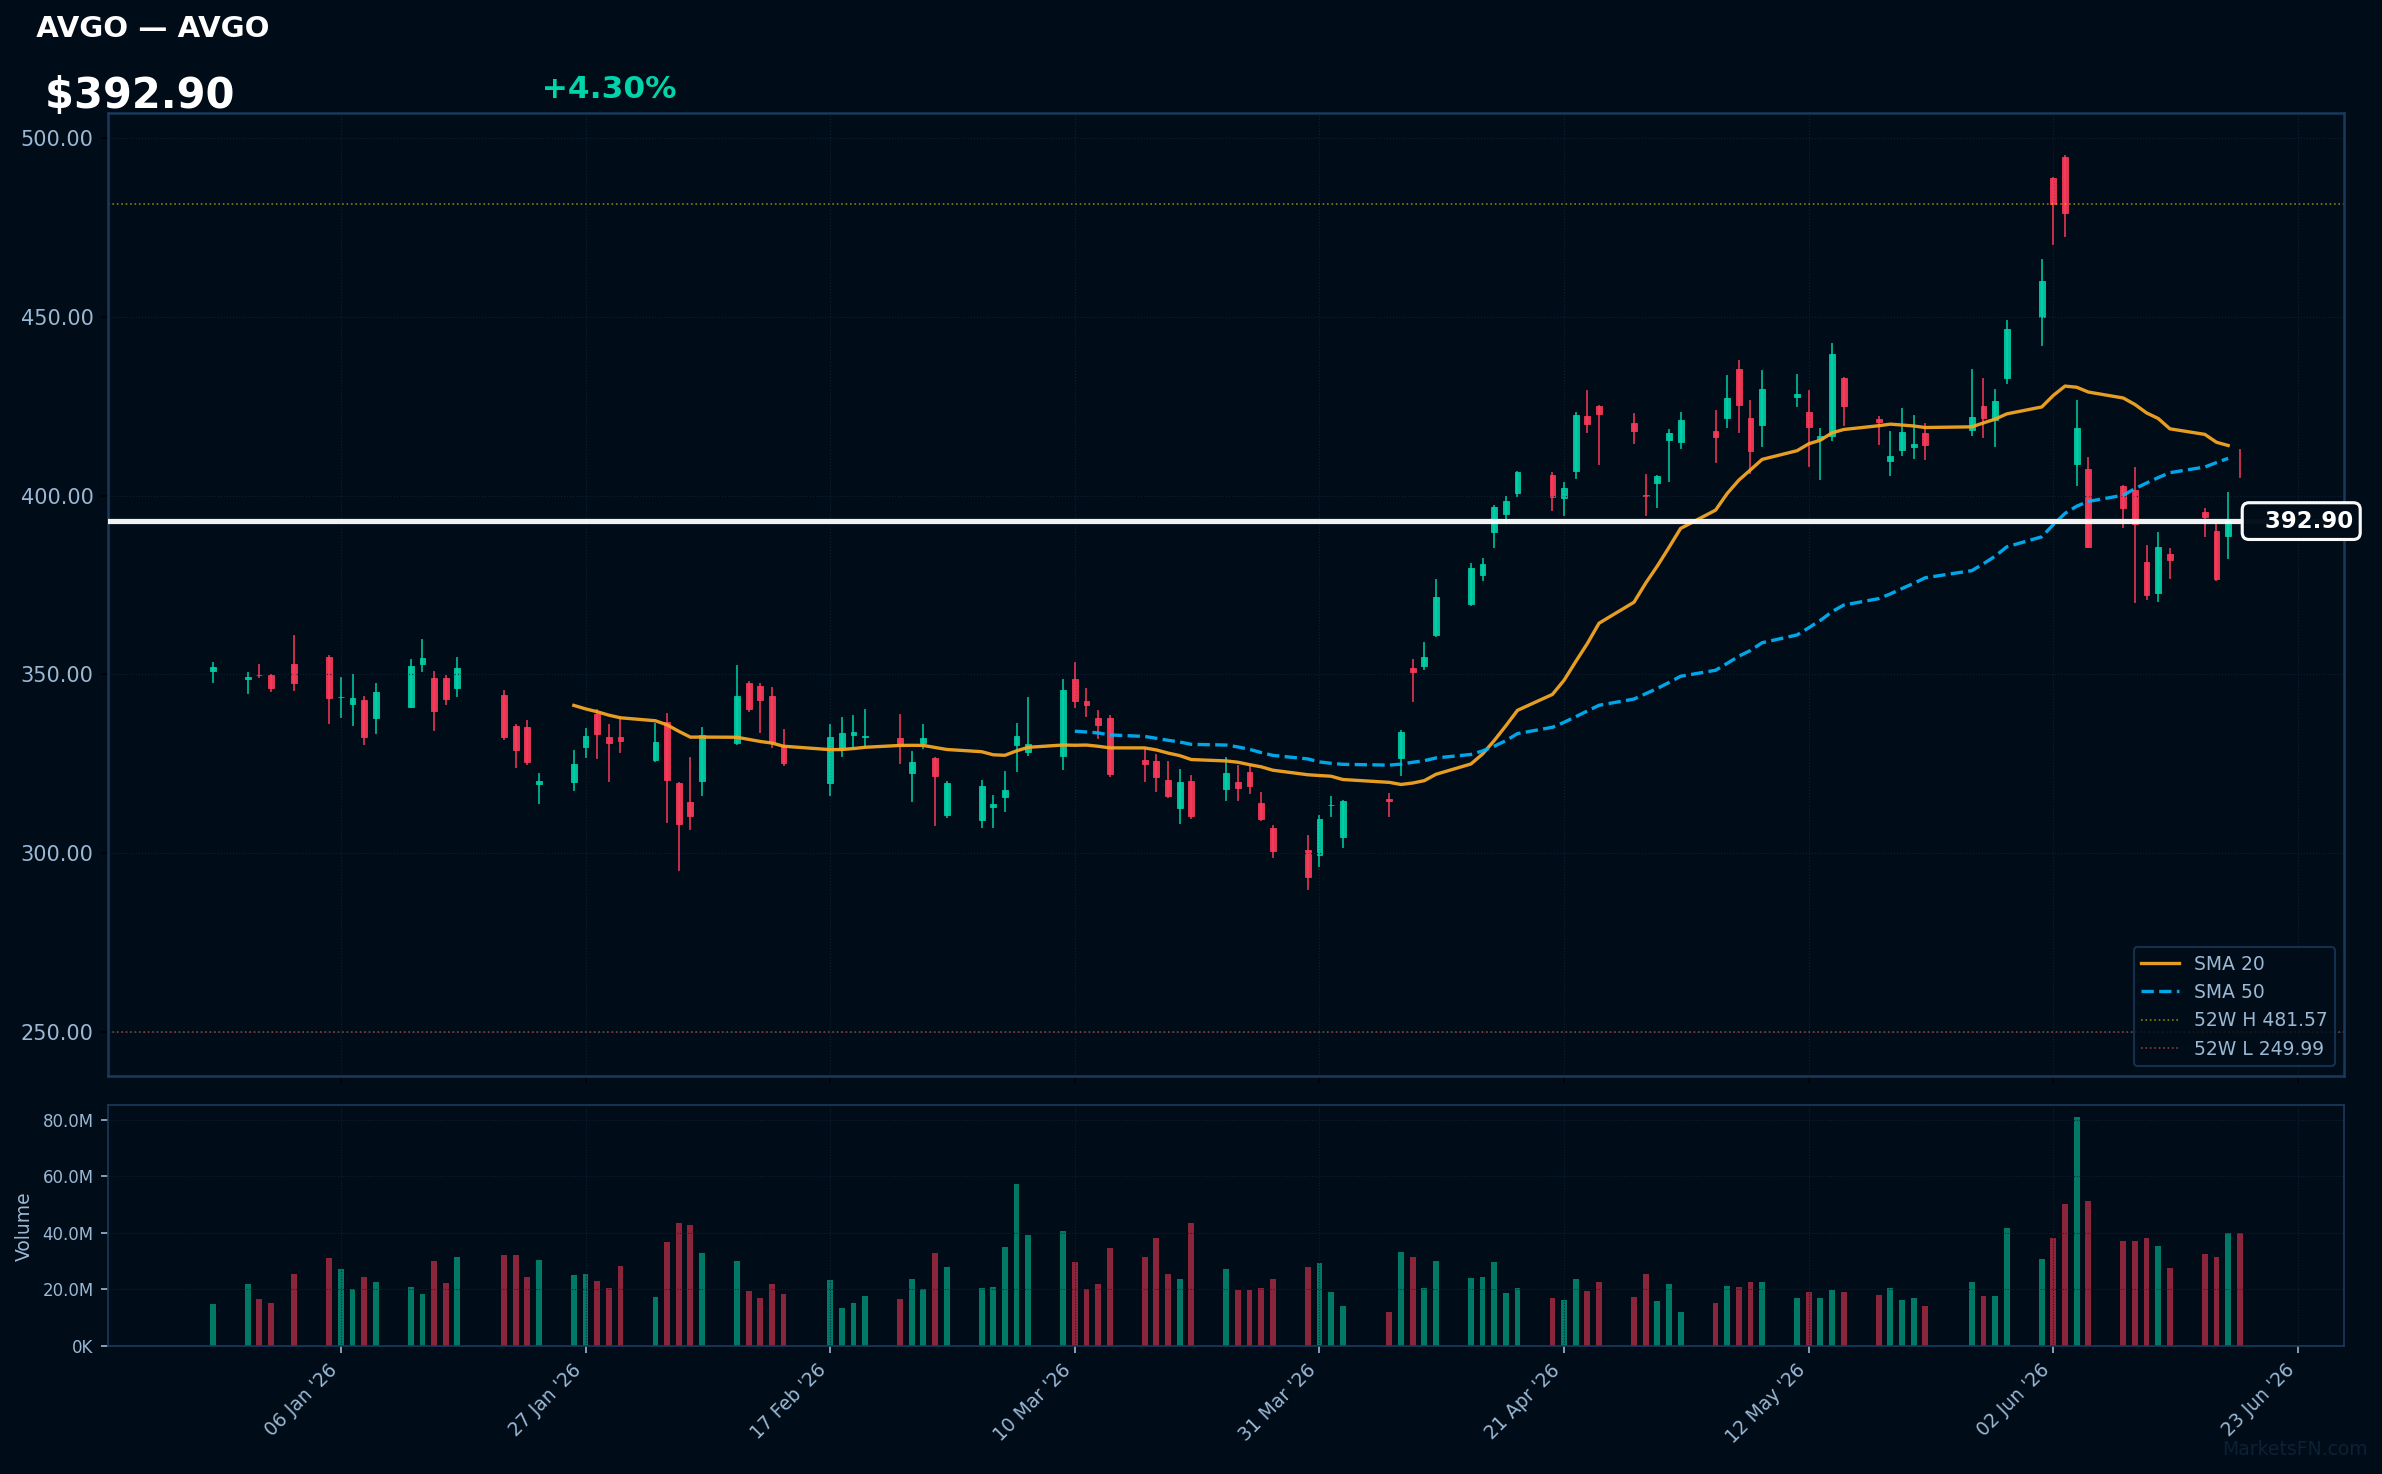
AVGO | Broadcom Inc | Technology | Price: $392.90 | Day: +4.30% | 1W: +5.59% | 1M: -6.61% | RSI: 46.1 | vs MA200: +9.3% | Trend: Above MA200 · Below MA20, MA50
Recent headlines (last 12h)
- Intel Leads Big Chip Stock Rally
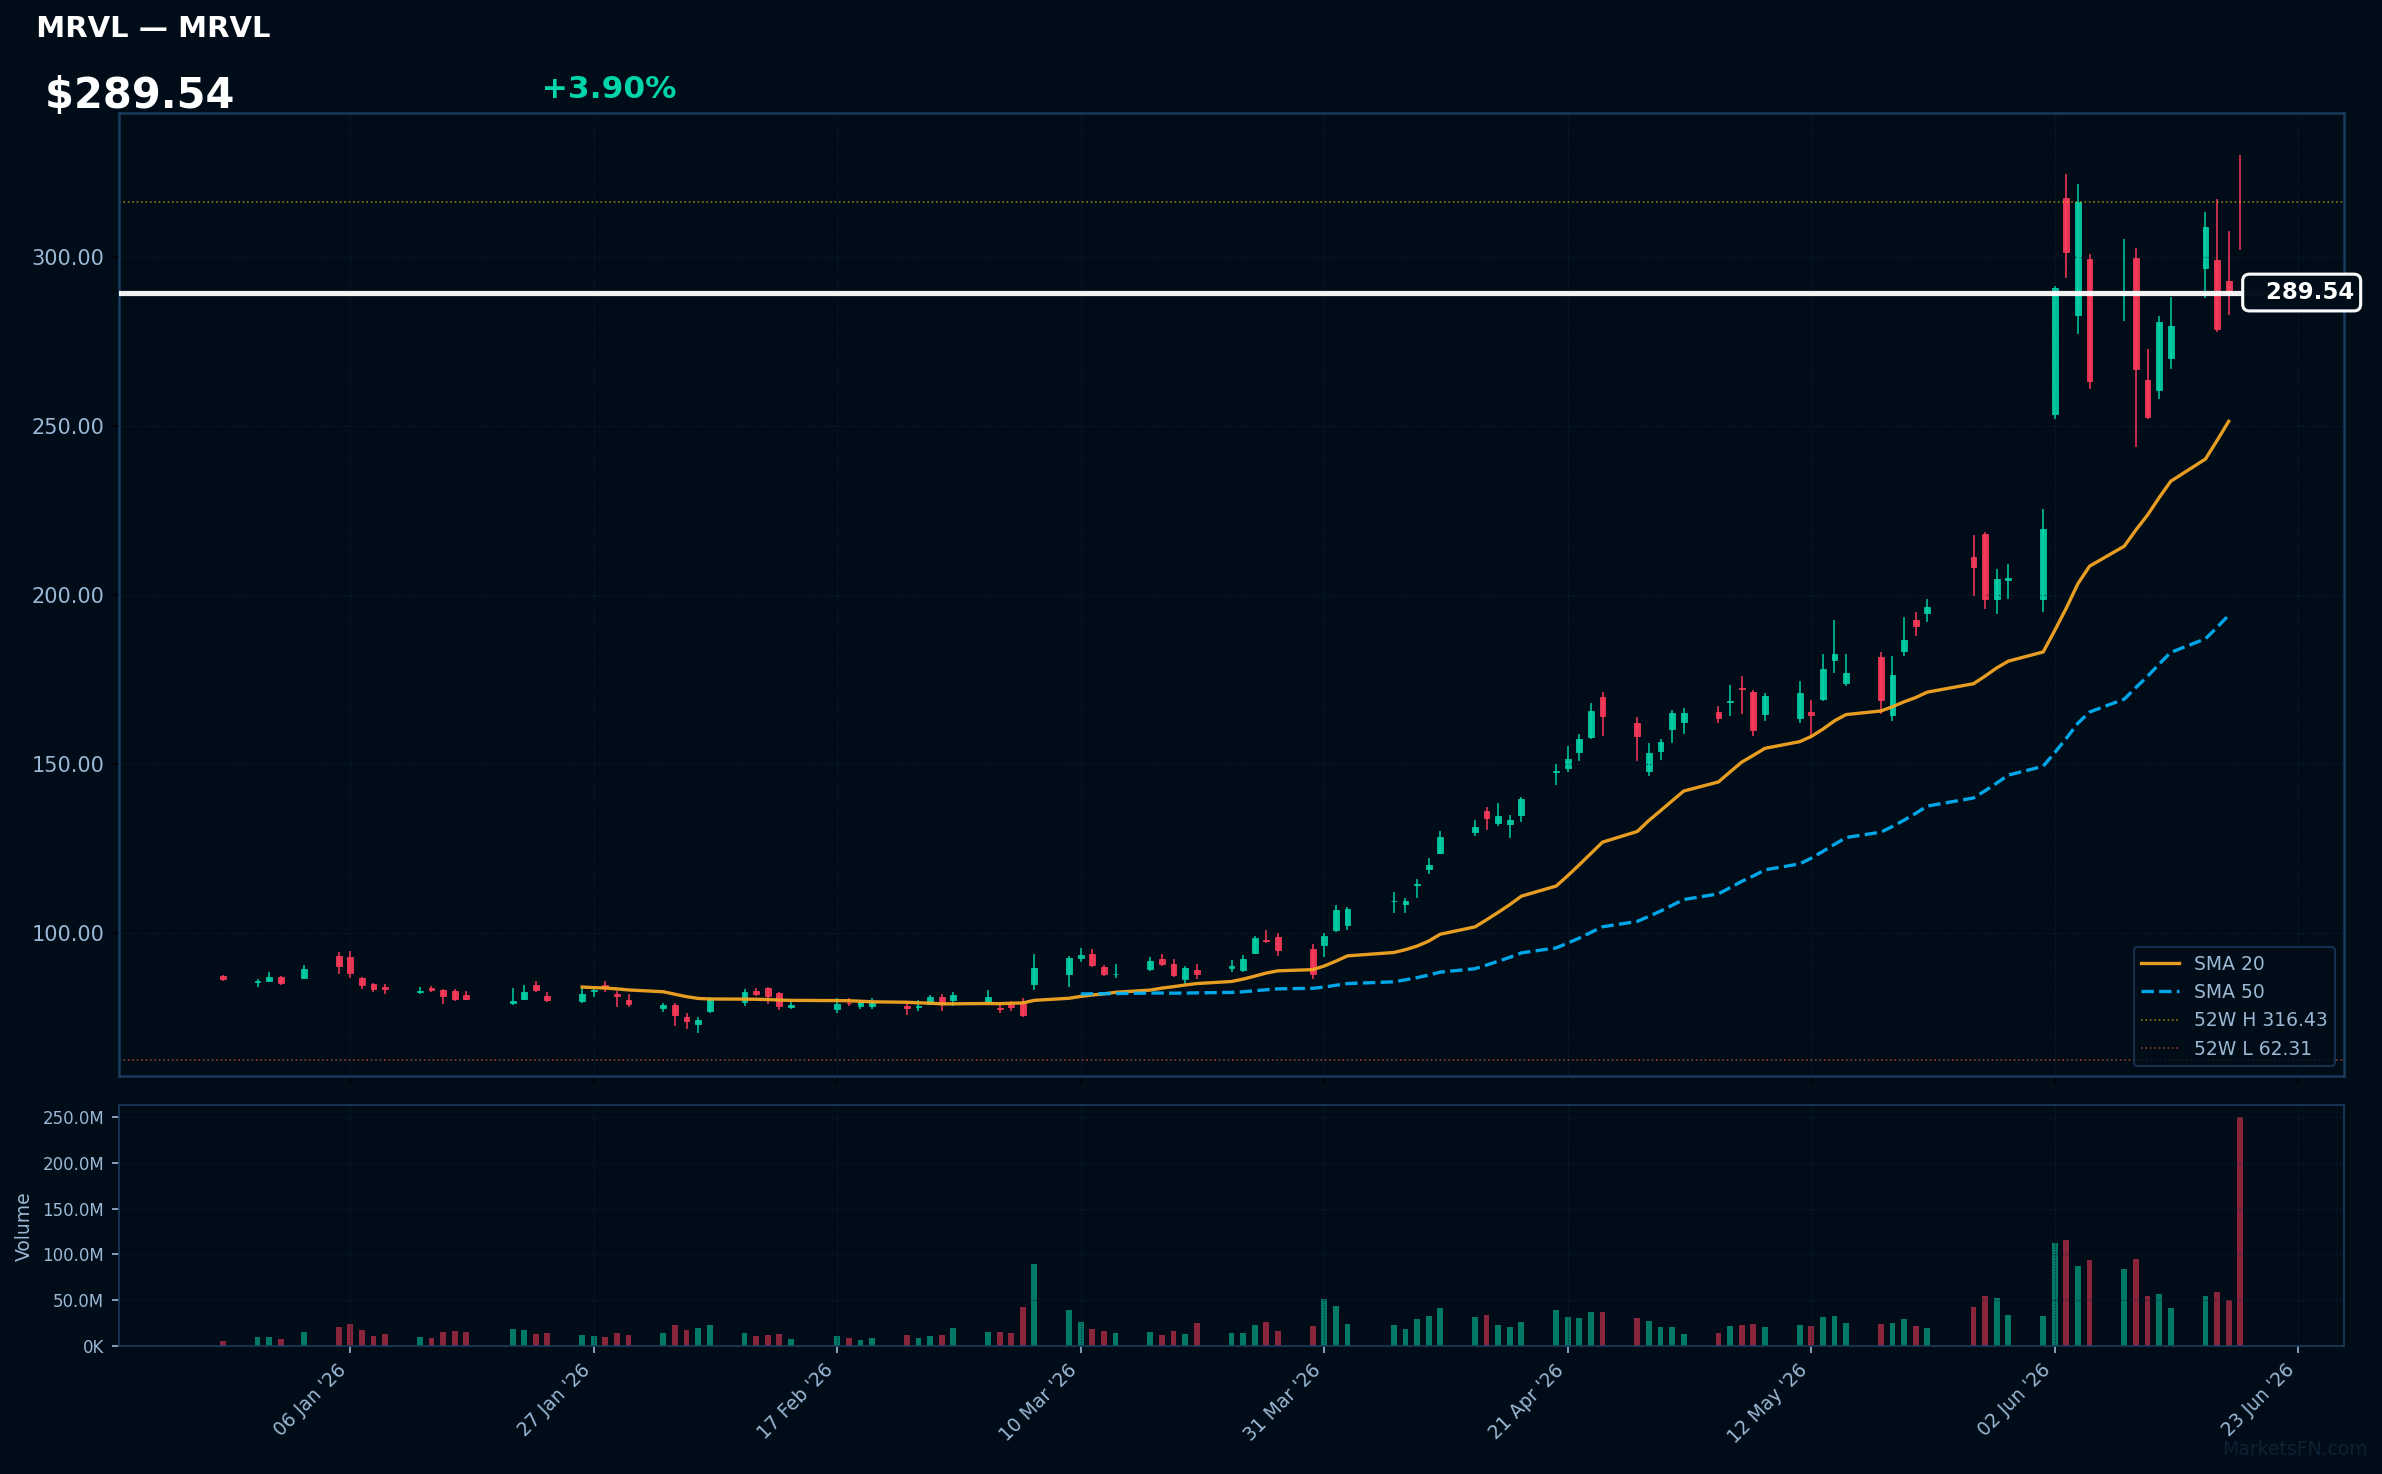
MRVL | Marvell Technology Inc | Technology | Price: $289.54 | Day: +3.90% | 1W: +14.63% | 1M: +71.40% | RSI: 61.2 | vs MA200: +158.9% | Trend: Above MA20, MA50, MA200
ASML | ASML Holding NV | Technology | Price: $1867.83 | Day: +3.54% | 1W: +7.71% | 1M: +26.86% | RSI: 62.7 | vs MA200: +48.1% | Trend: Above MA20, MA50, MA200
Recent headlines (last 12h)
- Stocks Slide as Iran Nuclear Talks Hit Early Snag: Markets Wrap
- ASML faces US questions over whether advanced chipmaking tool reached China, Bloomberg reports
- Washington Warns ASML
- US Tells ASML Its Concerned China May Have Top Chip Tool
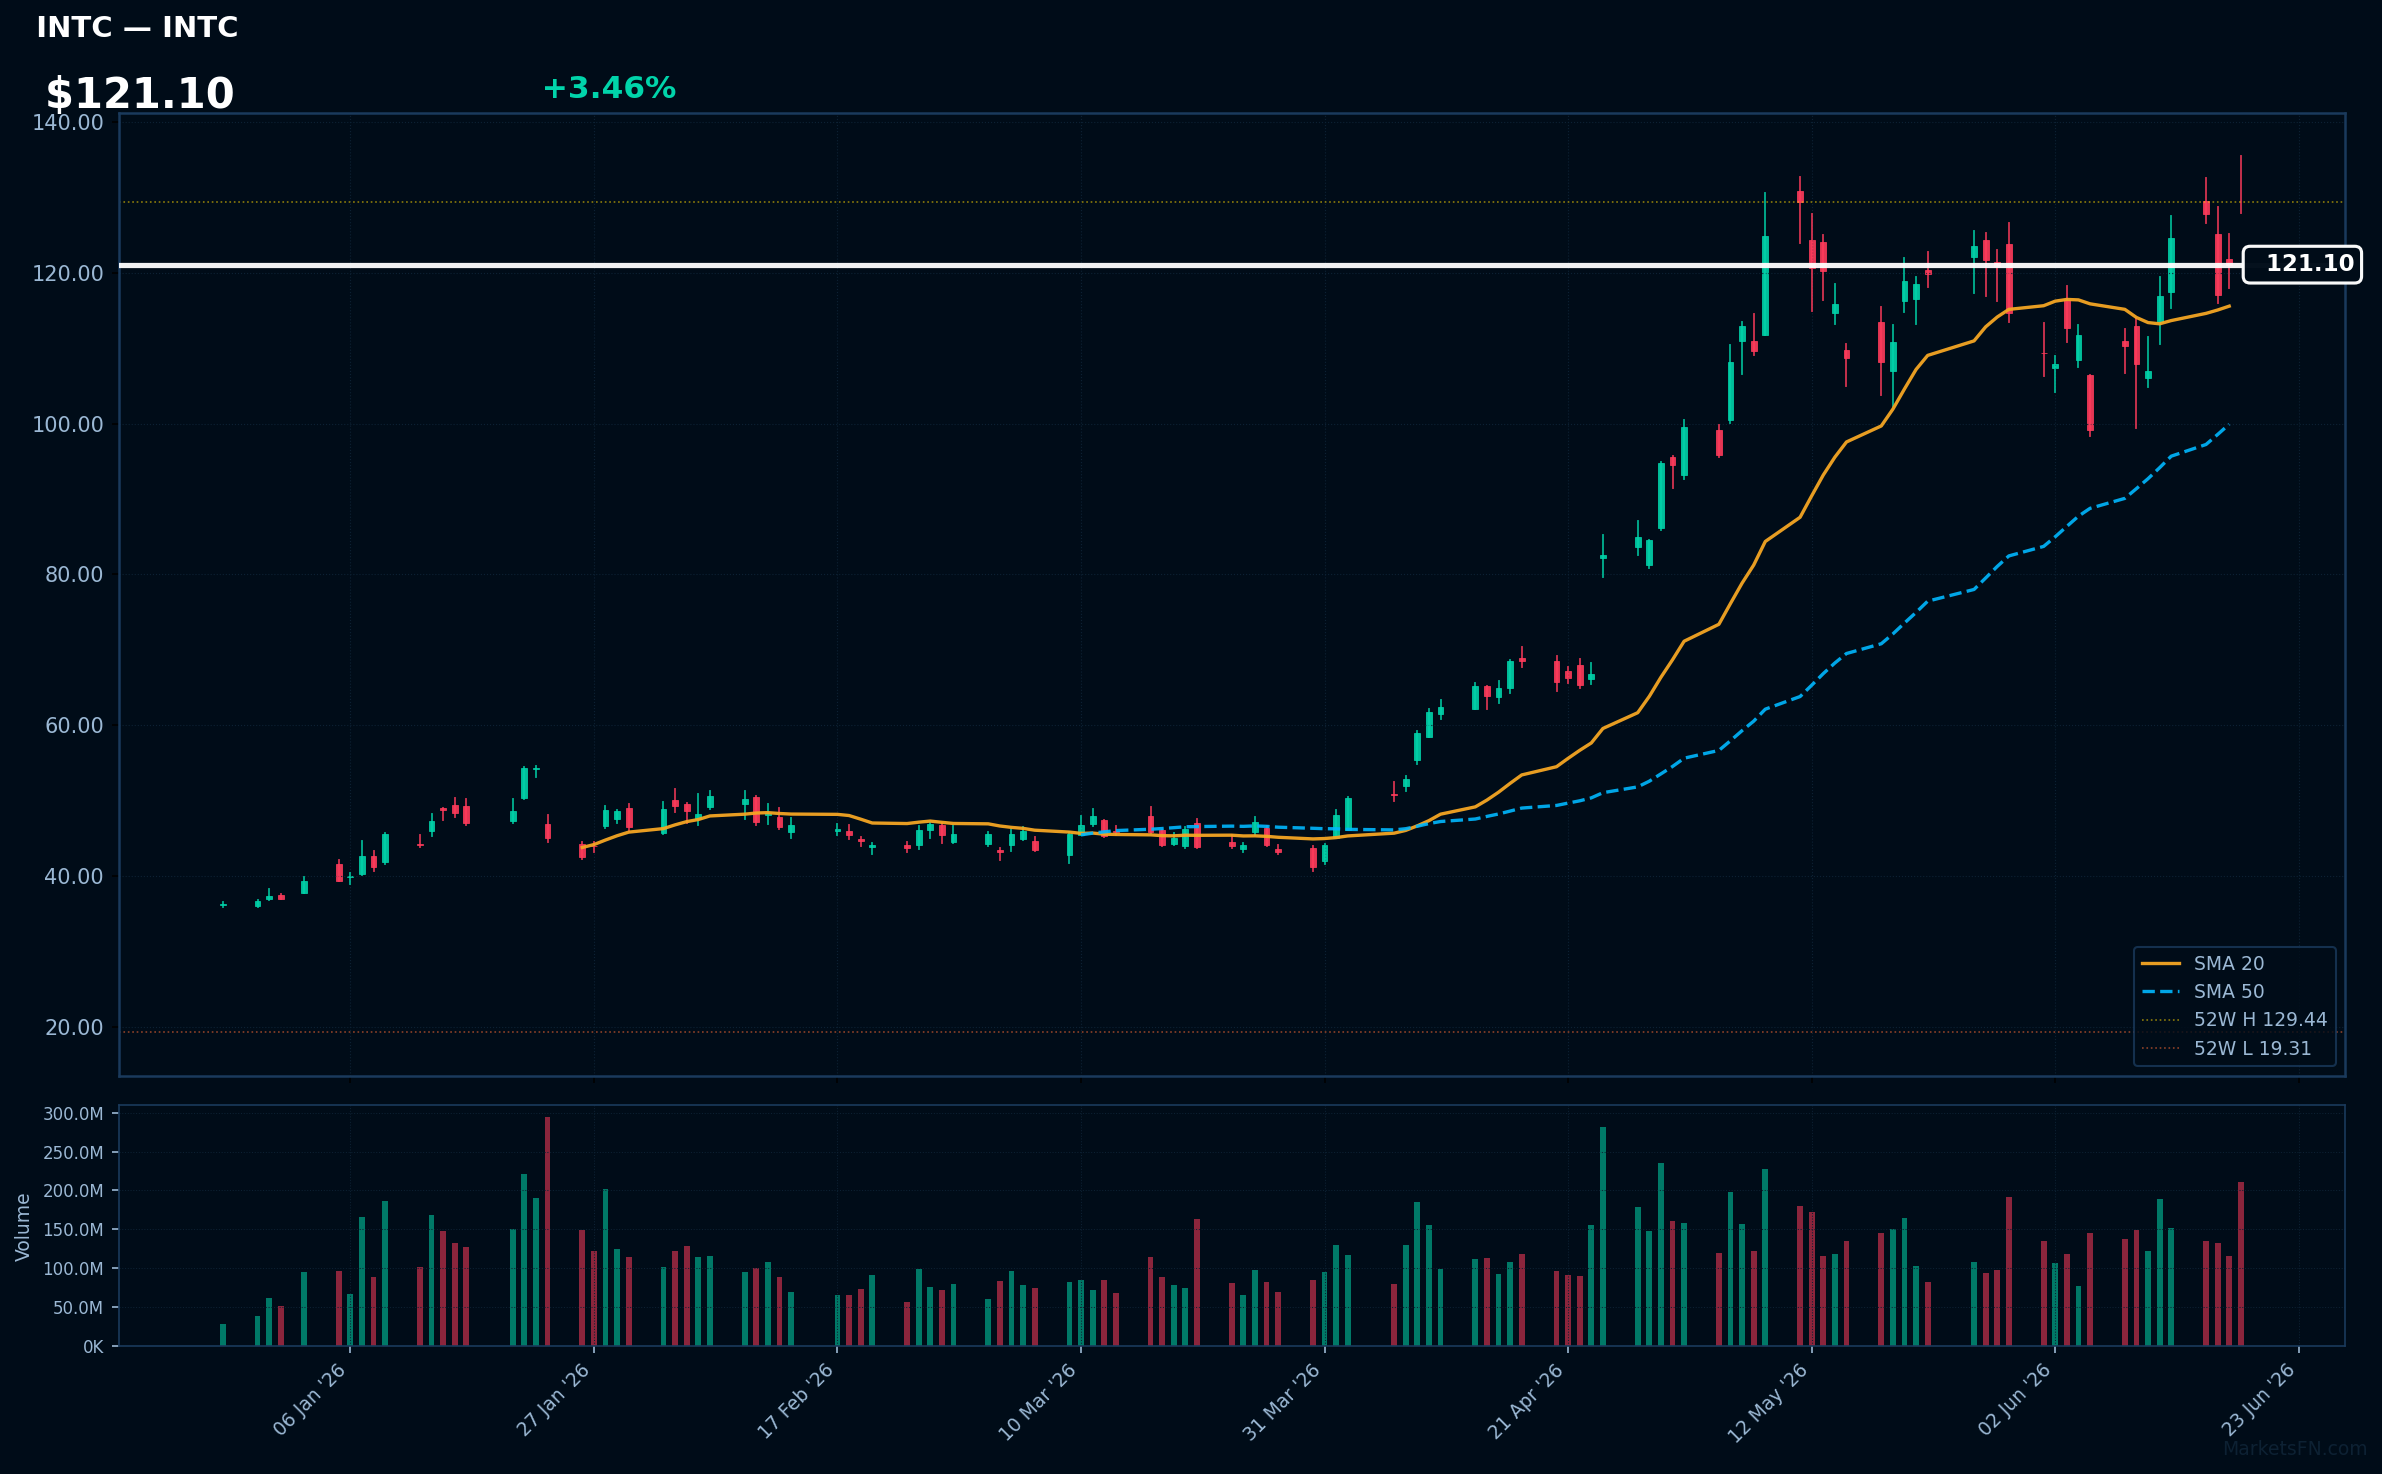
INTC | Intel Corp | Technology | Price: $121.10 | Day: +3.46% | 1W: +13.14% | 1M: +11.95% | RSI: 57.3 | vs MA200: +120.3% | Trend: Above MA20, MA50, MA200
Recent headlines (last 12h)
- Why Intel Hired the Former CEO of Micron's Big Rival SK Hynix
- Trump Handed Intel Stock a 10% Pop, but Markets Are Hedging
- Intel Leads Big Chip Stock Rally
- SpaceX Stock Gains the Size of Intel Since IPO. History Has a Warning.
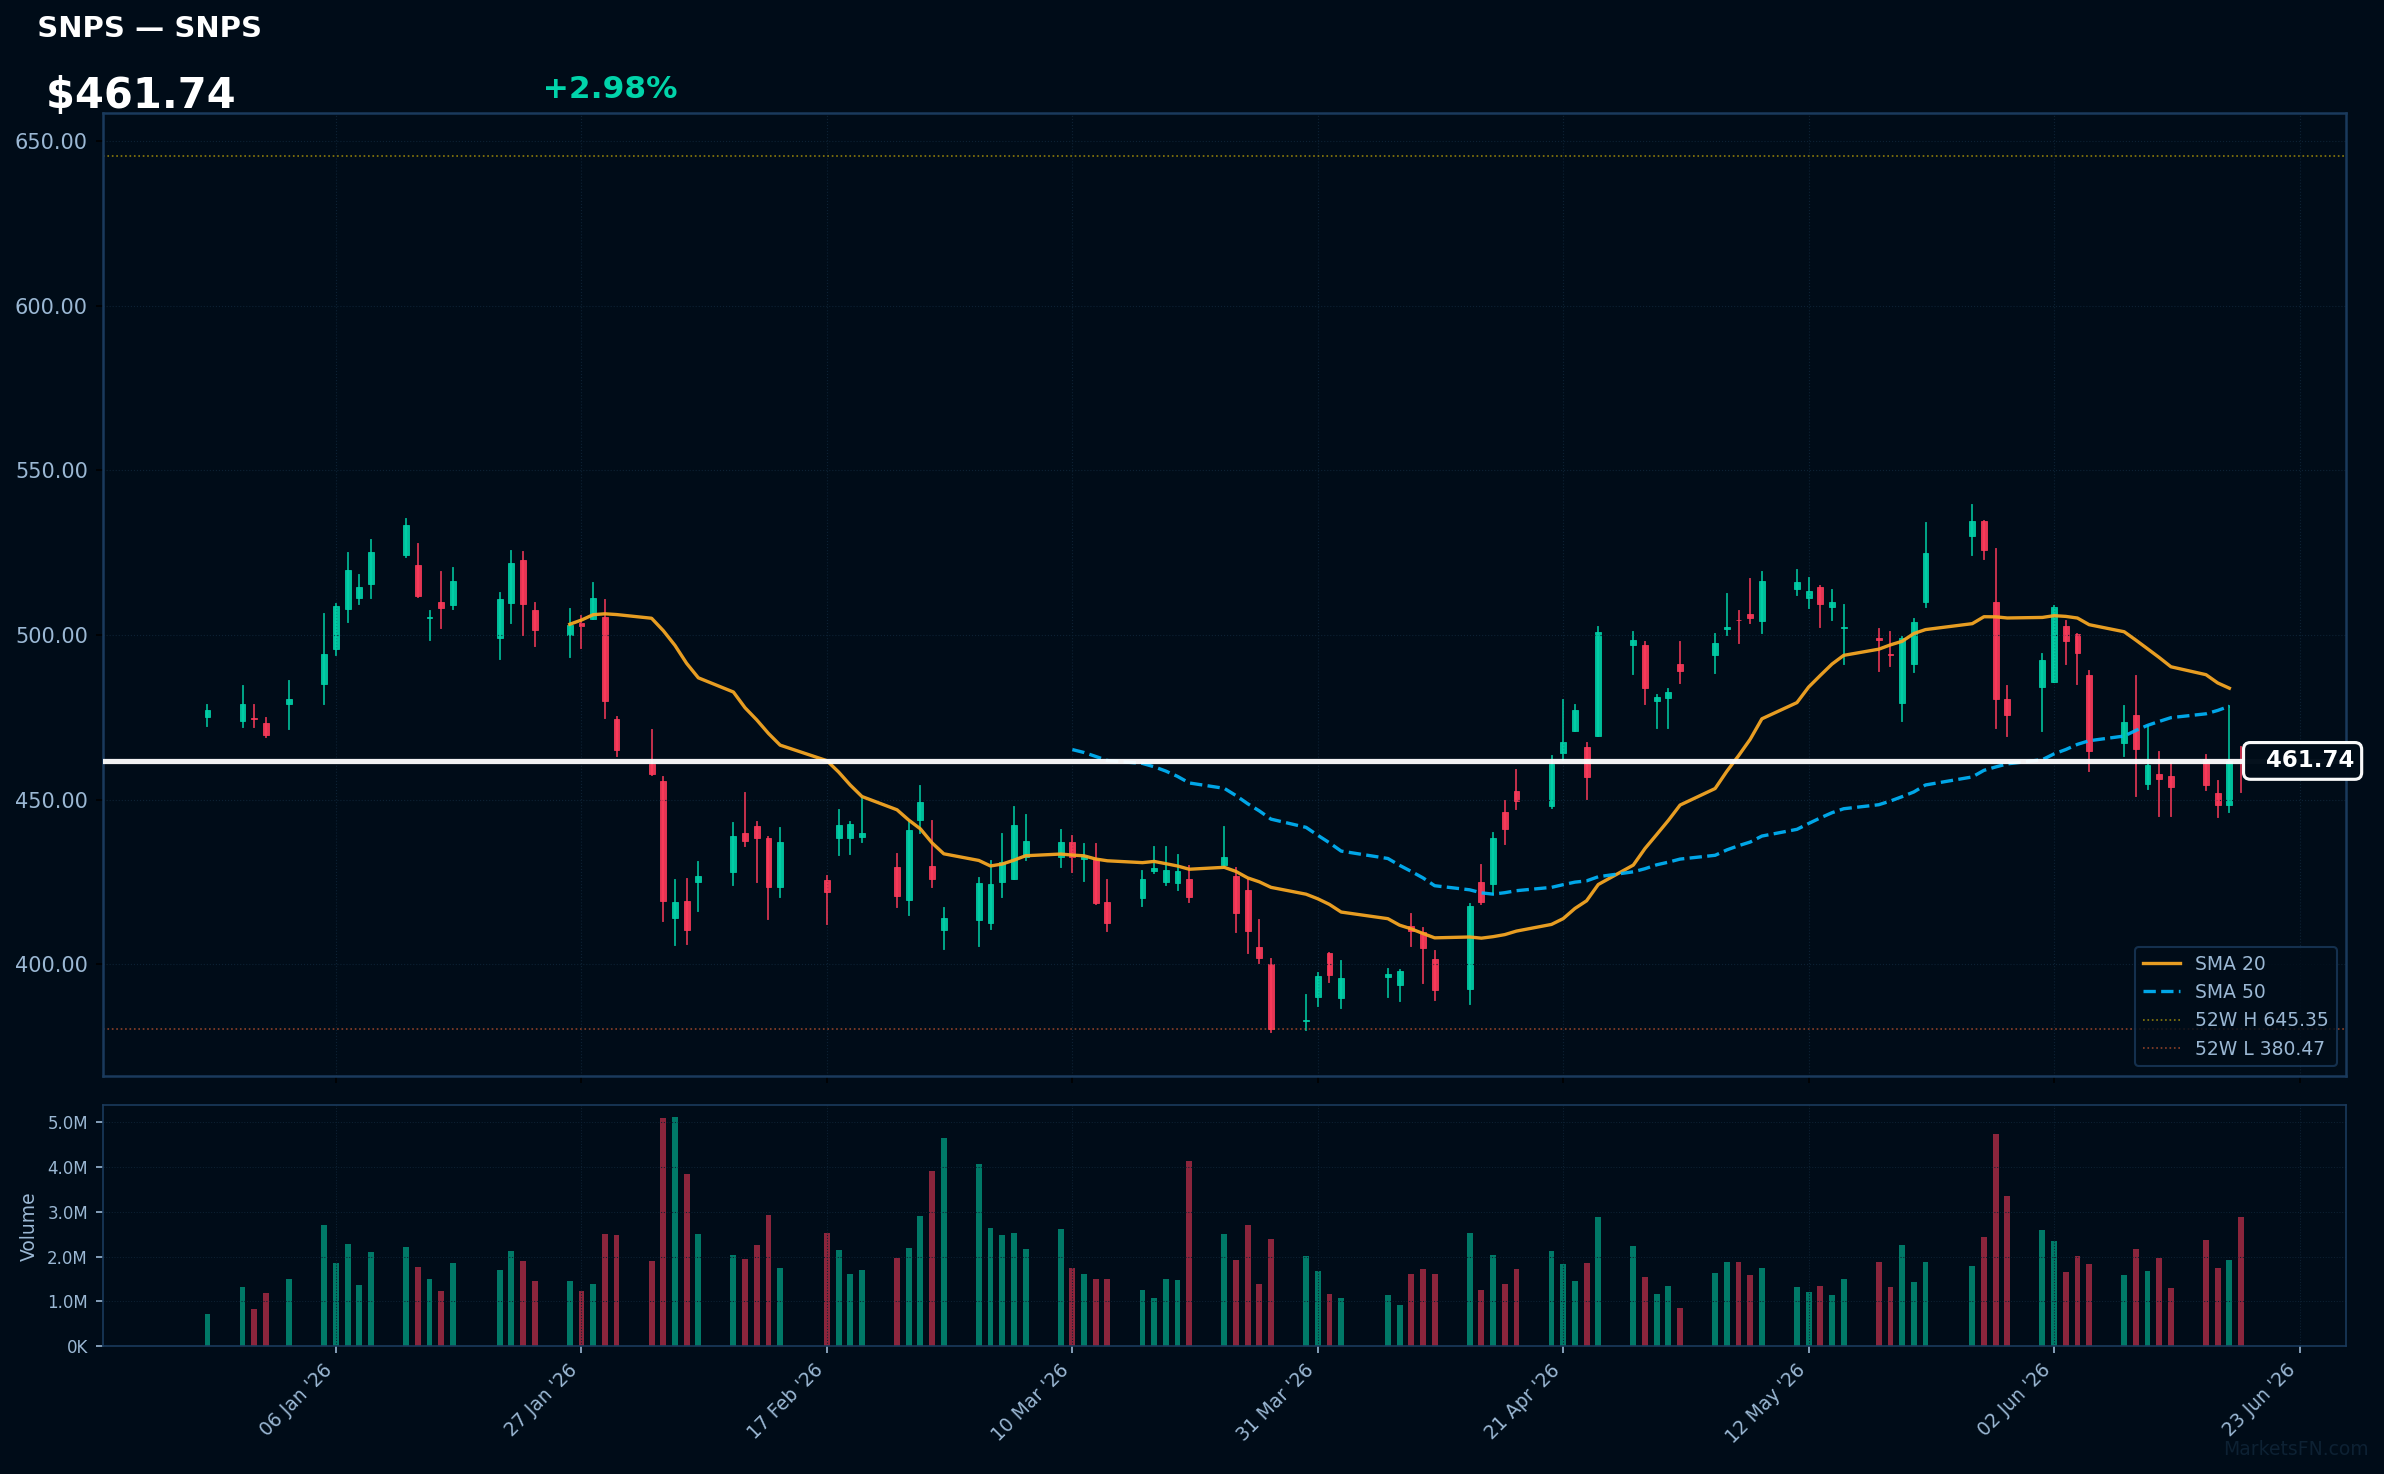
SNPS | Synopsys, Inc | Technology | Price: $461.74 | Day: +2.98% | 1W: +0.26% | 1M: -7.36% | RSI: 43.7 | vs MA200: +0.3% | Trend: Above MA200 · Below MA20, MA50
MU | Micron Technology Inc | Technology | Price: $1043.19 | Day: +2.20% | 1W: +16.97% | 1M: +53.06% | RSI: 61.7 | vs MA200: +163.7% | Trend: Above MA20, MA50, MA200
Recent headlines (last 12h)
- Why Intel Hired the Former CEO of Micron's Big Rival SK Hynix
- Micron Earnings Seen as Key Test for AI-Driven Market Rally (MU)
- Intel Leads Big Chip Stock Rally
- Micron Stock Faces Tough Earnings Test. What History Shows Happens Next.
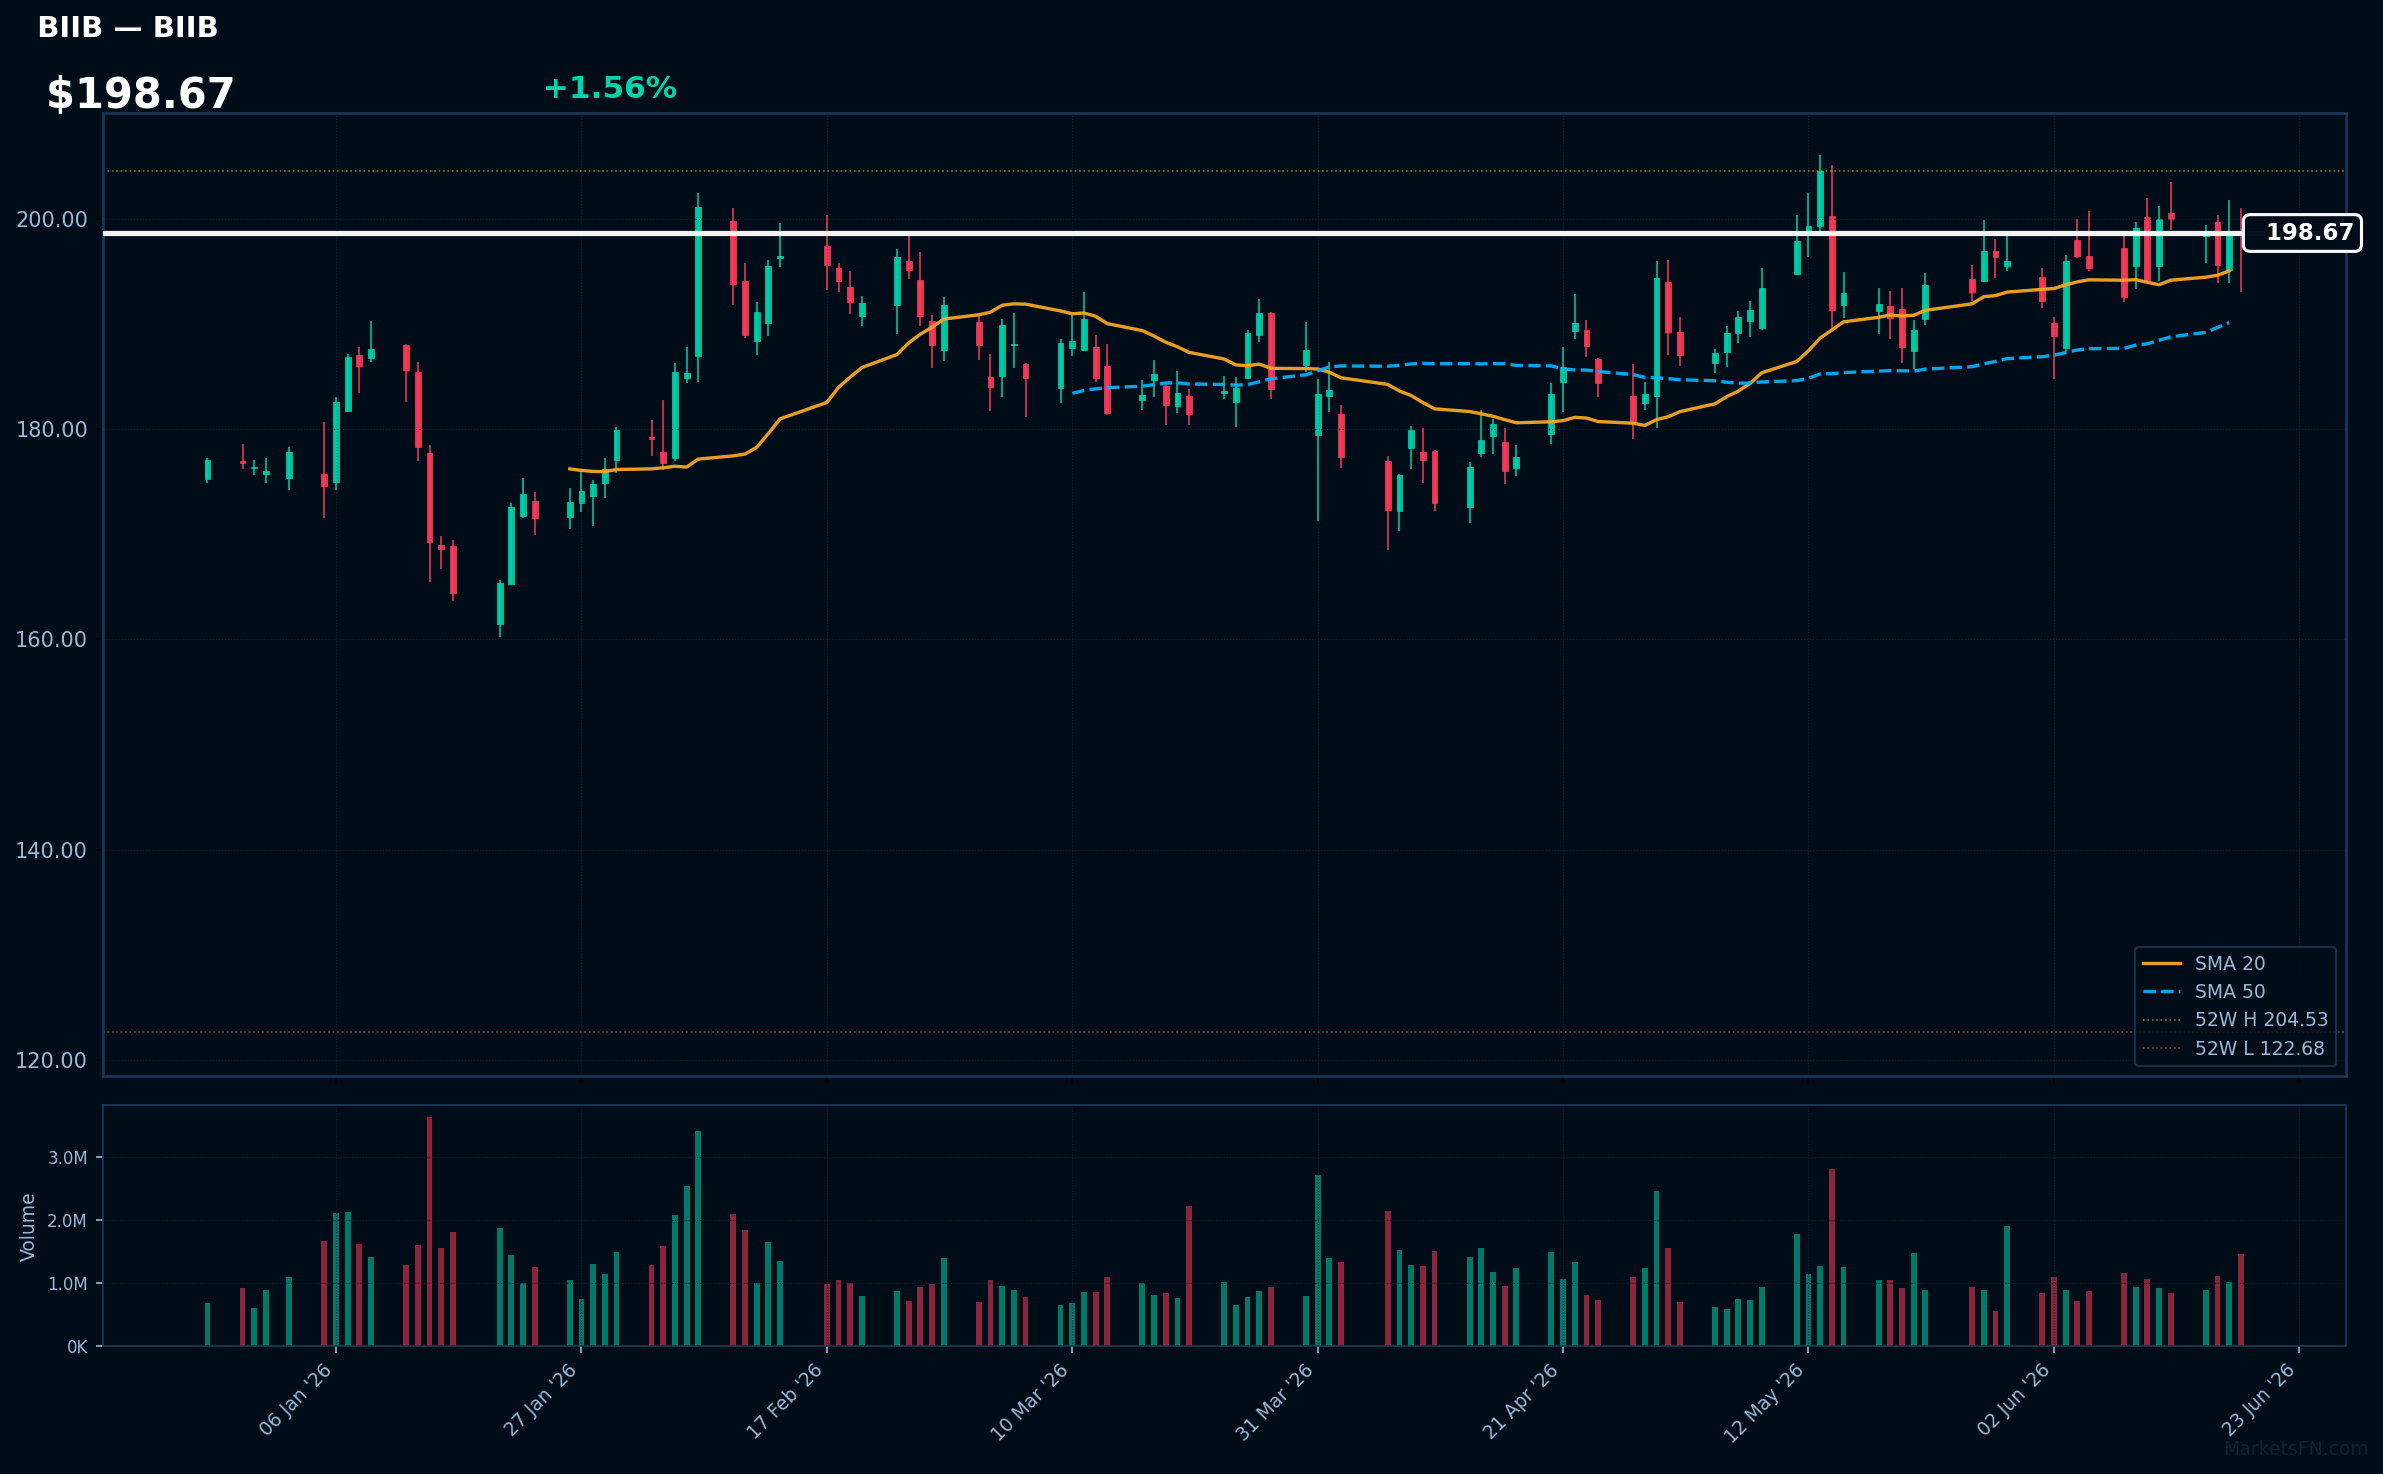
BIIB | Biogen Inc | Healthcare | Price: $198.67 | Day: +1.56% | 1W: +2.28% | 1M: +3.52% | RSI: 55.2 | vs MA200: +13.9% | Trend: Above MA20, MA50, MA200
Recent headlines (last 12h)
- Biogen to acquire RayThera for up to $1bn
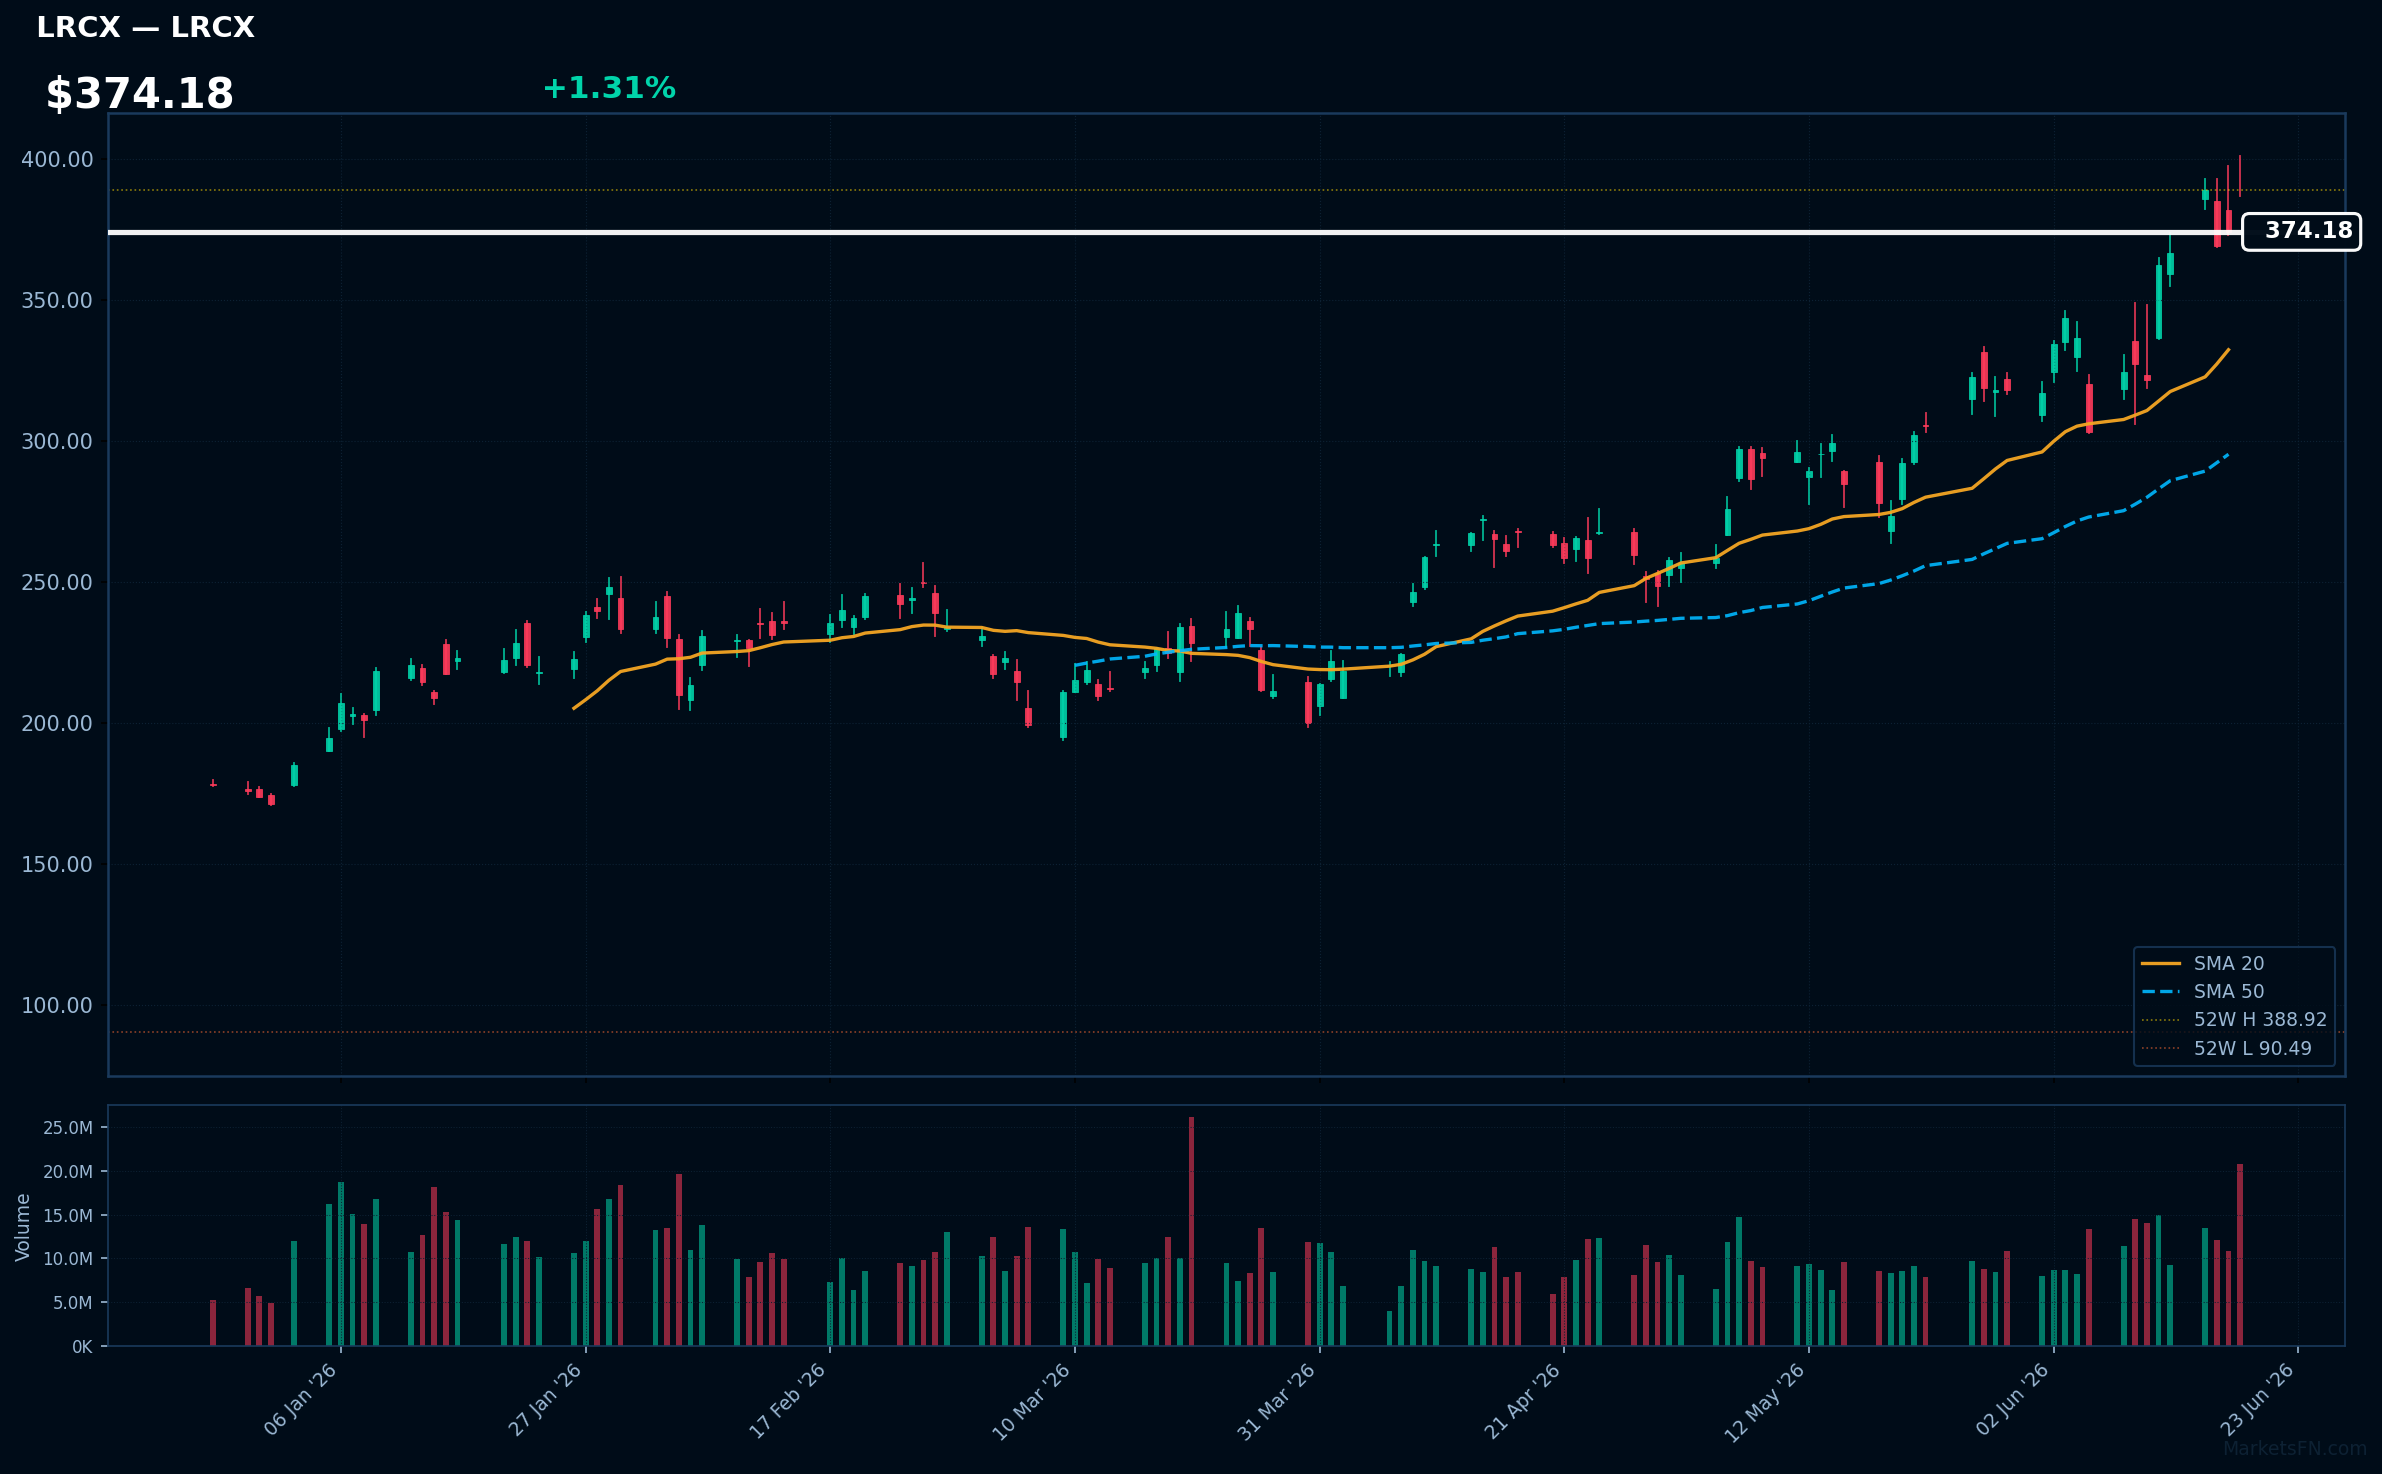
LRCX | Lam Research Corp | Technology | Price: $374.18 | Day: +1.31% | 1W: +16.28% | 1M: +34.62% | RSI: 65.6 | vs MA200: +79.4% | Trend: Above MA20, MA50, MA200
Recent headlines (last 12h)
- US Tells ASML Its Concerned China May Have Top Chip Tool
Top 10 Losers
Today's weakest Nasdaq 100 performers. Sector drag: Technology (4), Communication Services (3), Healthcare (1), Real Estate (1), Industrials (1).
| Ticker | Company | Sector | Price | Day % | 1W % | 1M % | RSI | vs MA200 | Trend |
|---|---|---|---|---|---|---|---|---|---|
| ON | ON Semiconductor Corp | Technology | $112.92 | -4.51% | +2.50% | +3.19% | 48.6 | +65.7% | Above MA50, MA200 · Below MA20 |
| SHOP | Shopify Inc | Technology | $108.09 | -4.54% | -0.10% | +5.57% | 46.3 | -21.5% | Below MA20, MA50, MA200 |
| IDXX | Idexx Laboratories, Inc | Healthcare | $546.09 | -4.70% | -1.95% | +0.05% | 43.7 | -13.7% | Below MA20, MA50, MA200 |
| CSGP | Costar Group, Inc | Real Estate | $30.46 | -4.72% | -11.01% | -8.25% | 31.0 | -46.7% | Below MA20, MA50, MA200 |
| MSTR | Strategy Inc | Technology | $116.56 | -5.09% | +1.05% | -30.05% | 35.7 | -39.6% | Below MA20, MA50, MA200 |
| ADBE | Adobe Inc | Technology | $196.28 | -5.33% | -15.90% | -23.22% | 28.1 | -33.7% | Below MA20, MA50, MA200 |
| META | Meta Platforms Inc | Communication Services | $567.58 | -5.44% | -0.60% | -7.14% | 39.3 | -13.4% | Below MA20, MA50, MA200 |
| ODFL | Old Dominion Freight Line, Inc | Industrials | $218.36 | -5.72% | -7.45% | +6.97% | 44.6 | +24.0% | Above MA50, MA200 · Below MA20 |
| CHTR | Charter Communications Inc | Communication Services | $132.00 | -6.90% | -4.20% | -6.52% | 35.7 | -37.8% | Below MA20, MA50, MA200 |
| APP | Applovin Corp | Communication Services | $479.49 | -6.93% | -2.74% | -2.62% | 42.7 | -11.6% | Below MA20, MA50, MA200 |
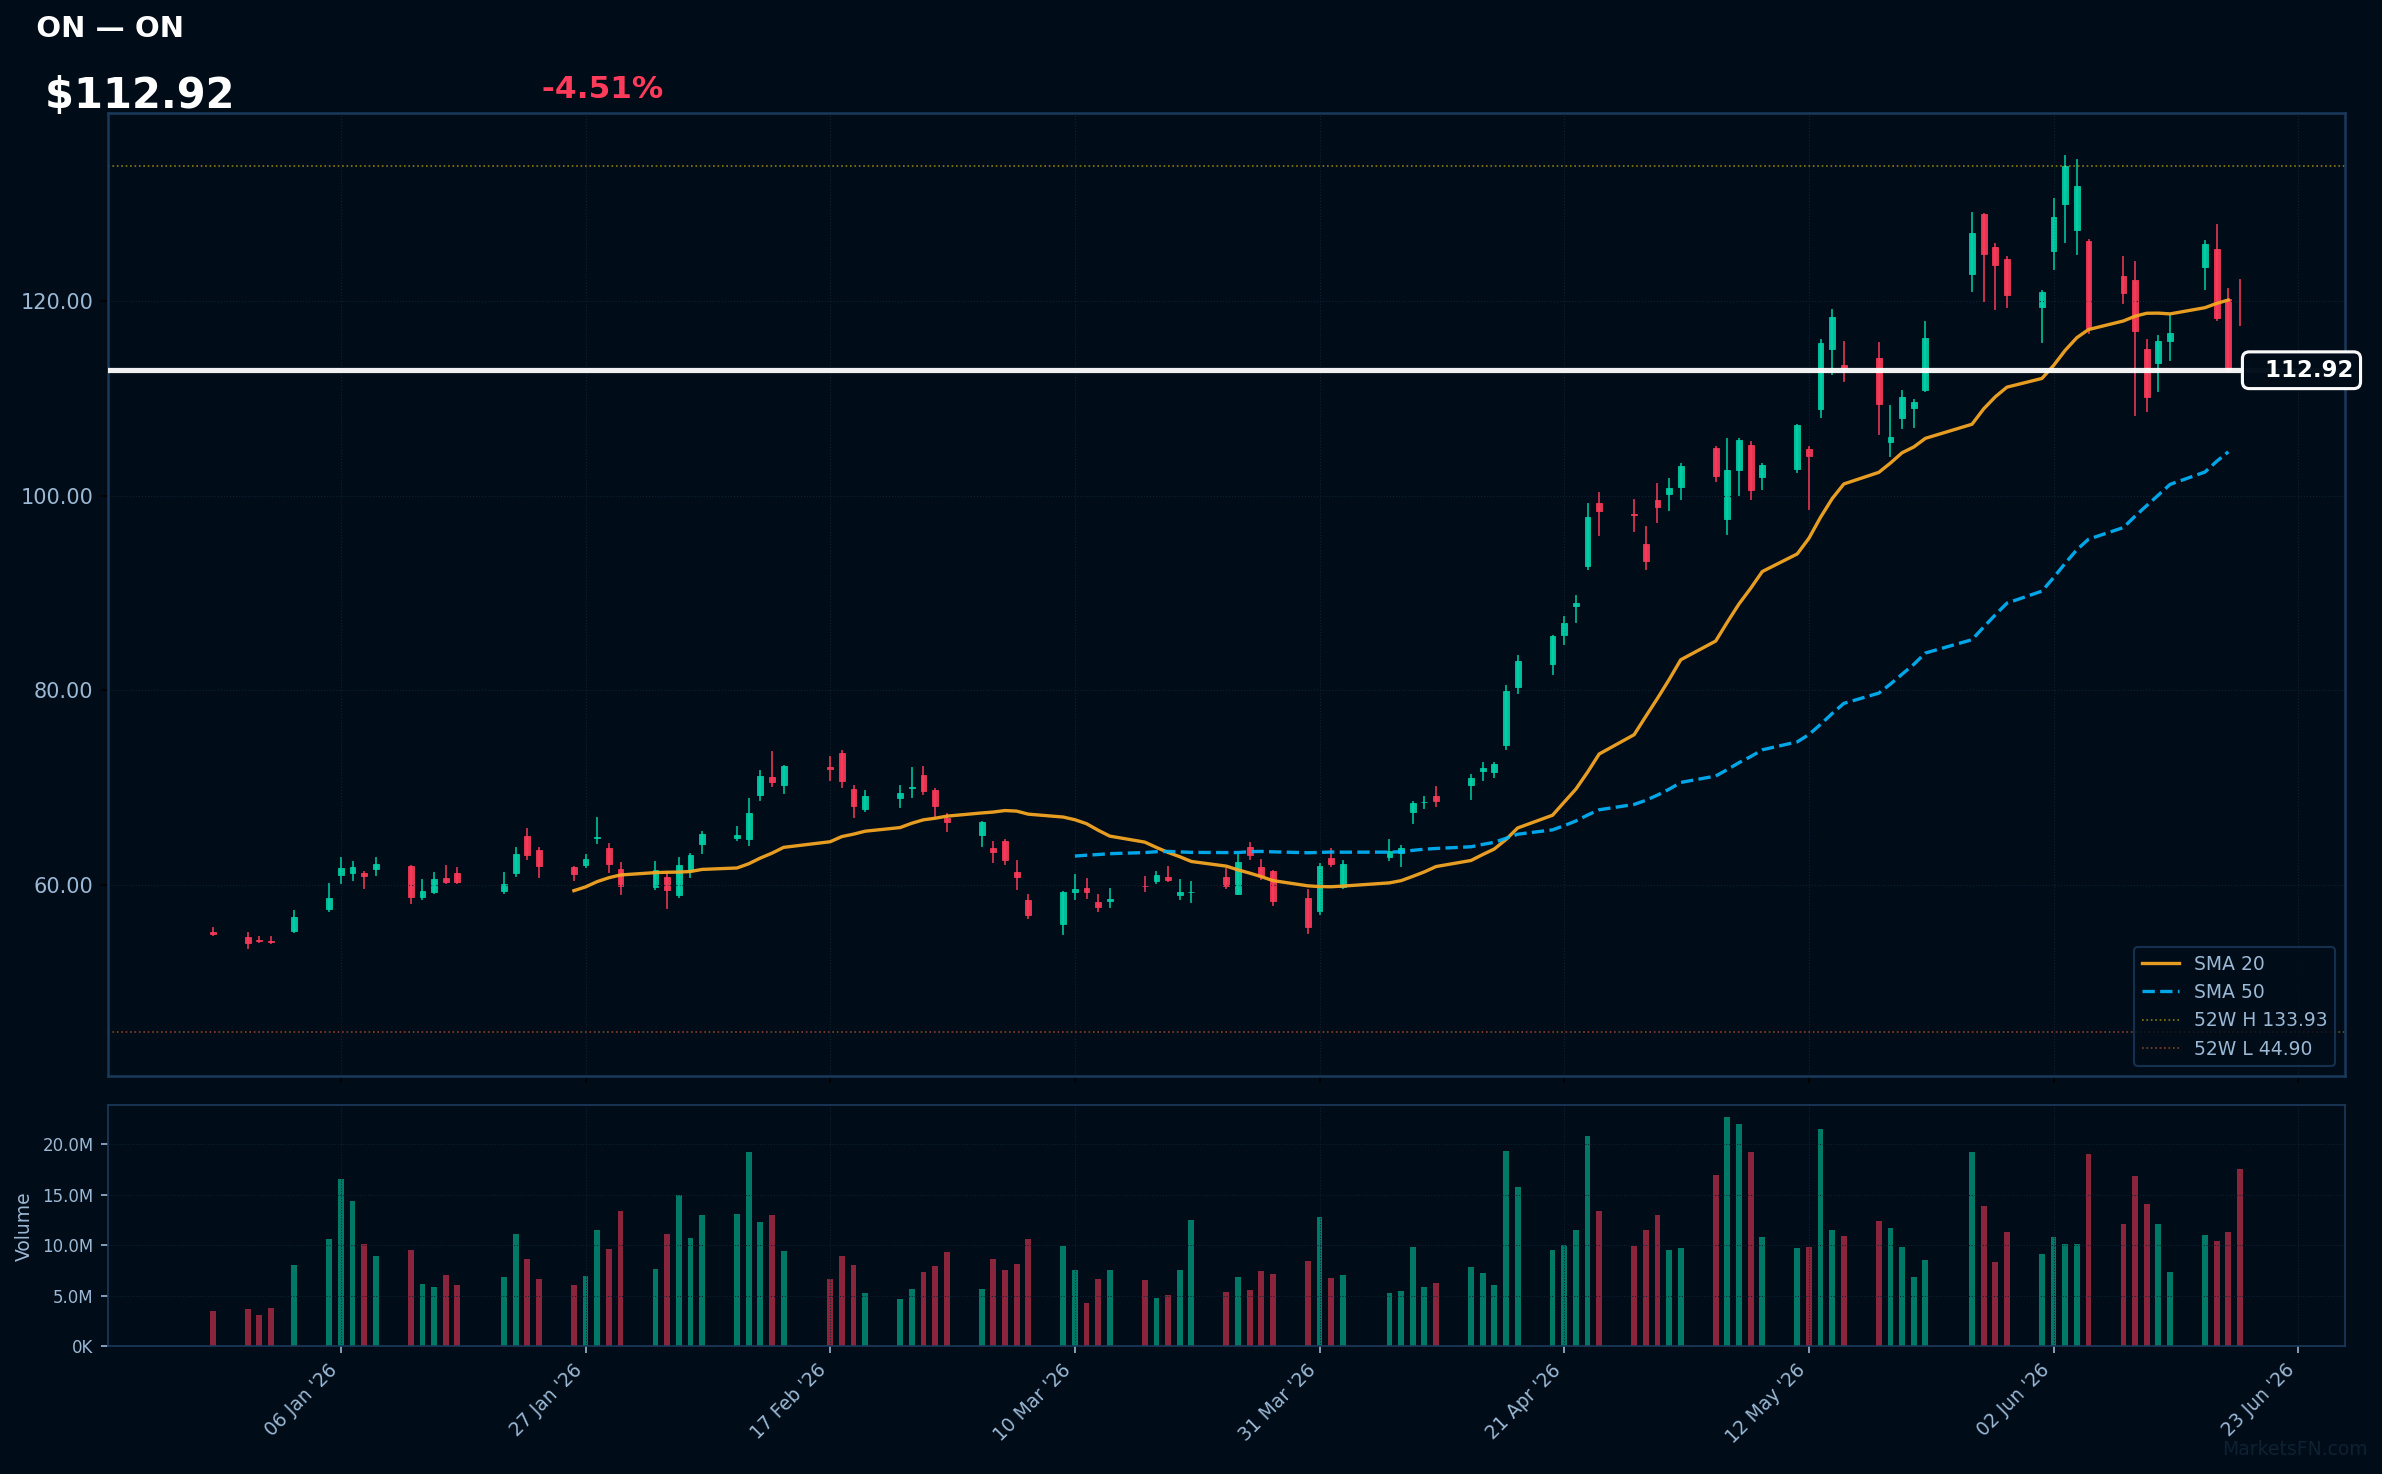
ON | ON Semiconductor Corp | Technology | Price: $112.92 | Day: -4.51% | 1W: +2.50% | 1M: +3.19% | RSI: 48.6 | vs MA200: +65.7% | Trend: Above MA50, MA200 · Below MA20
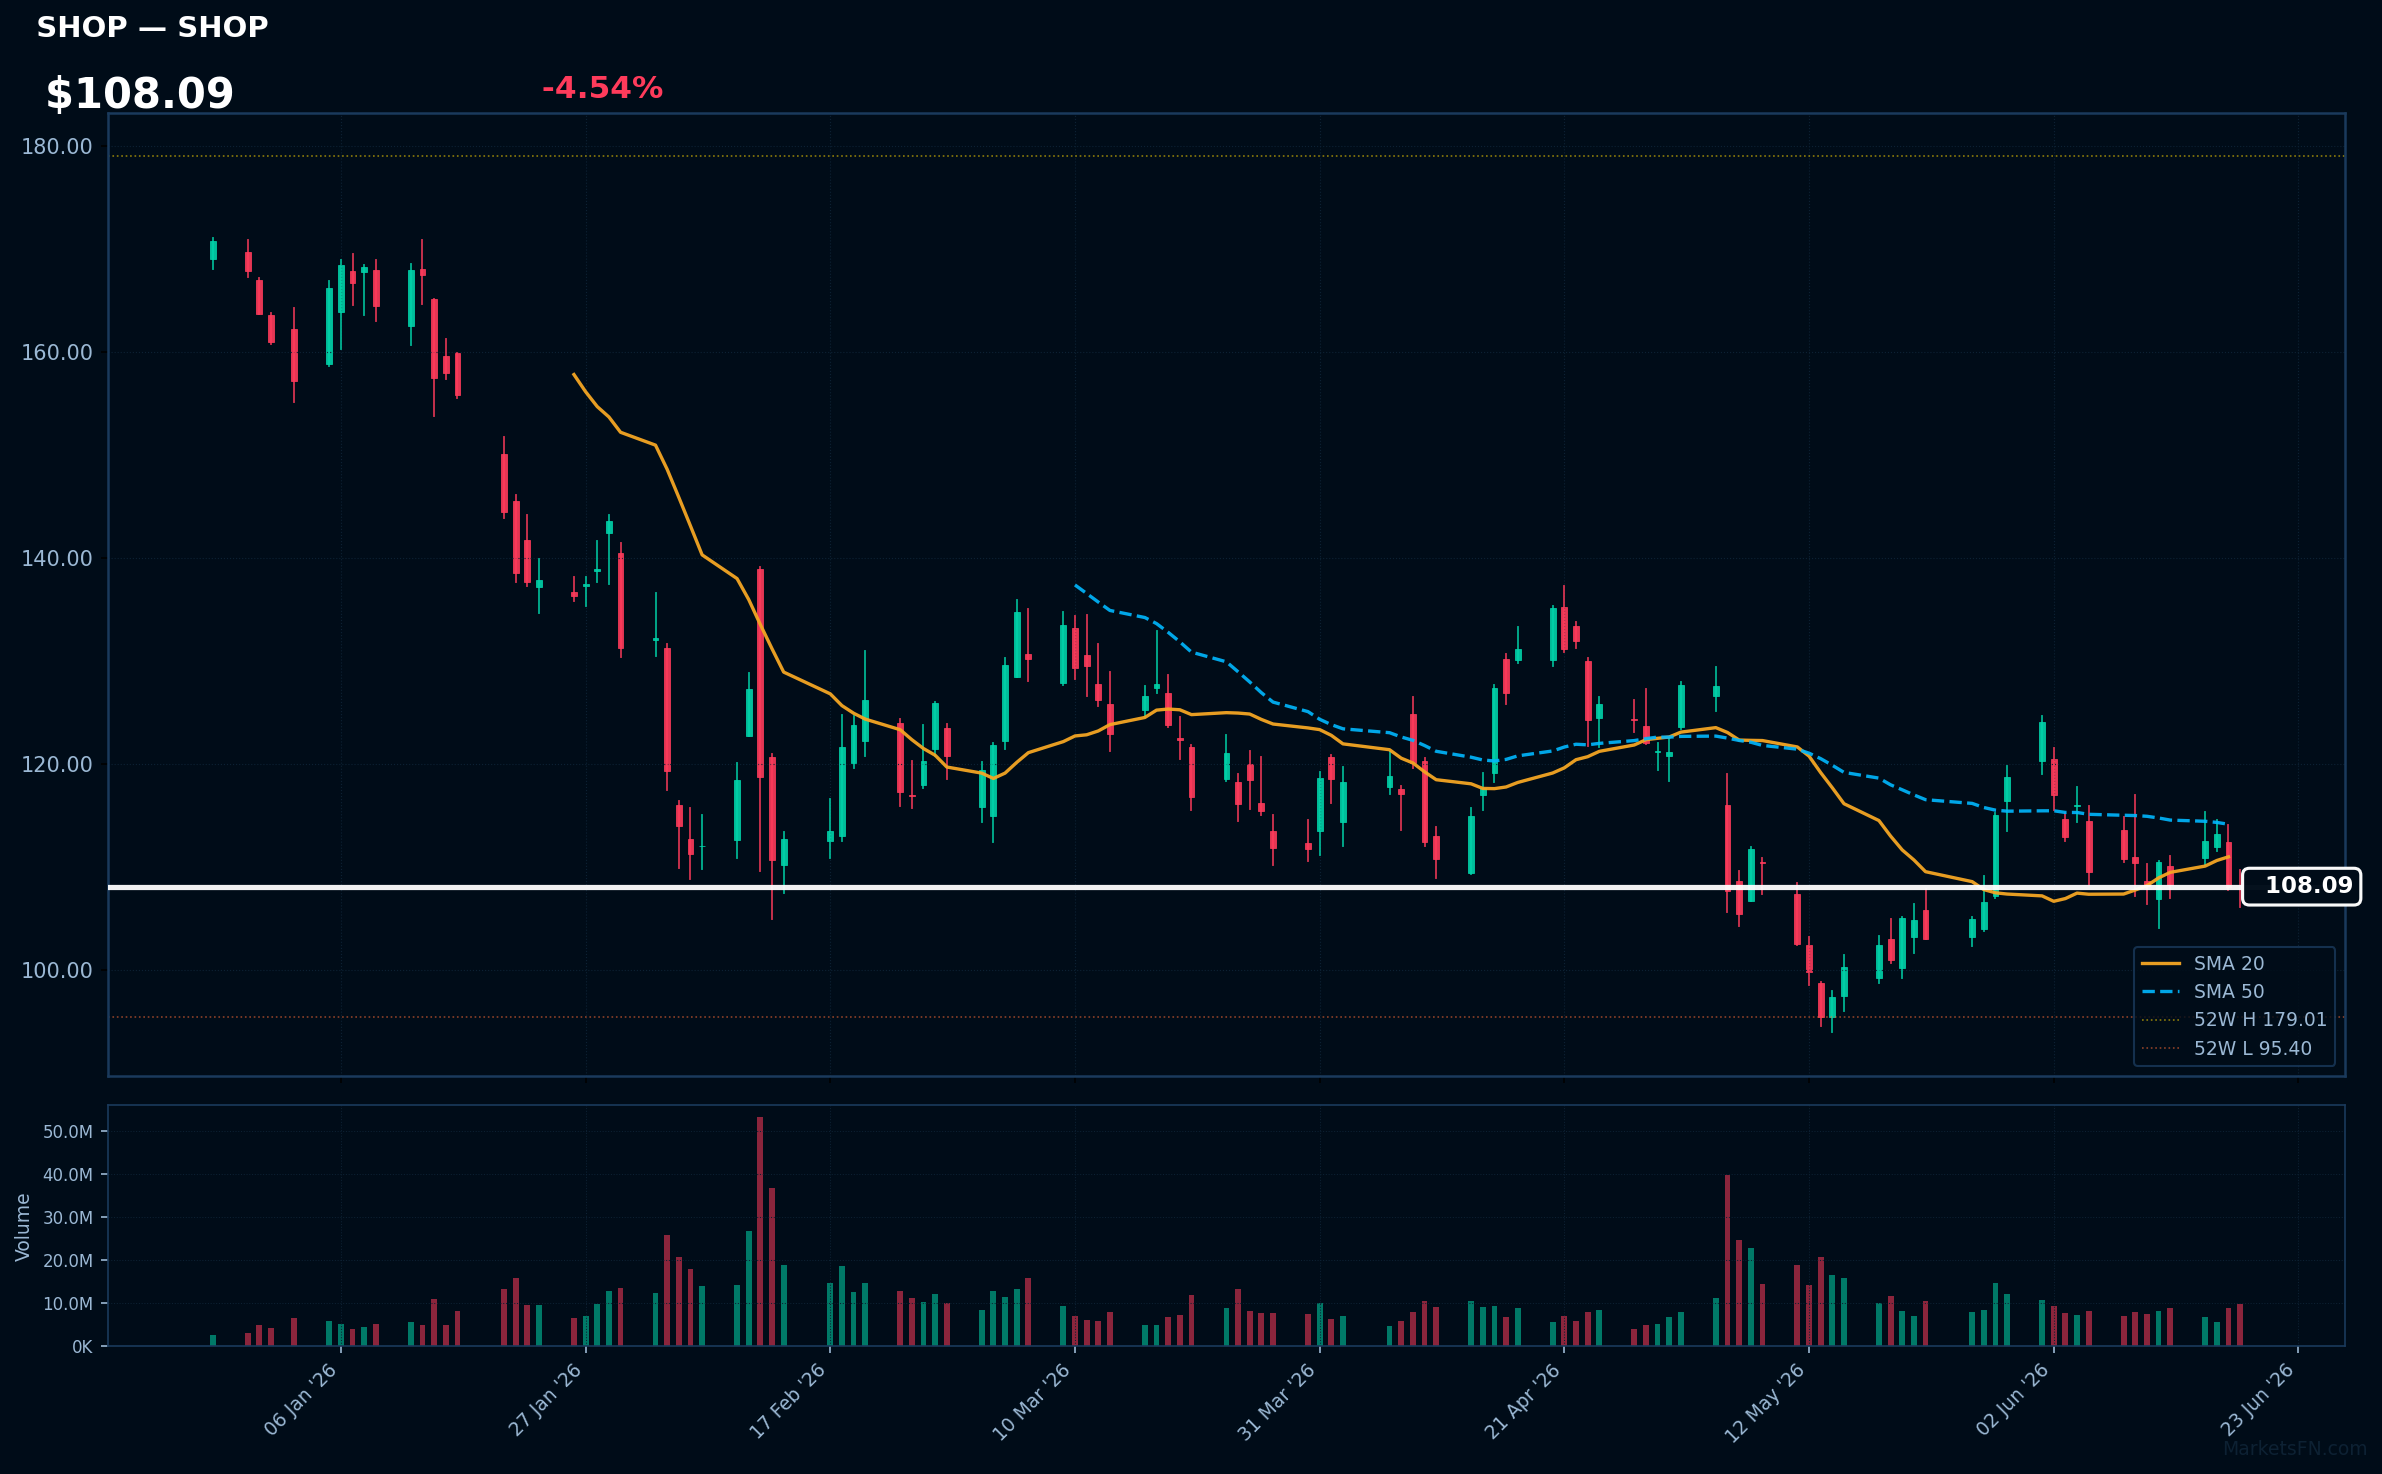
SHOP | Shopify Inc | Technology | Price: $108.09 | Day: -4.54% | 1W: -0.10% | 1M: +5.57% | RSI: 46.3 | vs MA200: -21.5% | Trend: Below MA20, MA50, MA200
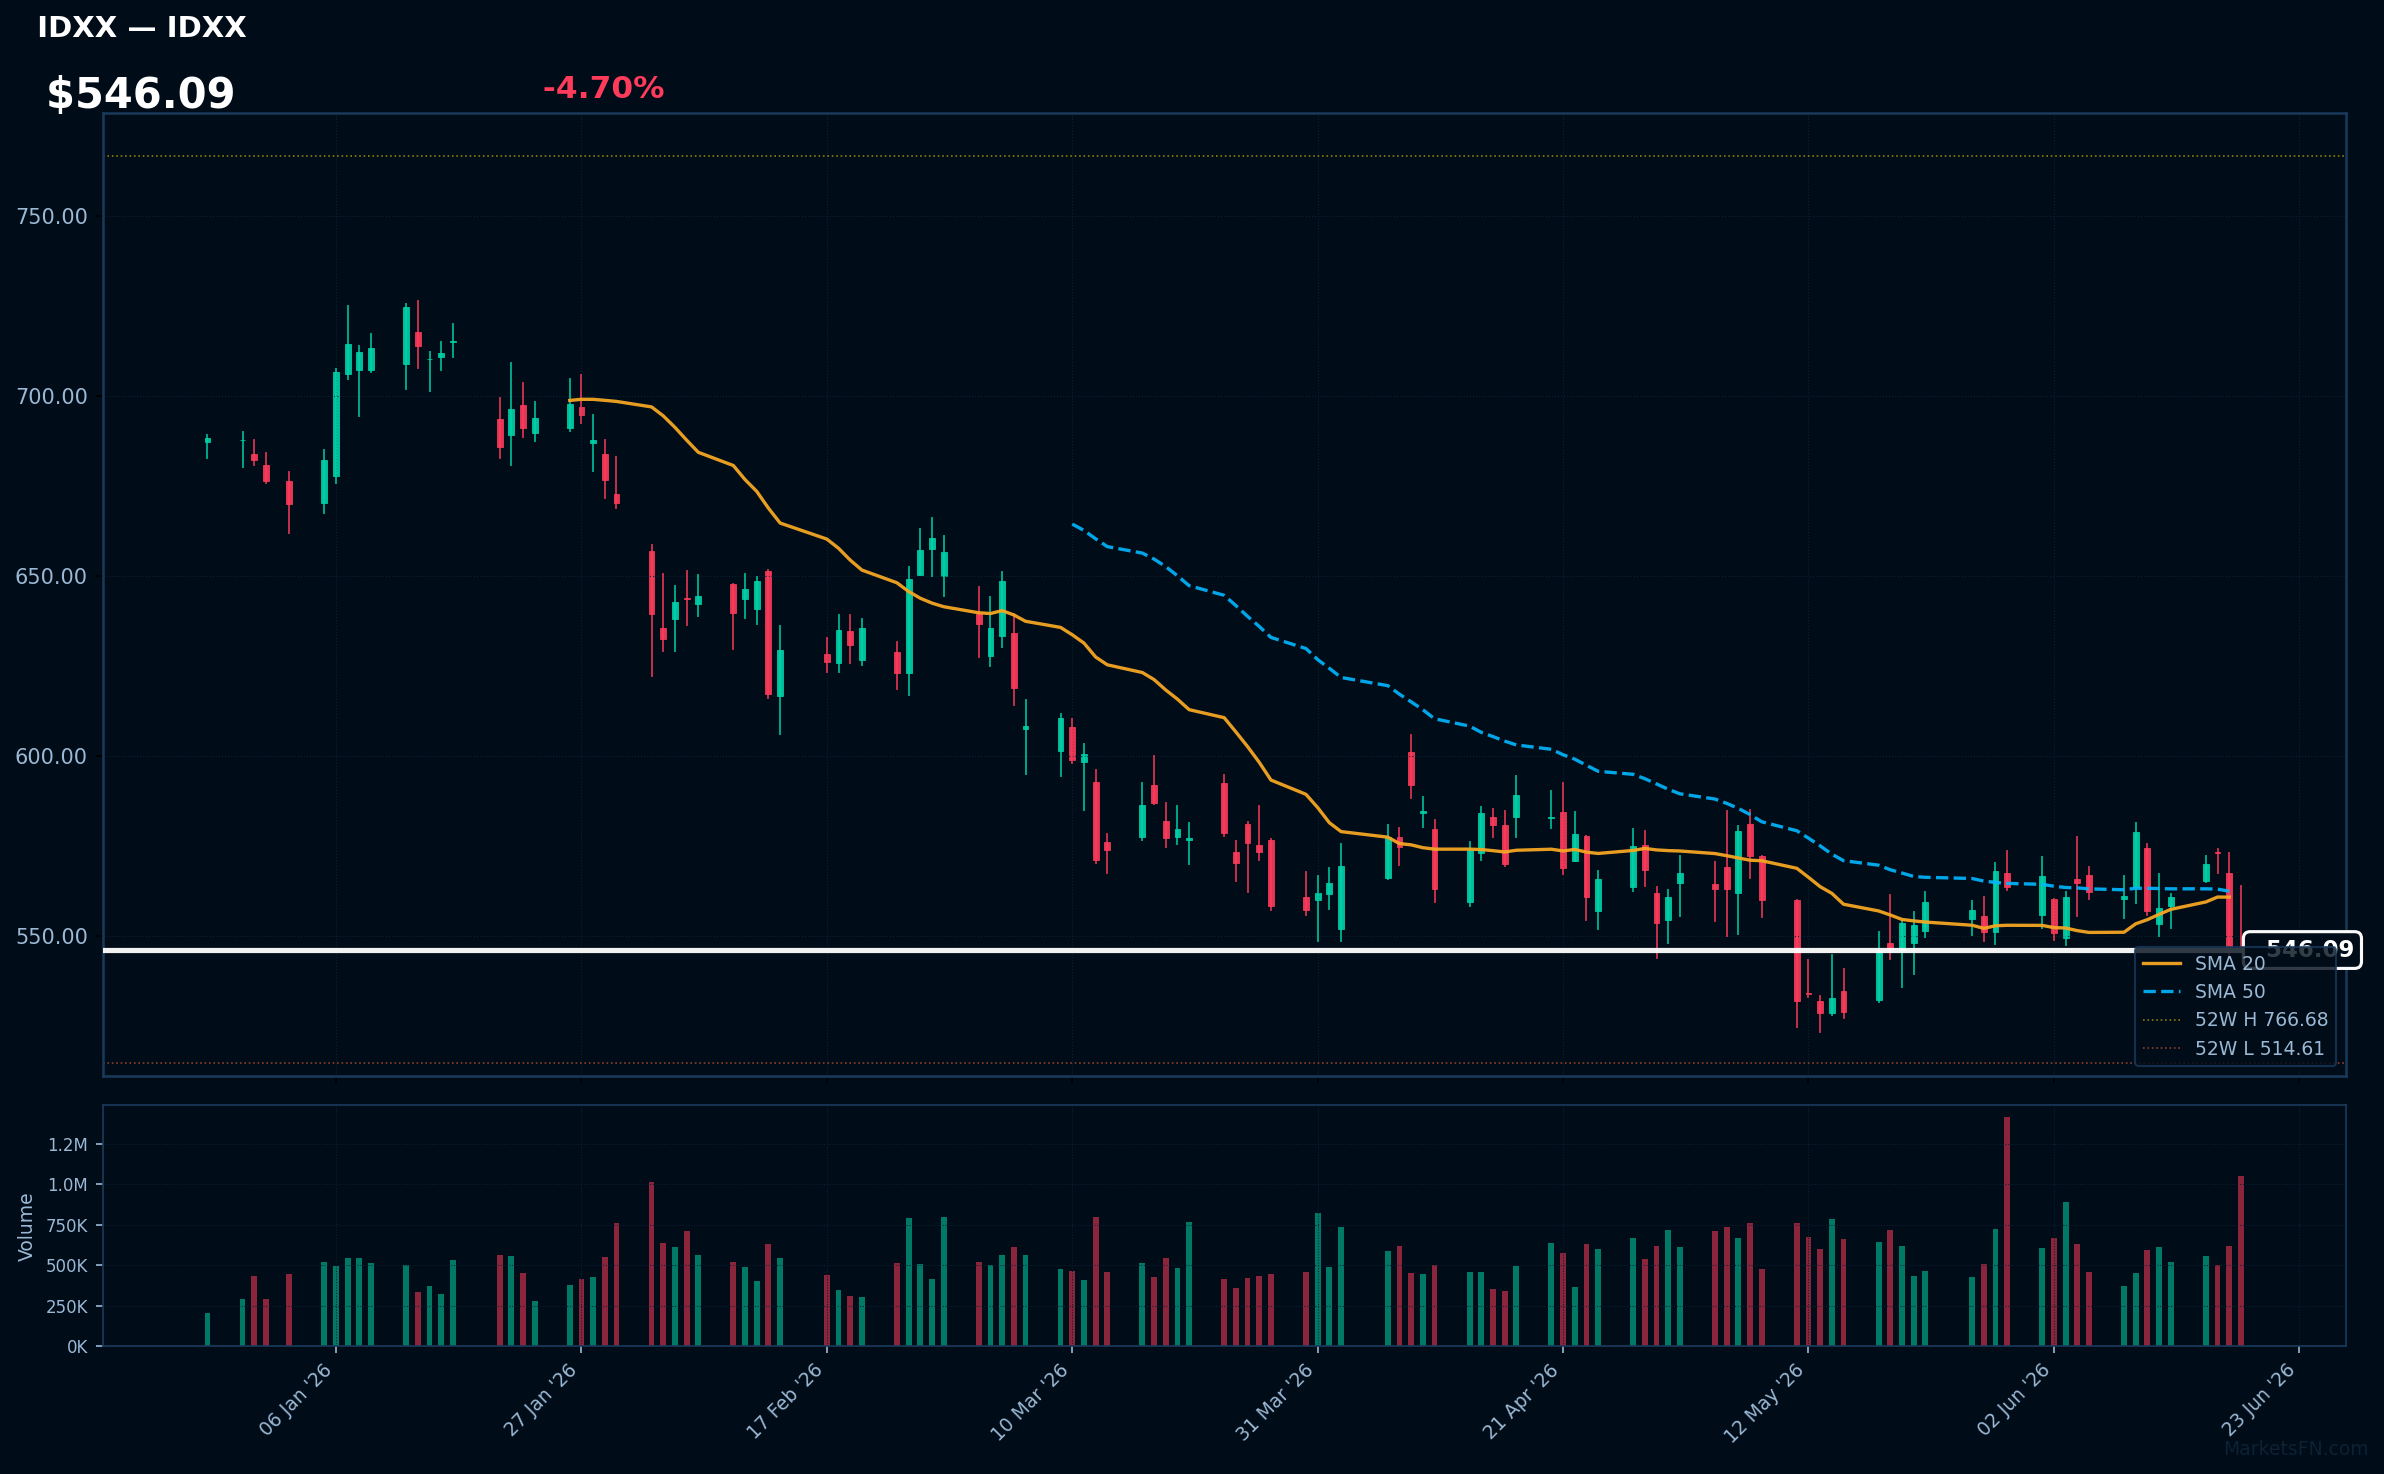
IDXX | Idexx Laboratories, Inc | Healthcare | Price: $546.09 | Day: -4.70% | 1W: -1.95% | 1M: +0.05% | RSI: 43.7 | vs MA200: -13.7% | Trend: Below MA20, MA50, MA200
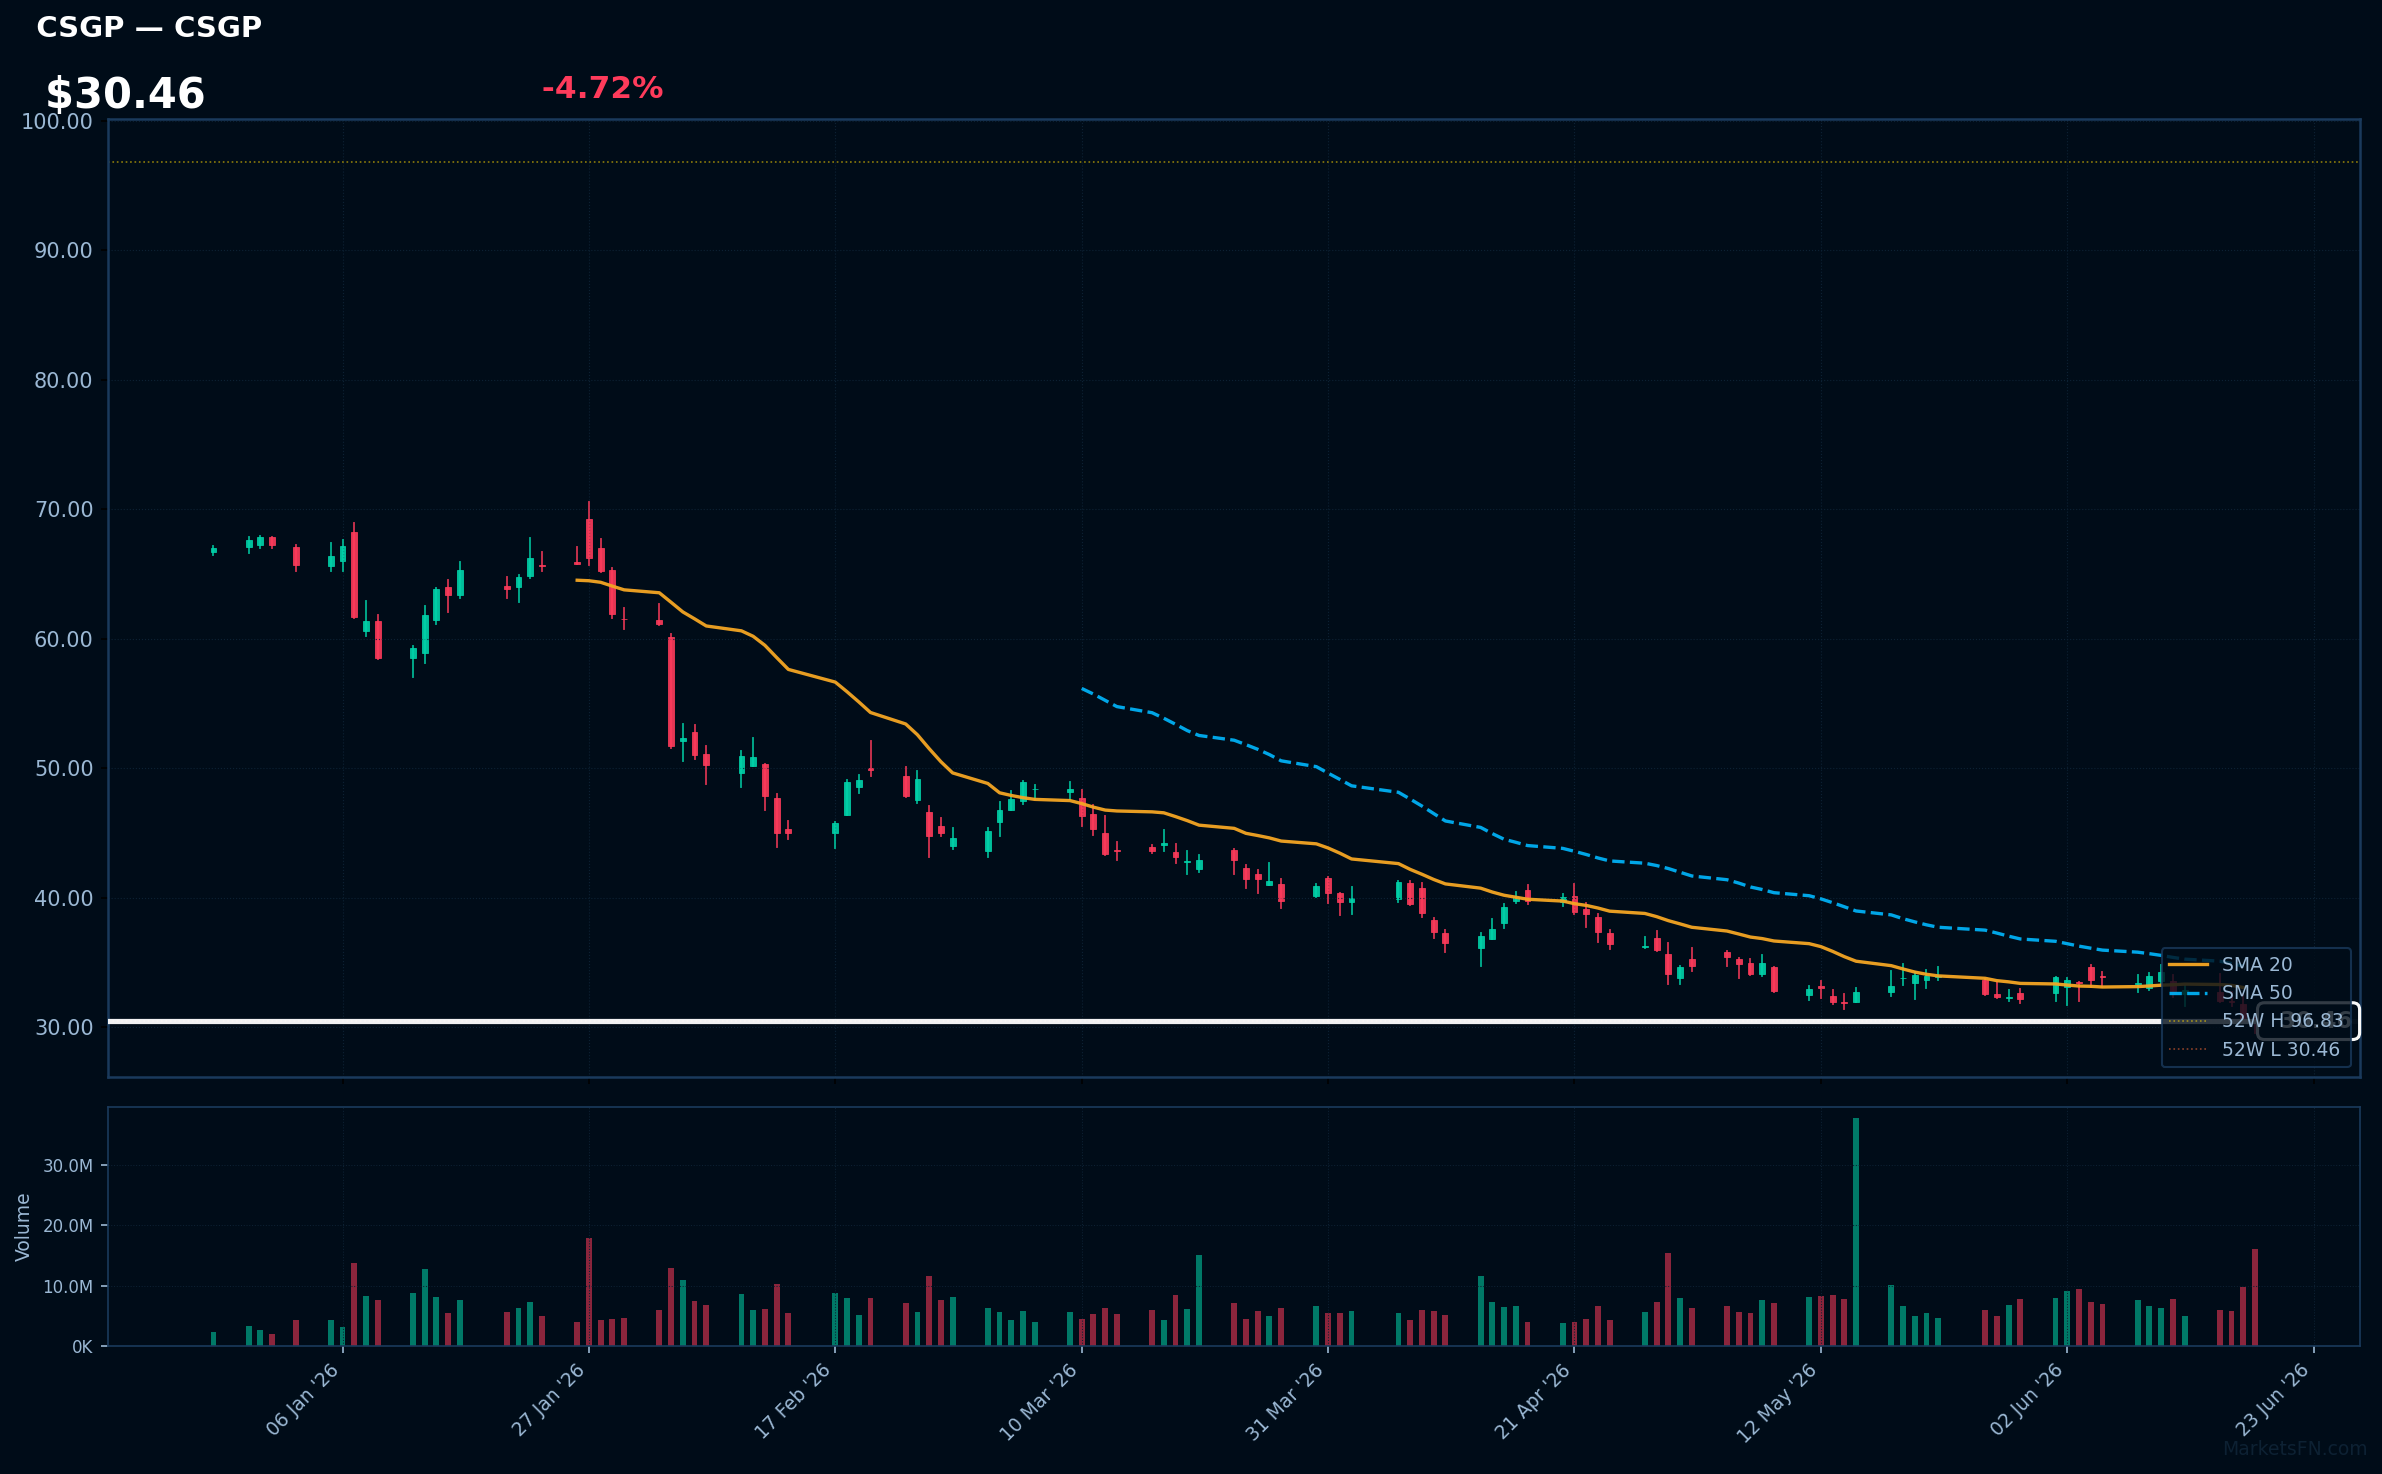
CSGP | Costar Group, Inc | Real Estate | Price: $30.46 | Day: -4.72% | 1W: -11.01% | 1M: -8.25% | RSI: 31.0 | vs MA200: -46.7% | Trend: Below MA20, MA50, MA200
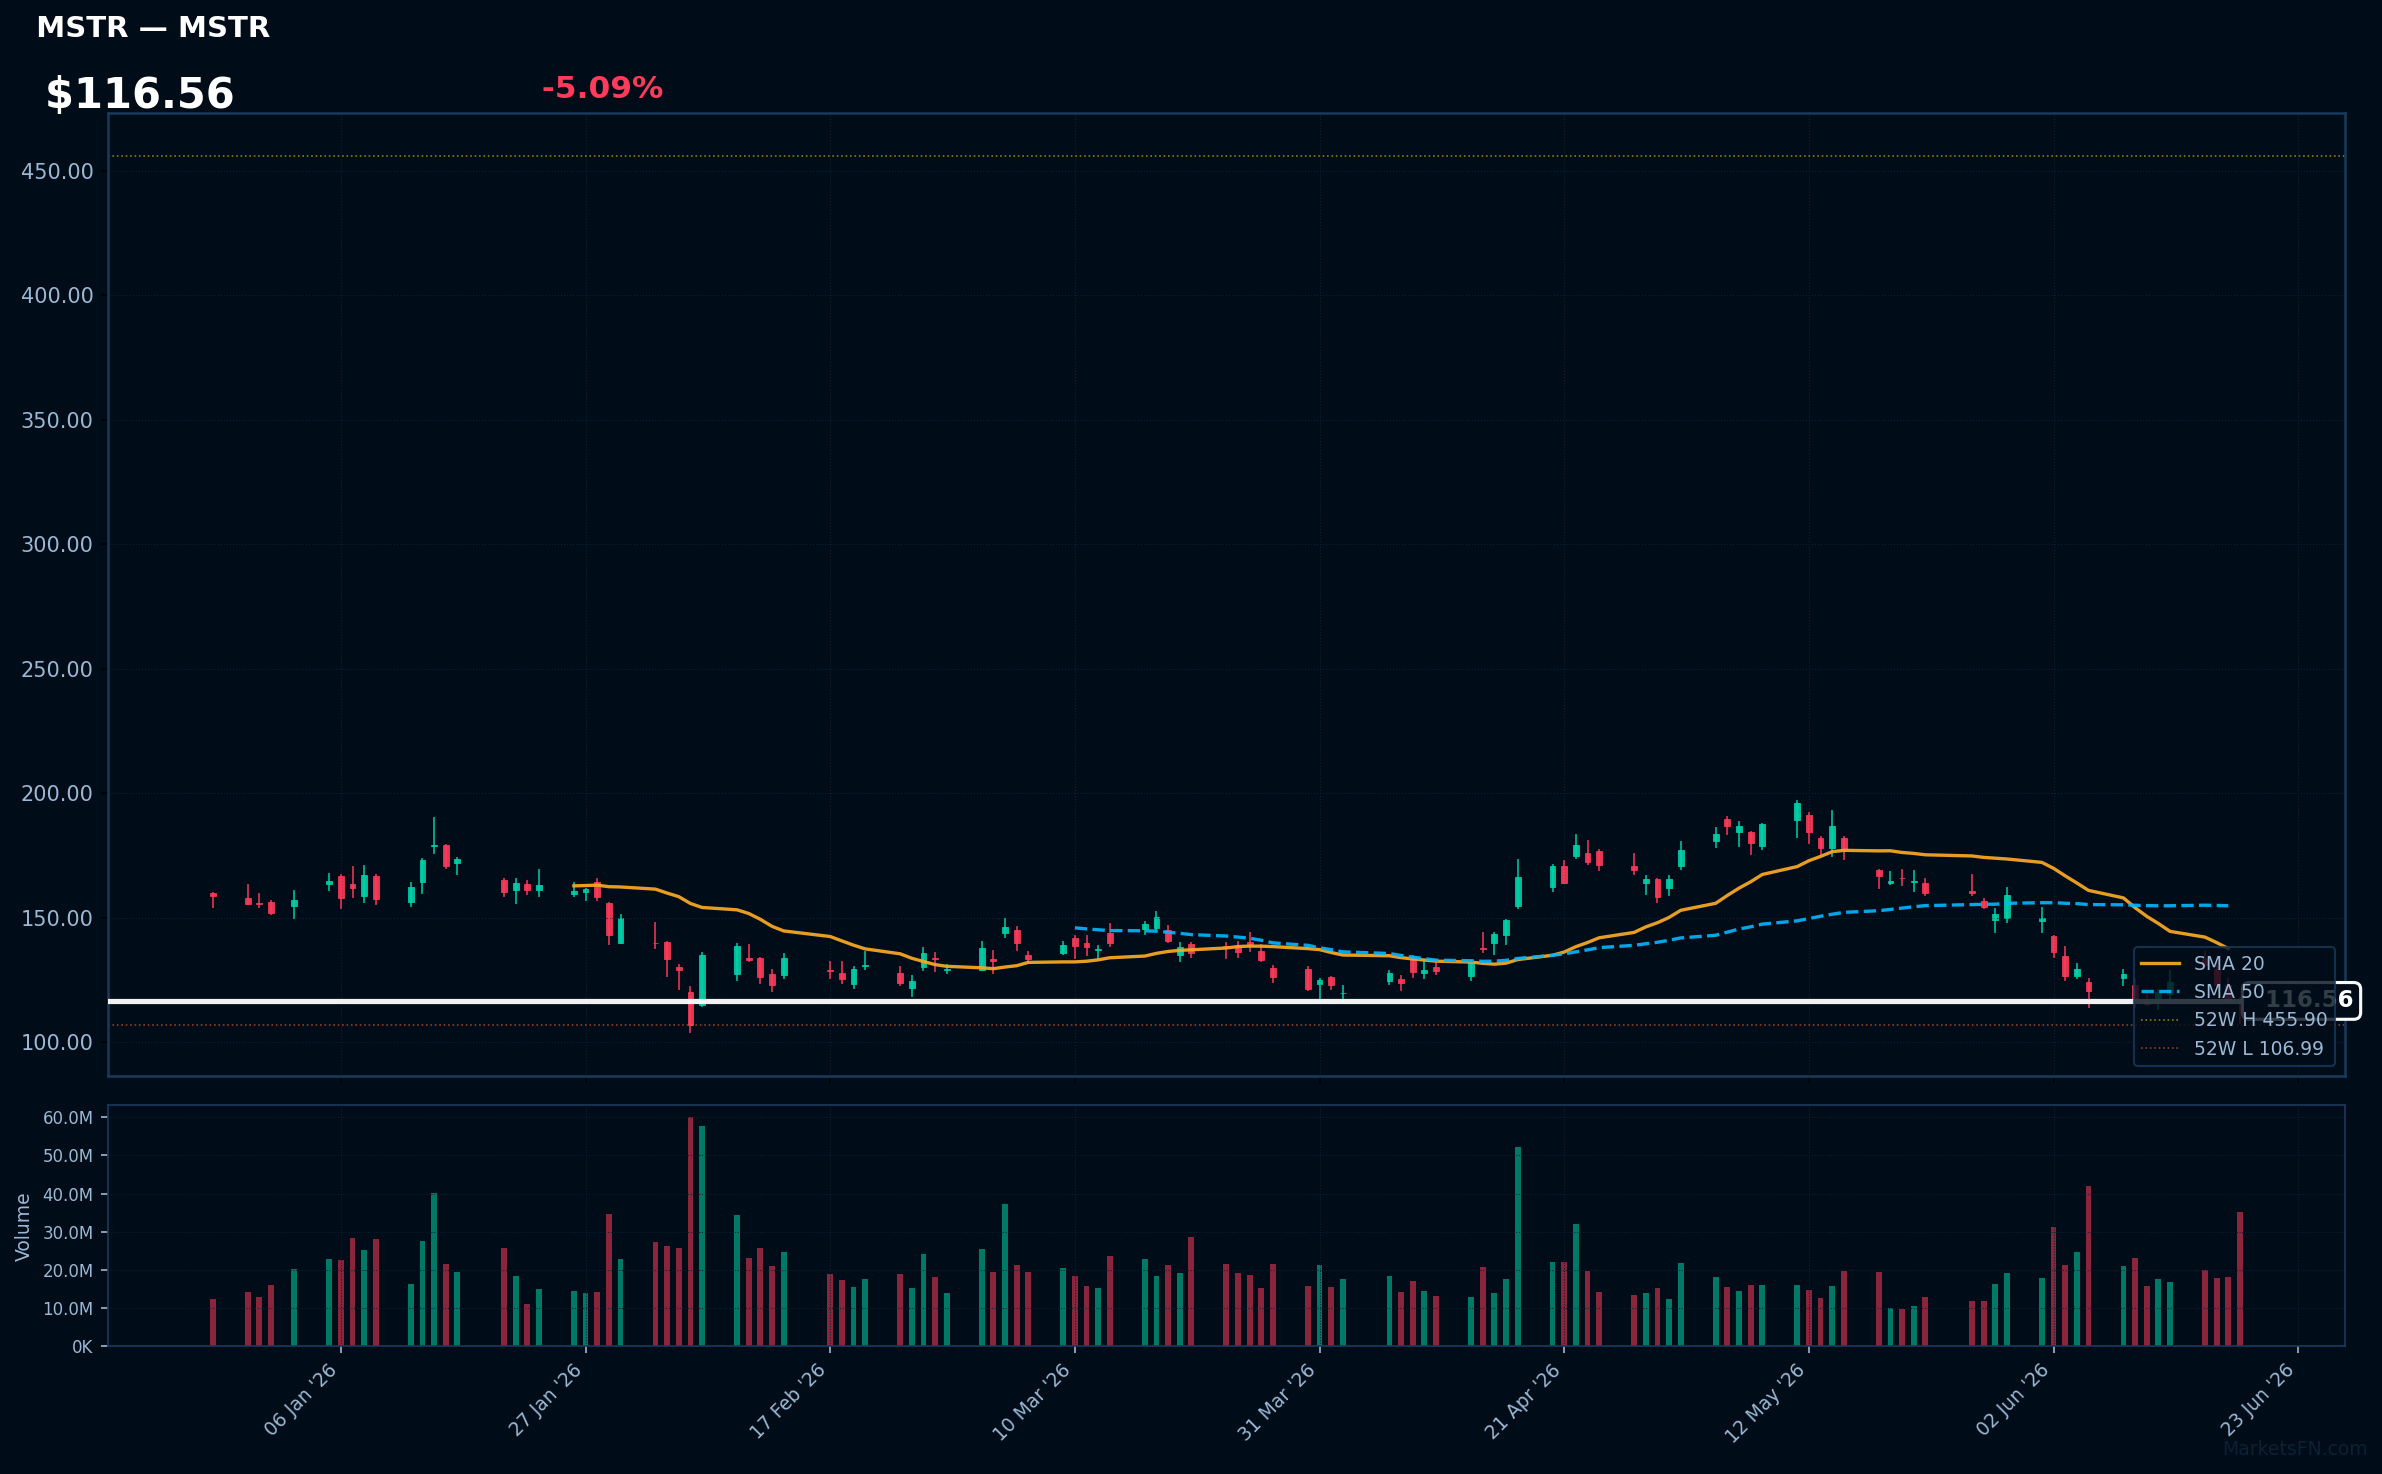
MSTR | Strategy Inc | Technology | Price: $116.56 | Day: -5.09% | 1W: +1.05% | 1M: -30.05% | RSI: 35.7 | vs MA200: -39.6% | Trend: Below MA20, MA50, MA200
Recent headlines (last 12h)
- Why Is The Crypto Market Down Today?
- Strategys Michael Saylor Comments On Preferred Stocks Selloff
- MicroStrategys STRC Hits Record Low as Monthly Slide Tops 10%
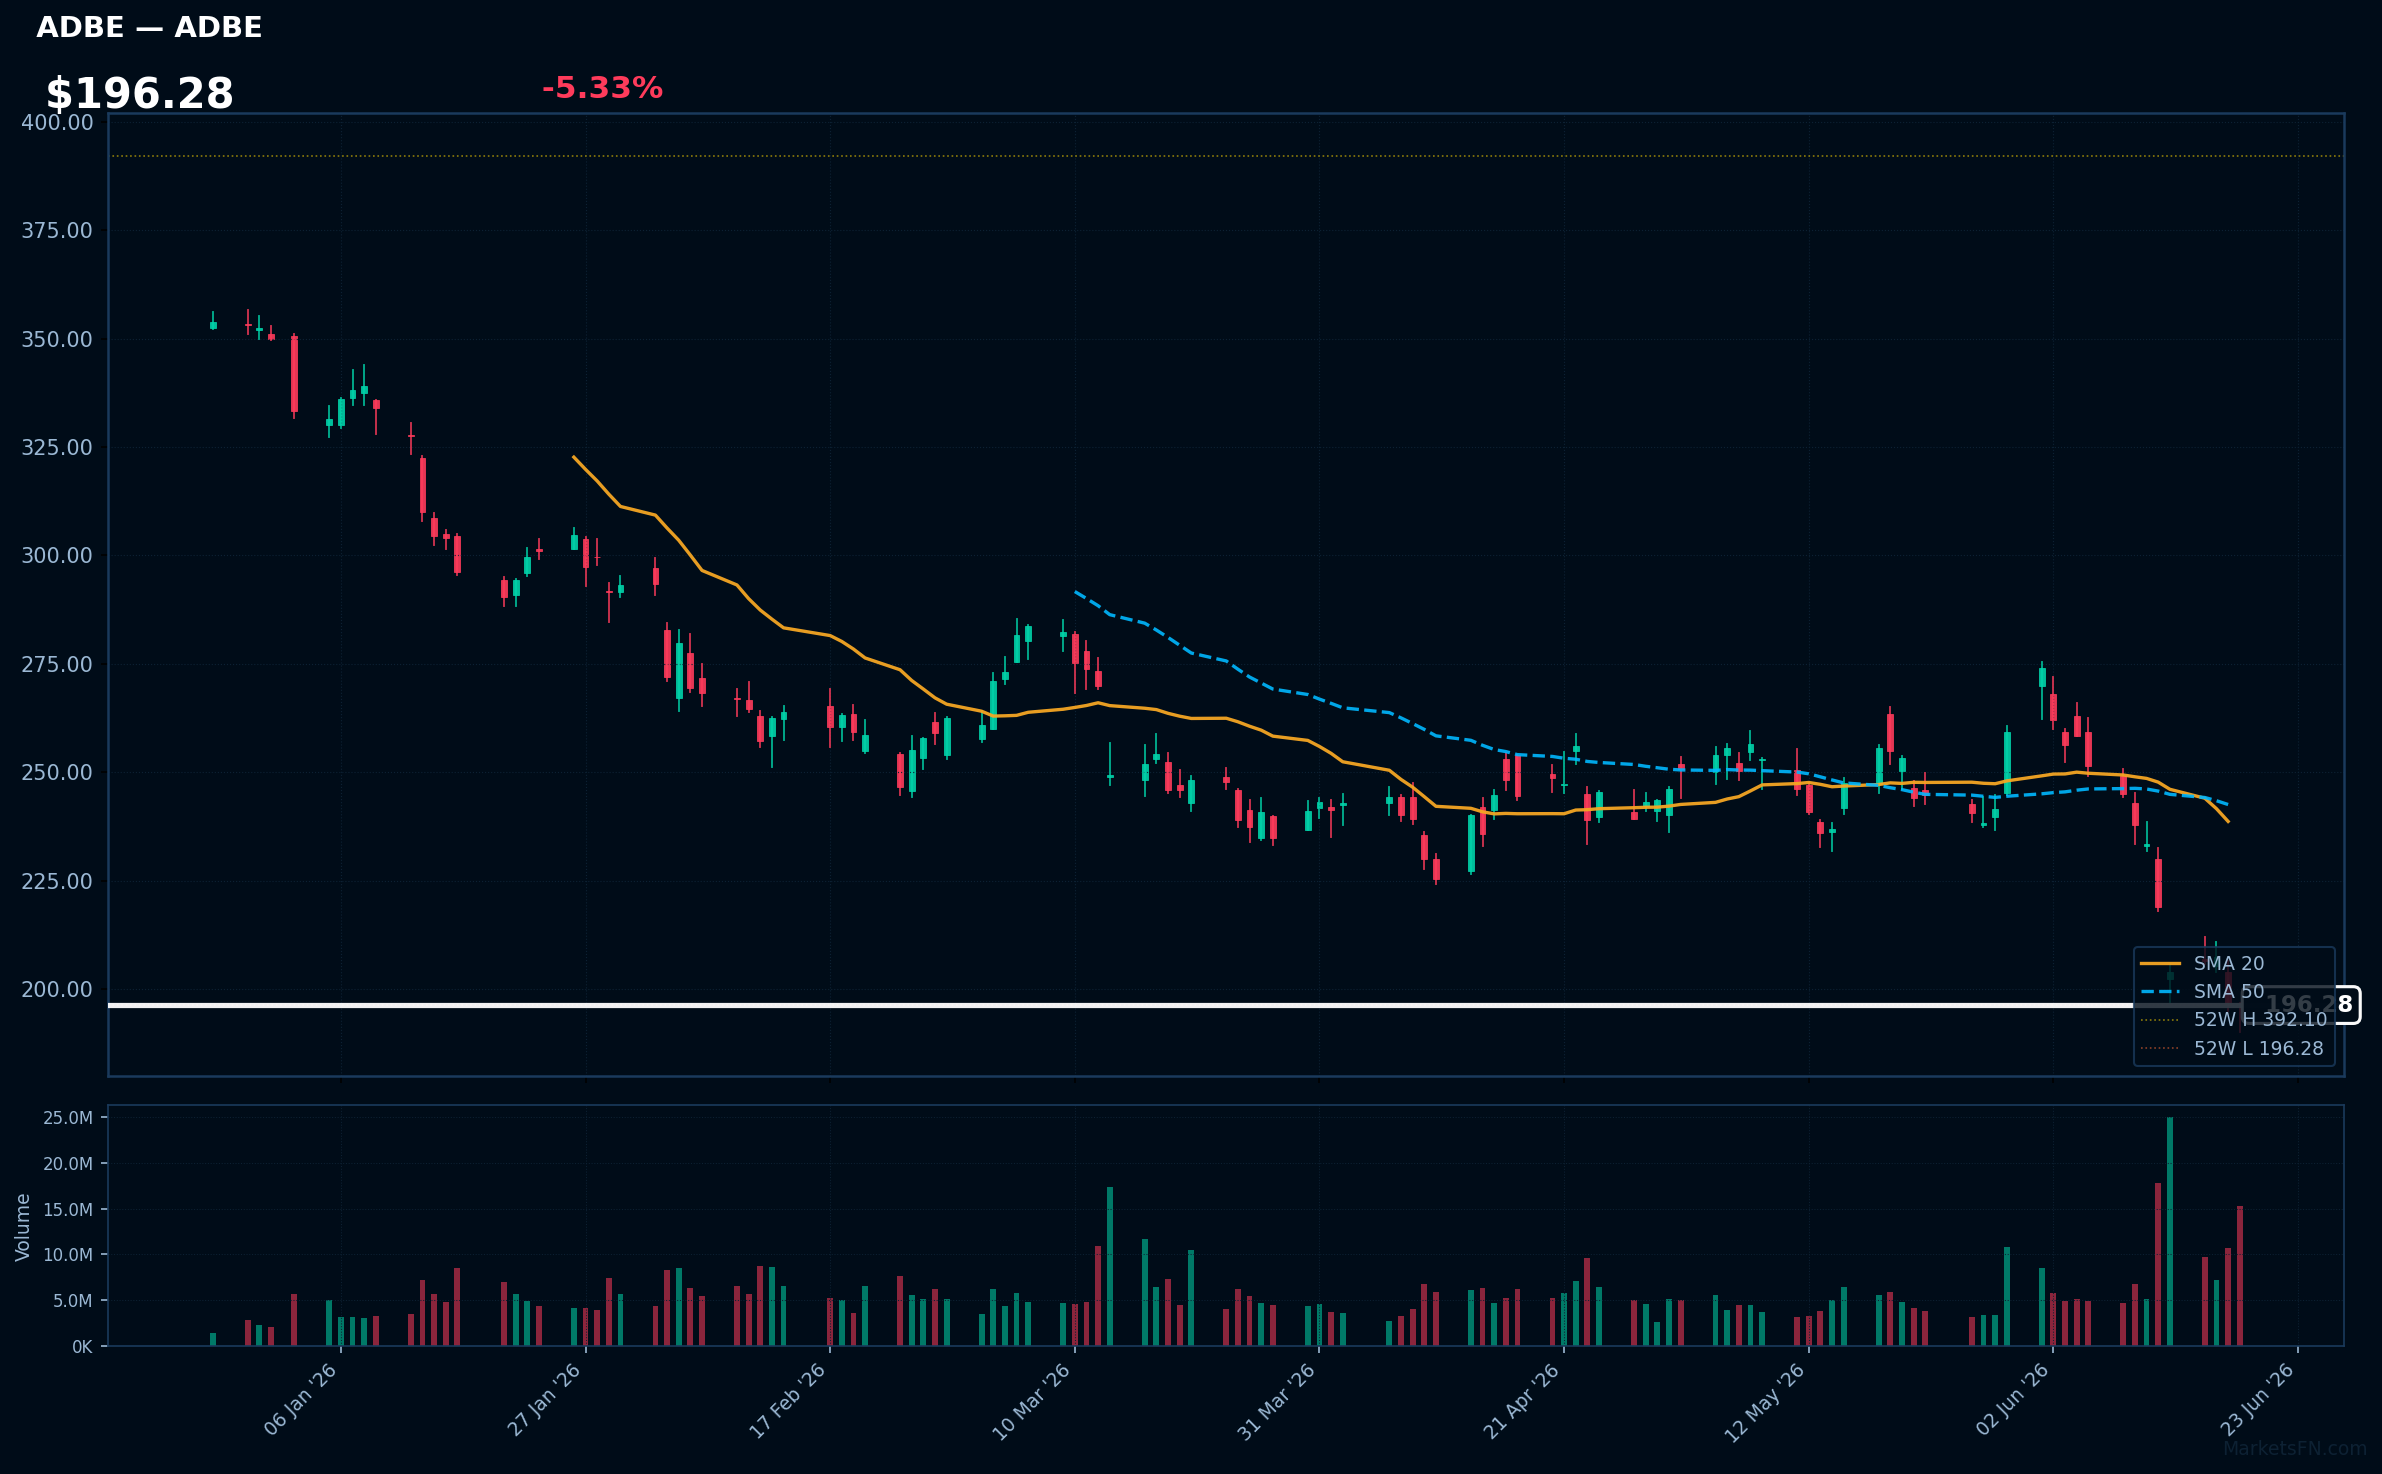
ADBE | Adobe Inc | Technology | Price: $196.28 | Day: -5.33% | 1W: -15.90% | 1M: -23.22% | RSI: 28.1 | vs MA200: -33.7% | Trend: Below MA20, MA50, MA200
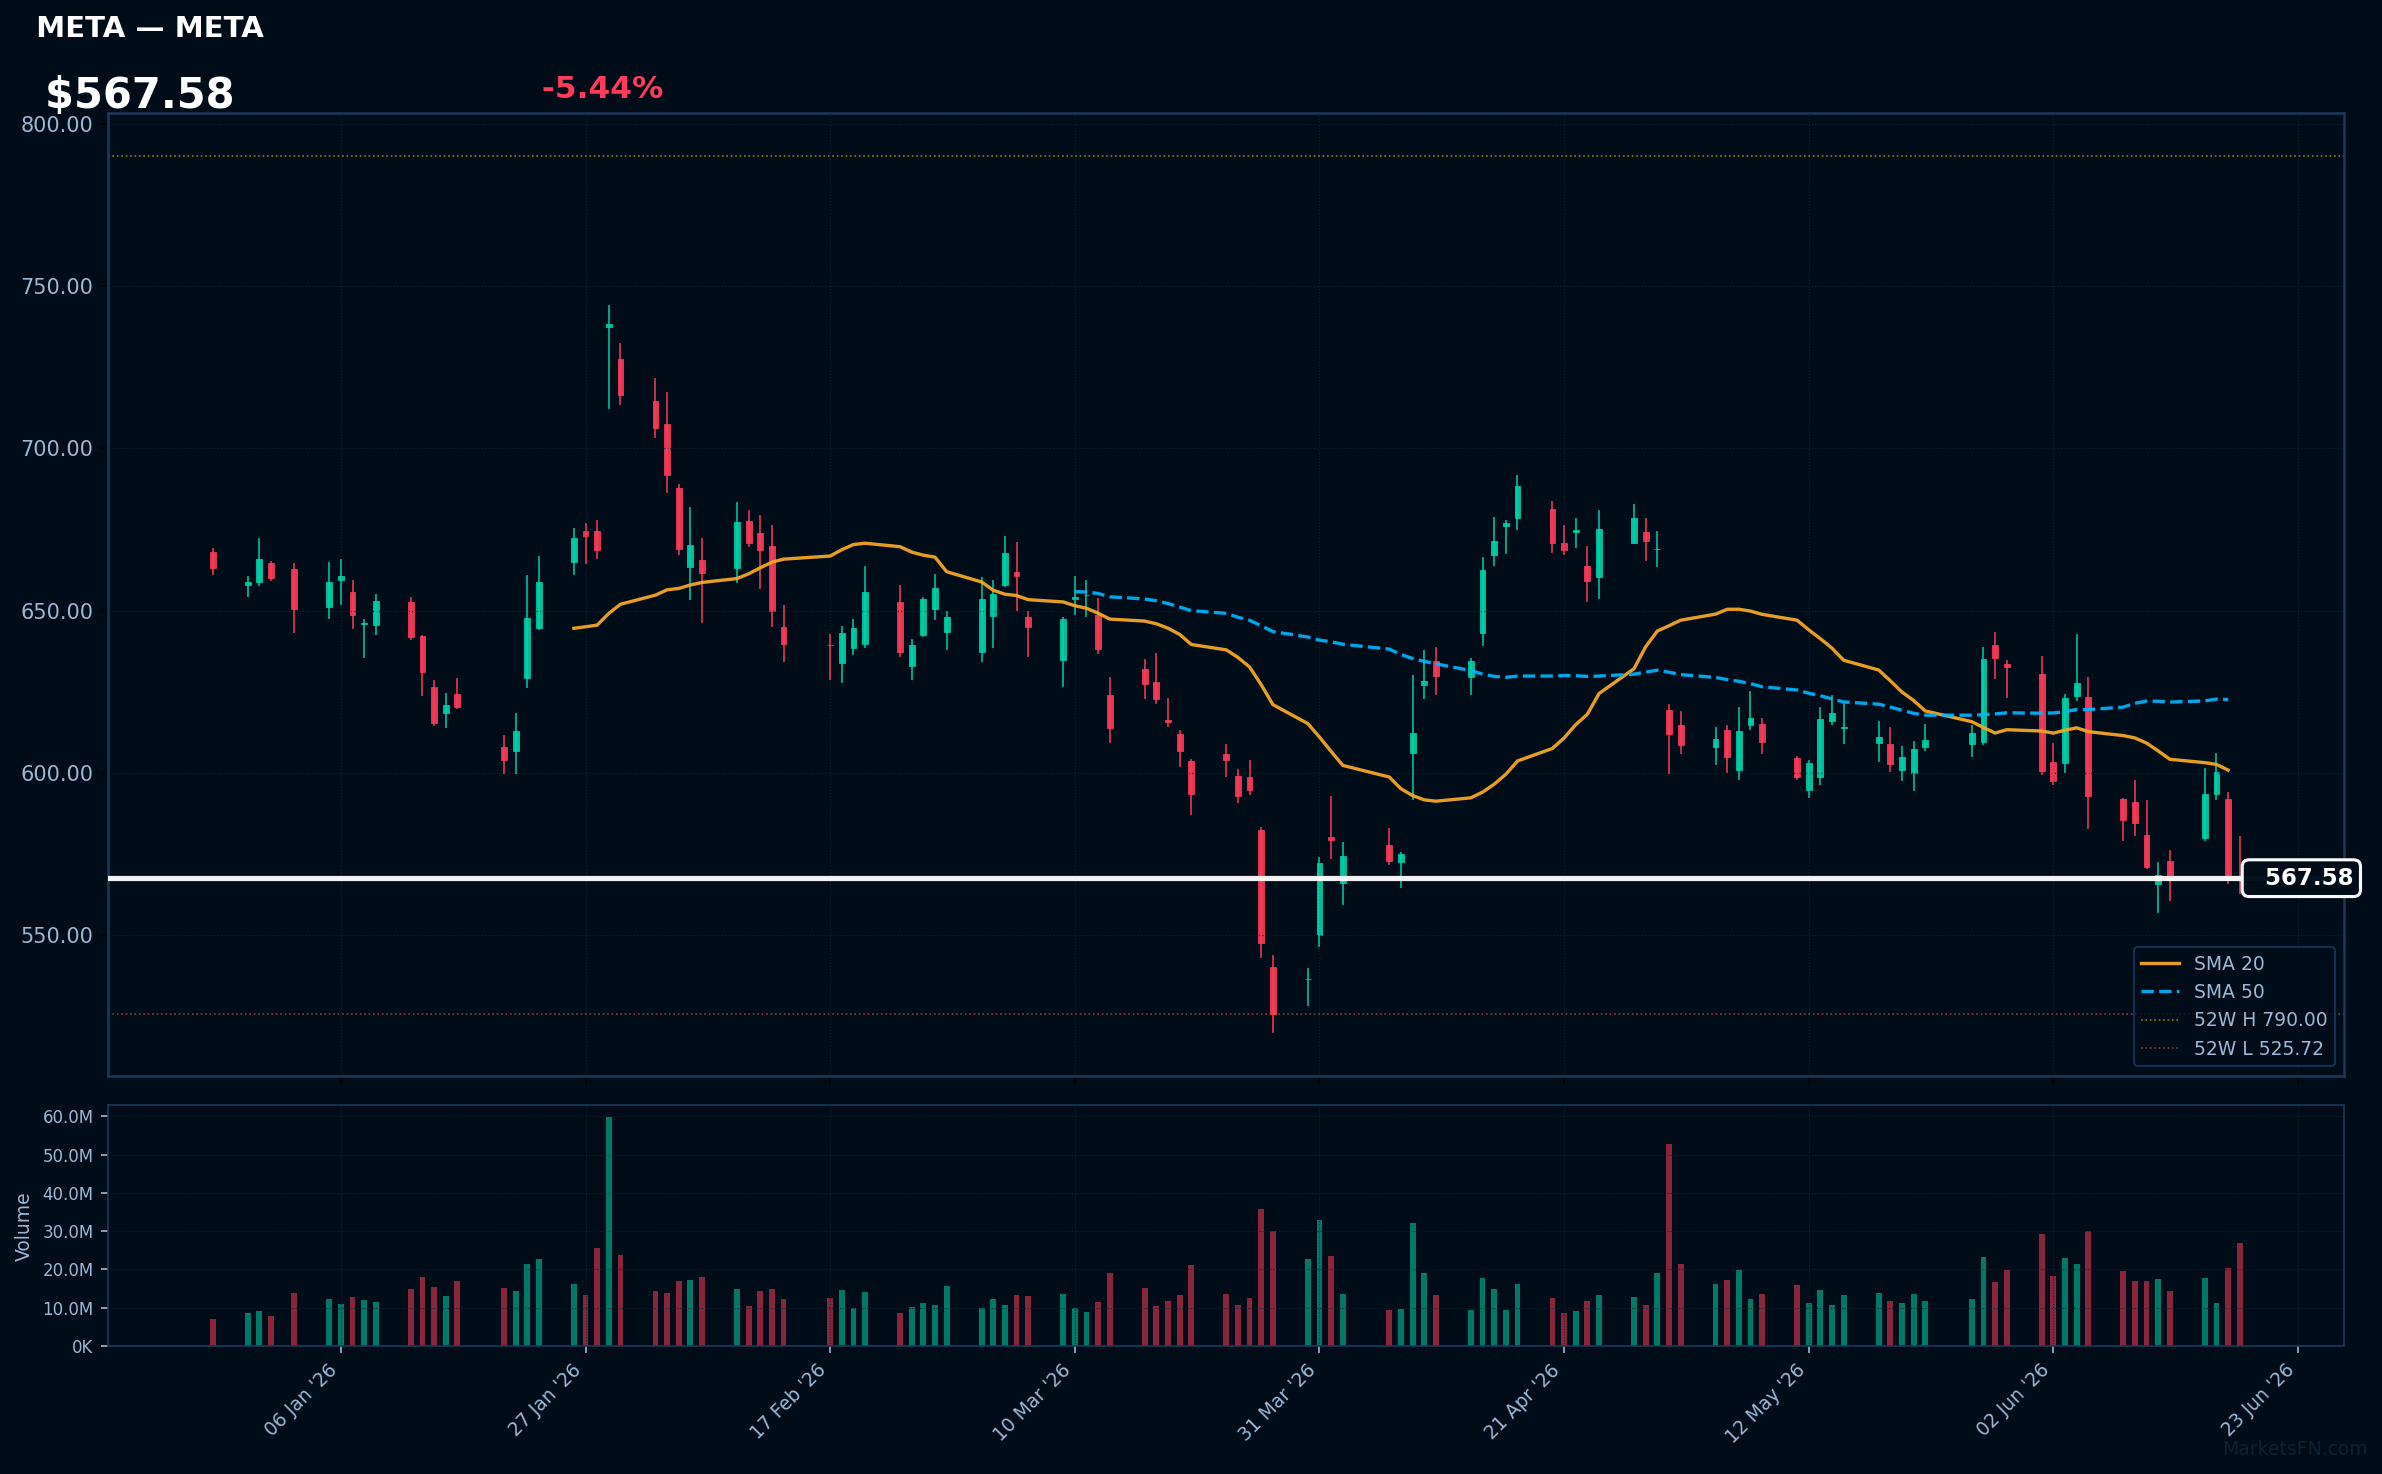
META | Meta Platforms Inc | Communication Services | Price: $567.58 | Day: -5.44% | 1W: -0.60% | 1M: -7.14% | RSI: 39.3 | vs MA200: -13.4% | Trend: Below MA20, MA50, MA200
Recent headlines (last 12h)
- Zurich warns data centre boom is outpacing insurance capacity report
- Meta Seeks Legal Shield in Child Safety Cases as KOSA Debate Continues (META)
- Meta's AI Infrastructure Bet Gets Bigger
- Meta Seeks Legal Shield
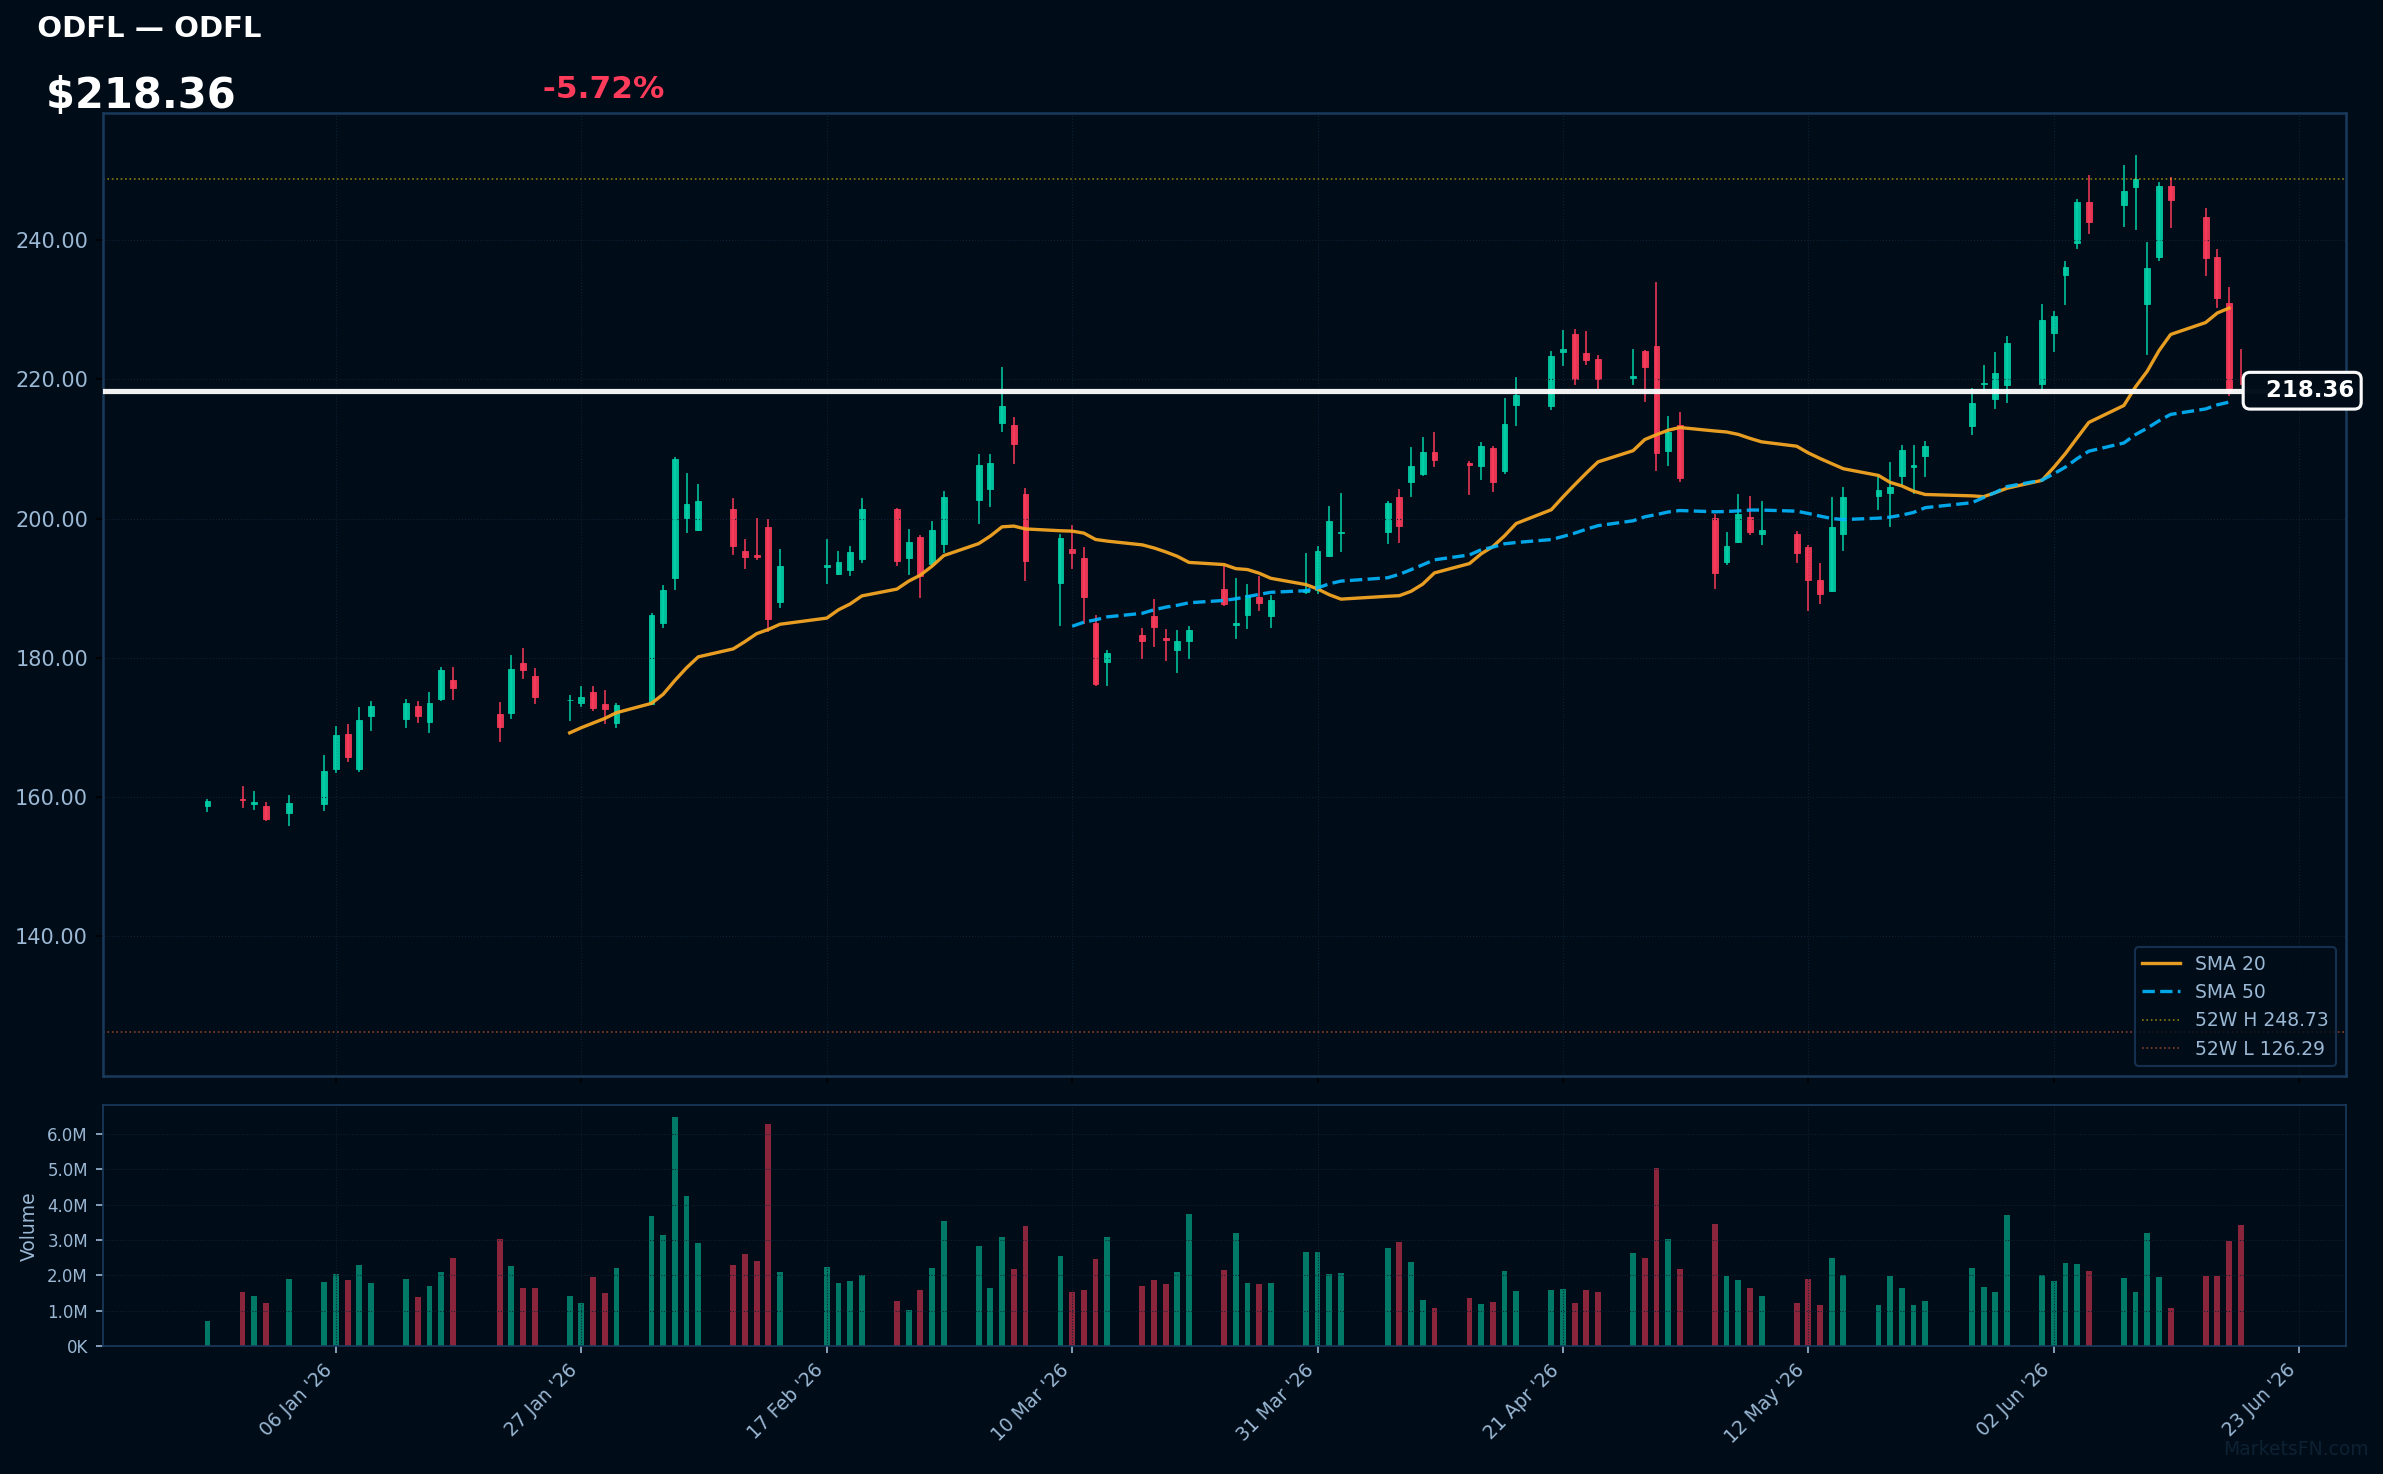
ODFL | Old Dominion Freight Line, Inc | Industrials | Price: $218.36 | Day: -5.72% | 1W: -7.45% | 1M: +6.97% | RSI: 44.6 | vs MA200: +24.0% | Trend: Above MA50, MA200 · Below MA20
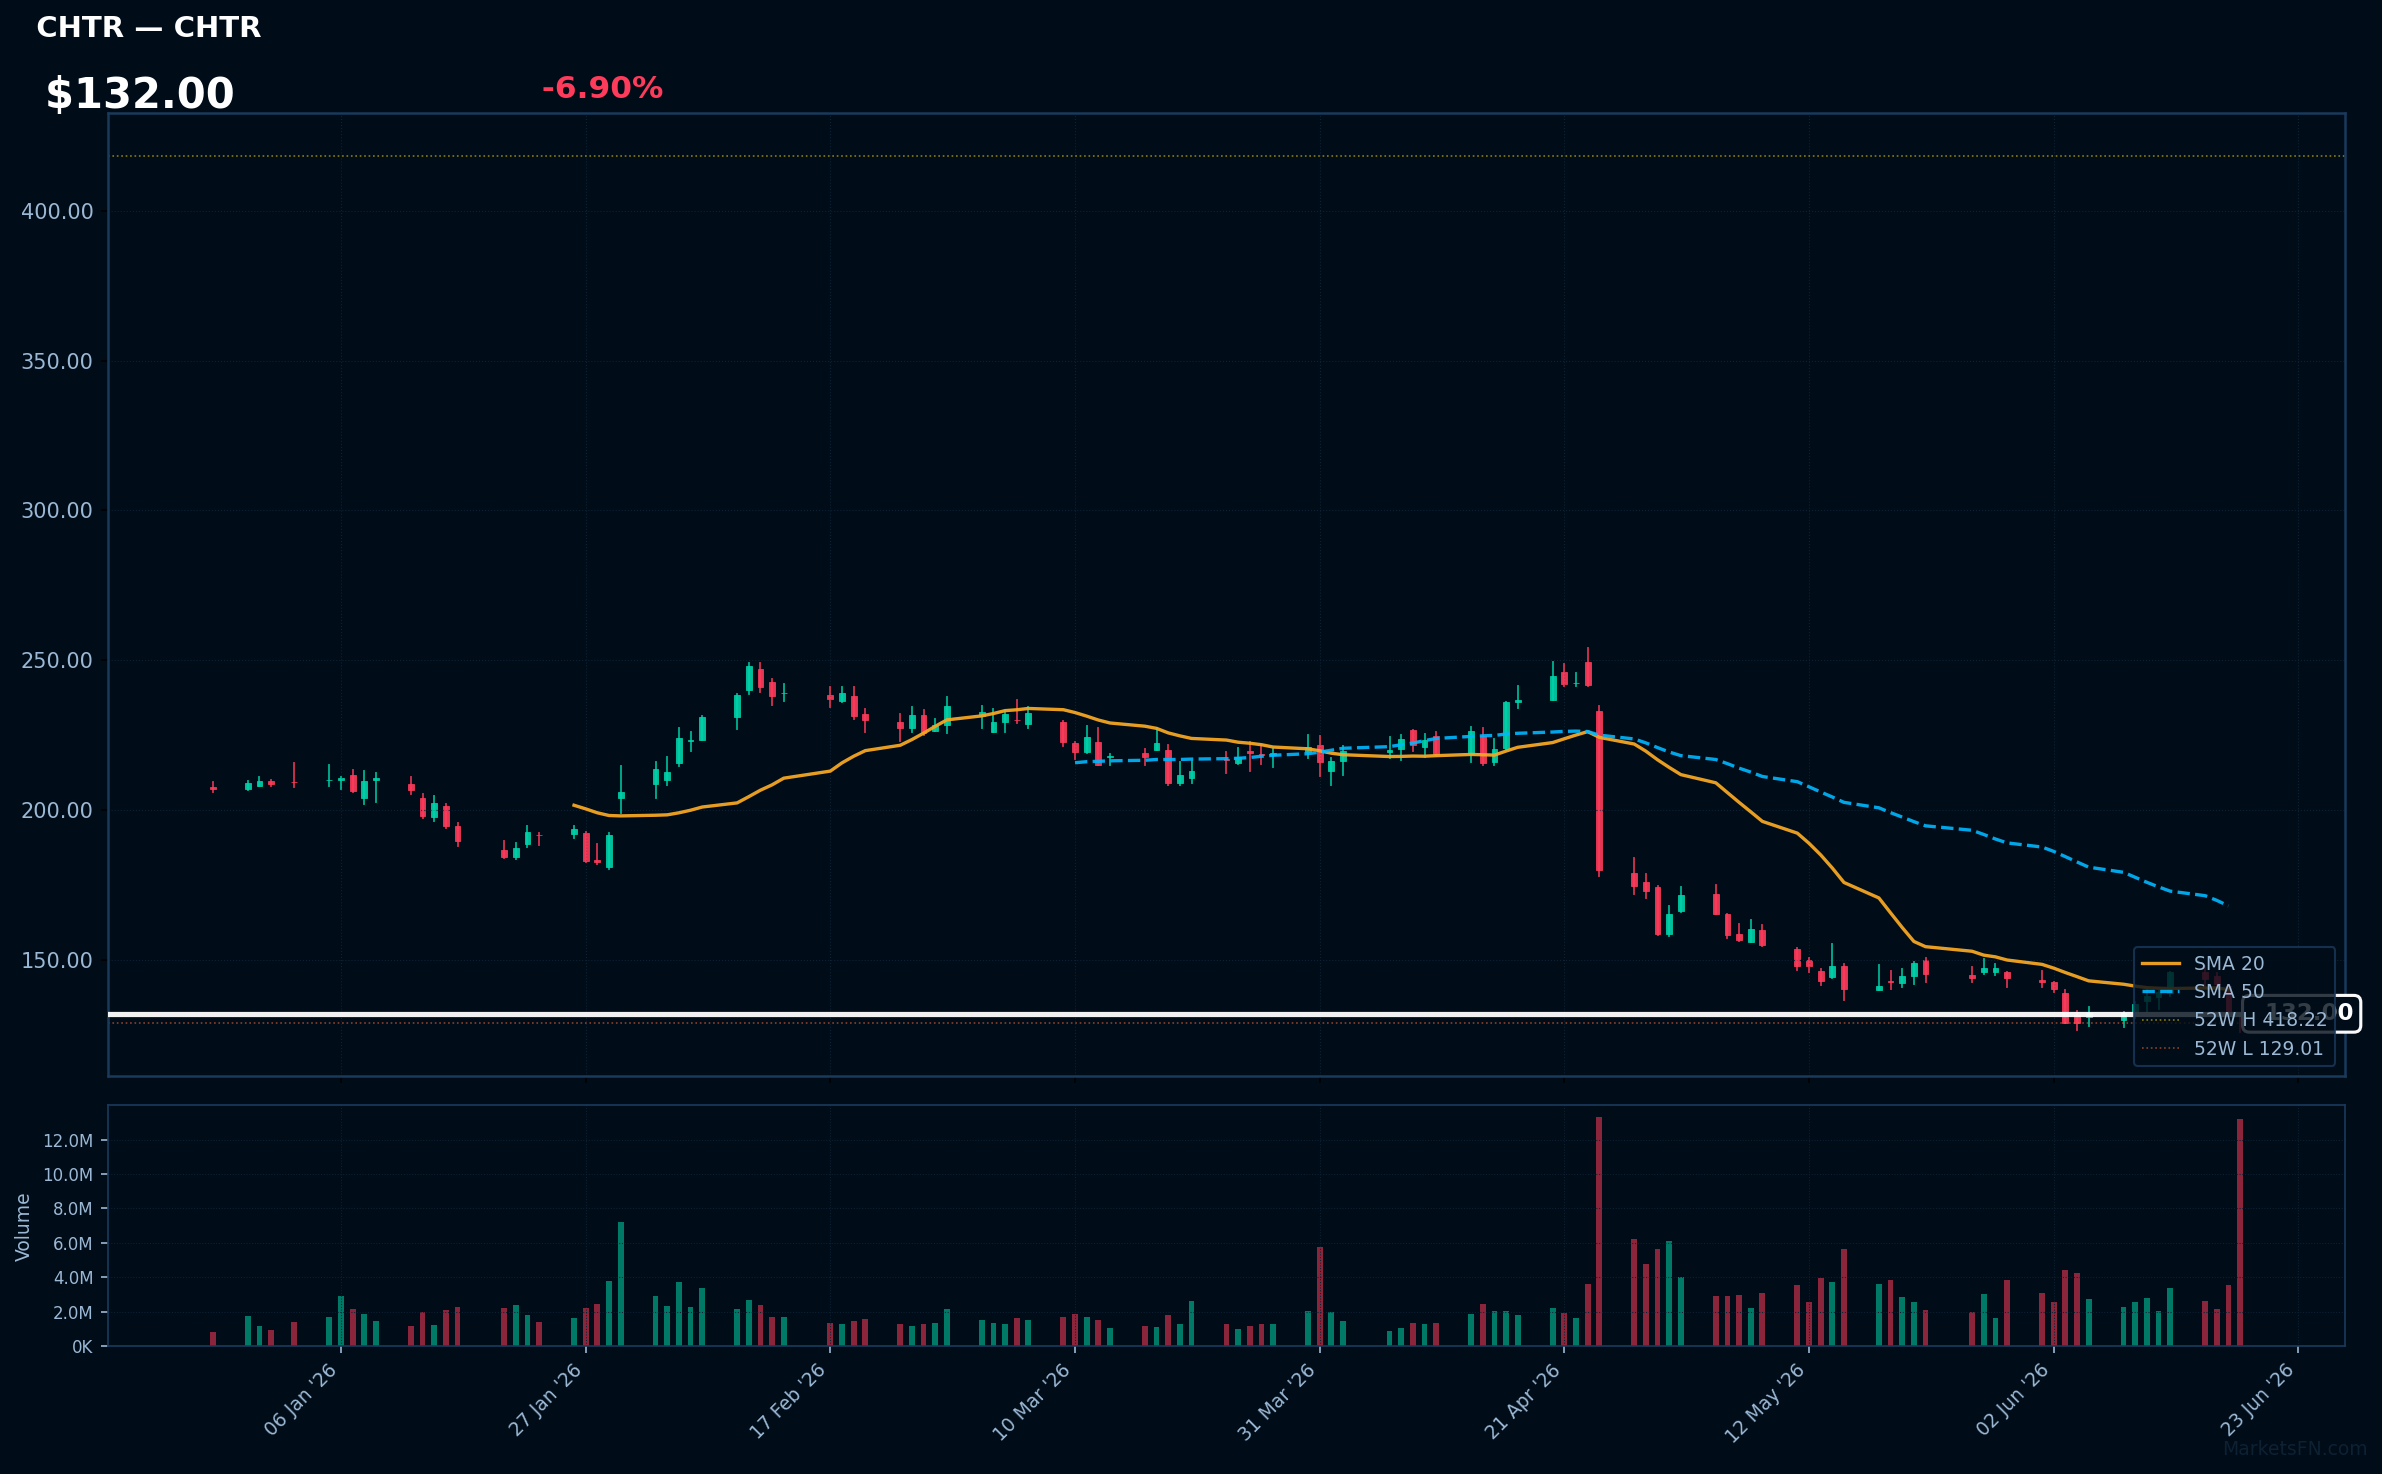
CHTR | Charter Communications Inc | Communication Services | Price: $132.00 | Day: -6.90% | 1W: -4.20% | 1M: -6.52% | RSI: 35.7 | vs MA200: -37.8% | Trend: Below MA20, MA50, MA200
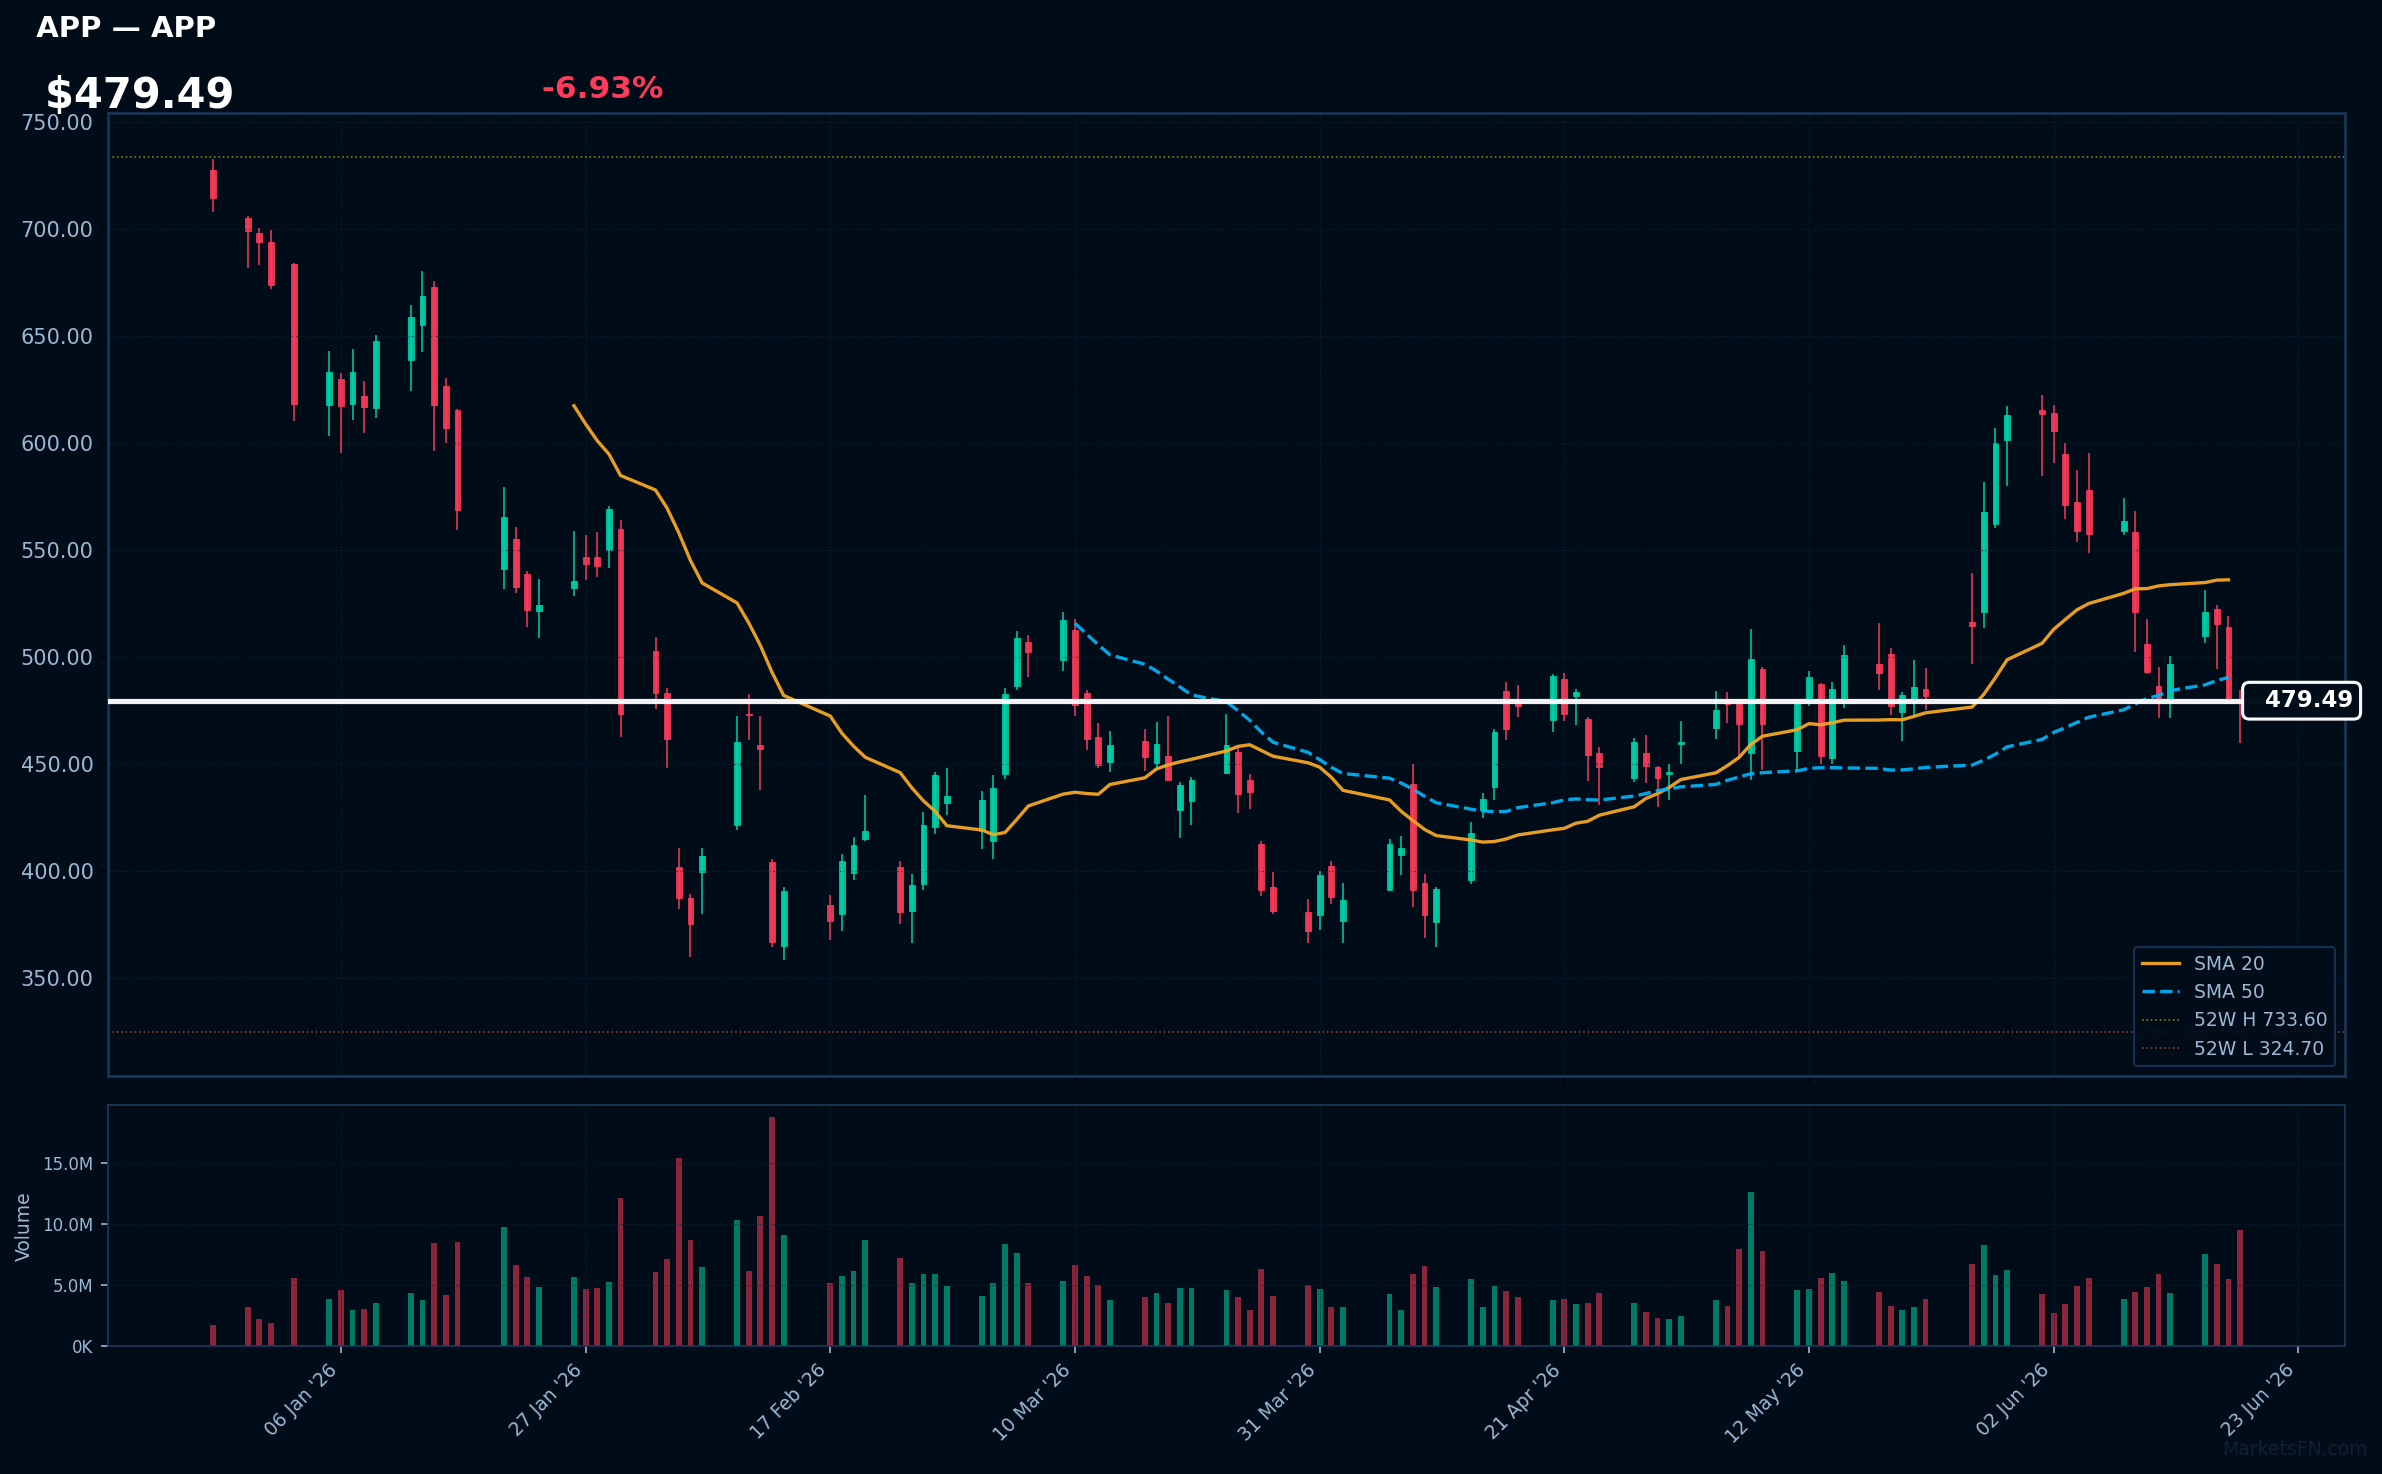
APP | Applovin Corp | Communication Services | Price: $479.49 | Day: -6.93% | 1W: -2.74% | 1M: -2.62% | RSI: 42.7 | vs MA200: -11.6% | Trend: Below MA20, MA50, MA200
Market Commentary
The Nasdaq 100 session on June 19, 2026, was characterized by weak breadth, with decliners outnumbering advancers 83 to 17, or nearly 5:1. This imbalance is reflected in the average daily change of 1.77%, which, despite being positive, masks the underlying weakness as only 16.8% of constituents advanced.
The technology sector exhibited a mixed performance, with top gainers including semiconductor stocks like ARM, AMAT, and AVGO, while technology names such as ADBE and MSTR featured among the top losers. This dichotomy suggests a rotation within the sector, potentially driven by earnings expectations or sector-specific news. The presence of Healthcare and Industrials stocks among the gainers and losers, respectively, further indicates a nuanced market environment.
With only 11.9% of stocks trading above their MA200, the overall trend remains fragile. Traders should monitor the MA200 level closely, as a breach could signal further downside. The average daily change of 1.77% may also be a key level to watch for signs of momentum continuation or reversal. A catalyst for change could be the upcoming earnings reports from key Nasdaq 100 constituents.
Methodology
Daily ranking uses the latest session close versus the prior close. RSI (14-day EWM), MA20, MA50, and MA200 are computed from 12 months of daily OHLCV data sourced from Yahoo Finance. Charts show the last 120 trading sessions with SMA 20/50, 52-week H/L markers, and volume. Recent news (last 12 h) is sourced from FinViz. Updated every trading day.
Disclaimer
The content on MarketsFN.com is provided for educational and informational purposes only. It does not constitute financial advice, investment recommendations, or trading guidance. All investments involve risks, and past performance does not guarantee future results. You are solely responsible for your investment decisions and should conduct independent research and consult a qualified financial advisor before acting. MarketsFN.com and its authors are not liable for any losses or damages arising from your use of this information.
Related Articles
- Nasdaq 100 Bull & Bear Radar — June 18, 2026 — Nasdaq 100 Bull & Bear Radar — June 18, 2026 A daily technical sweep of 101 Nasdaq 100 constituents ranked by session…
- Nasdaq 100 52-Week Highs & Lows Radar: ASML Holding NV (ASML), Palantir (PLTR) and more — Nasdaq 100 stocks nearest to their 52-week high and low. Bloomberg-style charts, RSI/MA analysis and Grok commentary.
- The Kroger Co. (KR) Sinks 6.80% After Earnings — Post Earning Analysis The Kroger Co. (KR) Sinks 6.80% After Earnings The Kroger Co. operates a chain of supermarkets…
- Kroger (KR) quarter year Kroger Co. Financial Results Summary — Kroger (KR) Q1 2026: Earnings Growth Amidst Sales Pressure — Cautiously Optimistic Kroger Co. (NYSE: KR) reported its…
- S&P 500 52-Week Highs & Lows Radar: JPMorgan Chase & (JPM), Palantir (PLTR) and more — S&P 500 stocks nearest to their 52-week high and low. Bloomberg-style charts, RSI/MA analysis and Grok commentary.