S&P 500 Bull & Bear Radar — June 19, 2026
· Stocks · QuoteReporter
S&P 500 Bull & Bear Radar — June 19, 2026
A daily technical sweep of 495 S&P 500 constituents ranked by session performance, enriched with RSI, MA20/MA50/MA200 trend signals, Bloomberg-style charts, and recent news.
Index-Wide Breadth
| Constituents tracked | 495 |
| Advancing | 66 (13.3%) |
| Declining | 428 (86.5%) |
| Average daily change | 1.73% |
| Above MA200 | 11 (2.2%) |
Top 10 Gainers
Today's strongest S&P 500 performers. Sector leadership: Technology (6), Industrials (2), Healthcare (1), Basic Materials (1).
| Ticker | Company | Sector | Price | Day % | 1W % | 1M % | RSI | vs MA200 | Trend |
|---|---|---|---|---|---|---|---|---|---|
| MRNA | Moderna Inc | Healthcare | $61.80 | +11.55% | +34.38% | +28.46% | 72.8 | +58.4% | Above MA20, MA50, MA200 |
| GEV | GE Vernova Inc | Industrials | $1048.86 | +6.77% | +20.96% | +3.62% | 59.5 | +36.2% | Above MA20, MA50, MA200 |
| WDC | Western Digital Corp | Technology | $712.13 | +4.56% | +45.31% | +55.26% | 75.7 | +171.0% | Above MA20, MA50, MA200 |
| AMAT | Applied Materials Inc | Technology | $592.92 | +4.35% | +19.30% | +43.37% | 73.4 | +87.9% | Above MA20, MA50, MA200 |
| AVGO | Broadcom Inc | Technology | $392.90 | +4.30% | +5.59% | -6.61% | 46.1 | +9.3% | Above MA200 · Below MA20, MA50 |
| MOS | Mosaic Company | Basic Materials | $22.51 | +3.78% | +13.57% | +5.14% | 50.2 | -16.1% | Above MA20 · Below MA50, MA200 |
| DELL | Dell Technologies Inc | Technology | $419.32 | +3.77% | +13.38% | +76.16% | 67.6 | +143.5% | Above MA20, MA50, MA200 |
| INTC | Intel Corp | Technology | $121.10 | +3.46% | +13.14% | +11.95% | 57.3 | +120.3% | Above MA20, MA50, MA200 |
| STX | Seagate Technology Holdings Plc | Technology | $1066.07 | +3.37% | +30.65% | +43.90% | 73.8 | +155.4% | Above MA20, MA50, MA200 |
| RTX | RTX Corp | Industrials | $192.58 | +3.11% | +8.55% | +9.45% | 66.0 | +5.6% | Above MA20, MA50, MA200 |
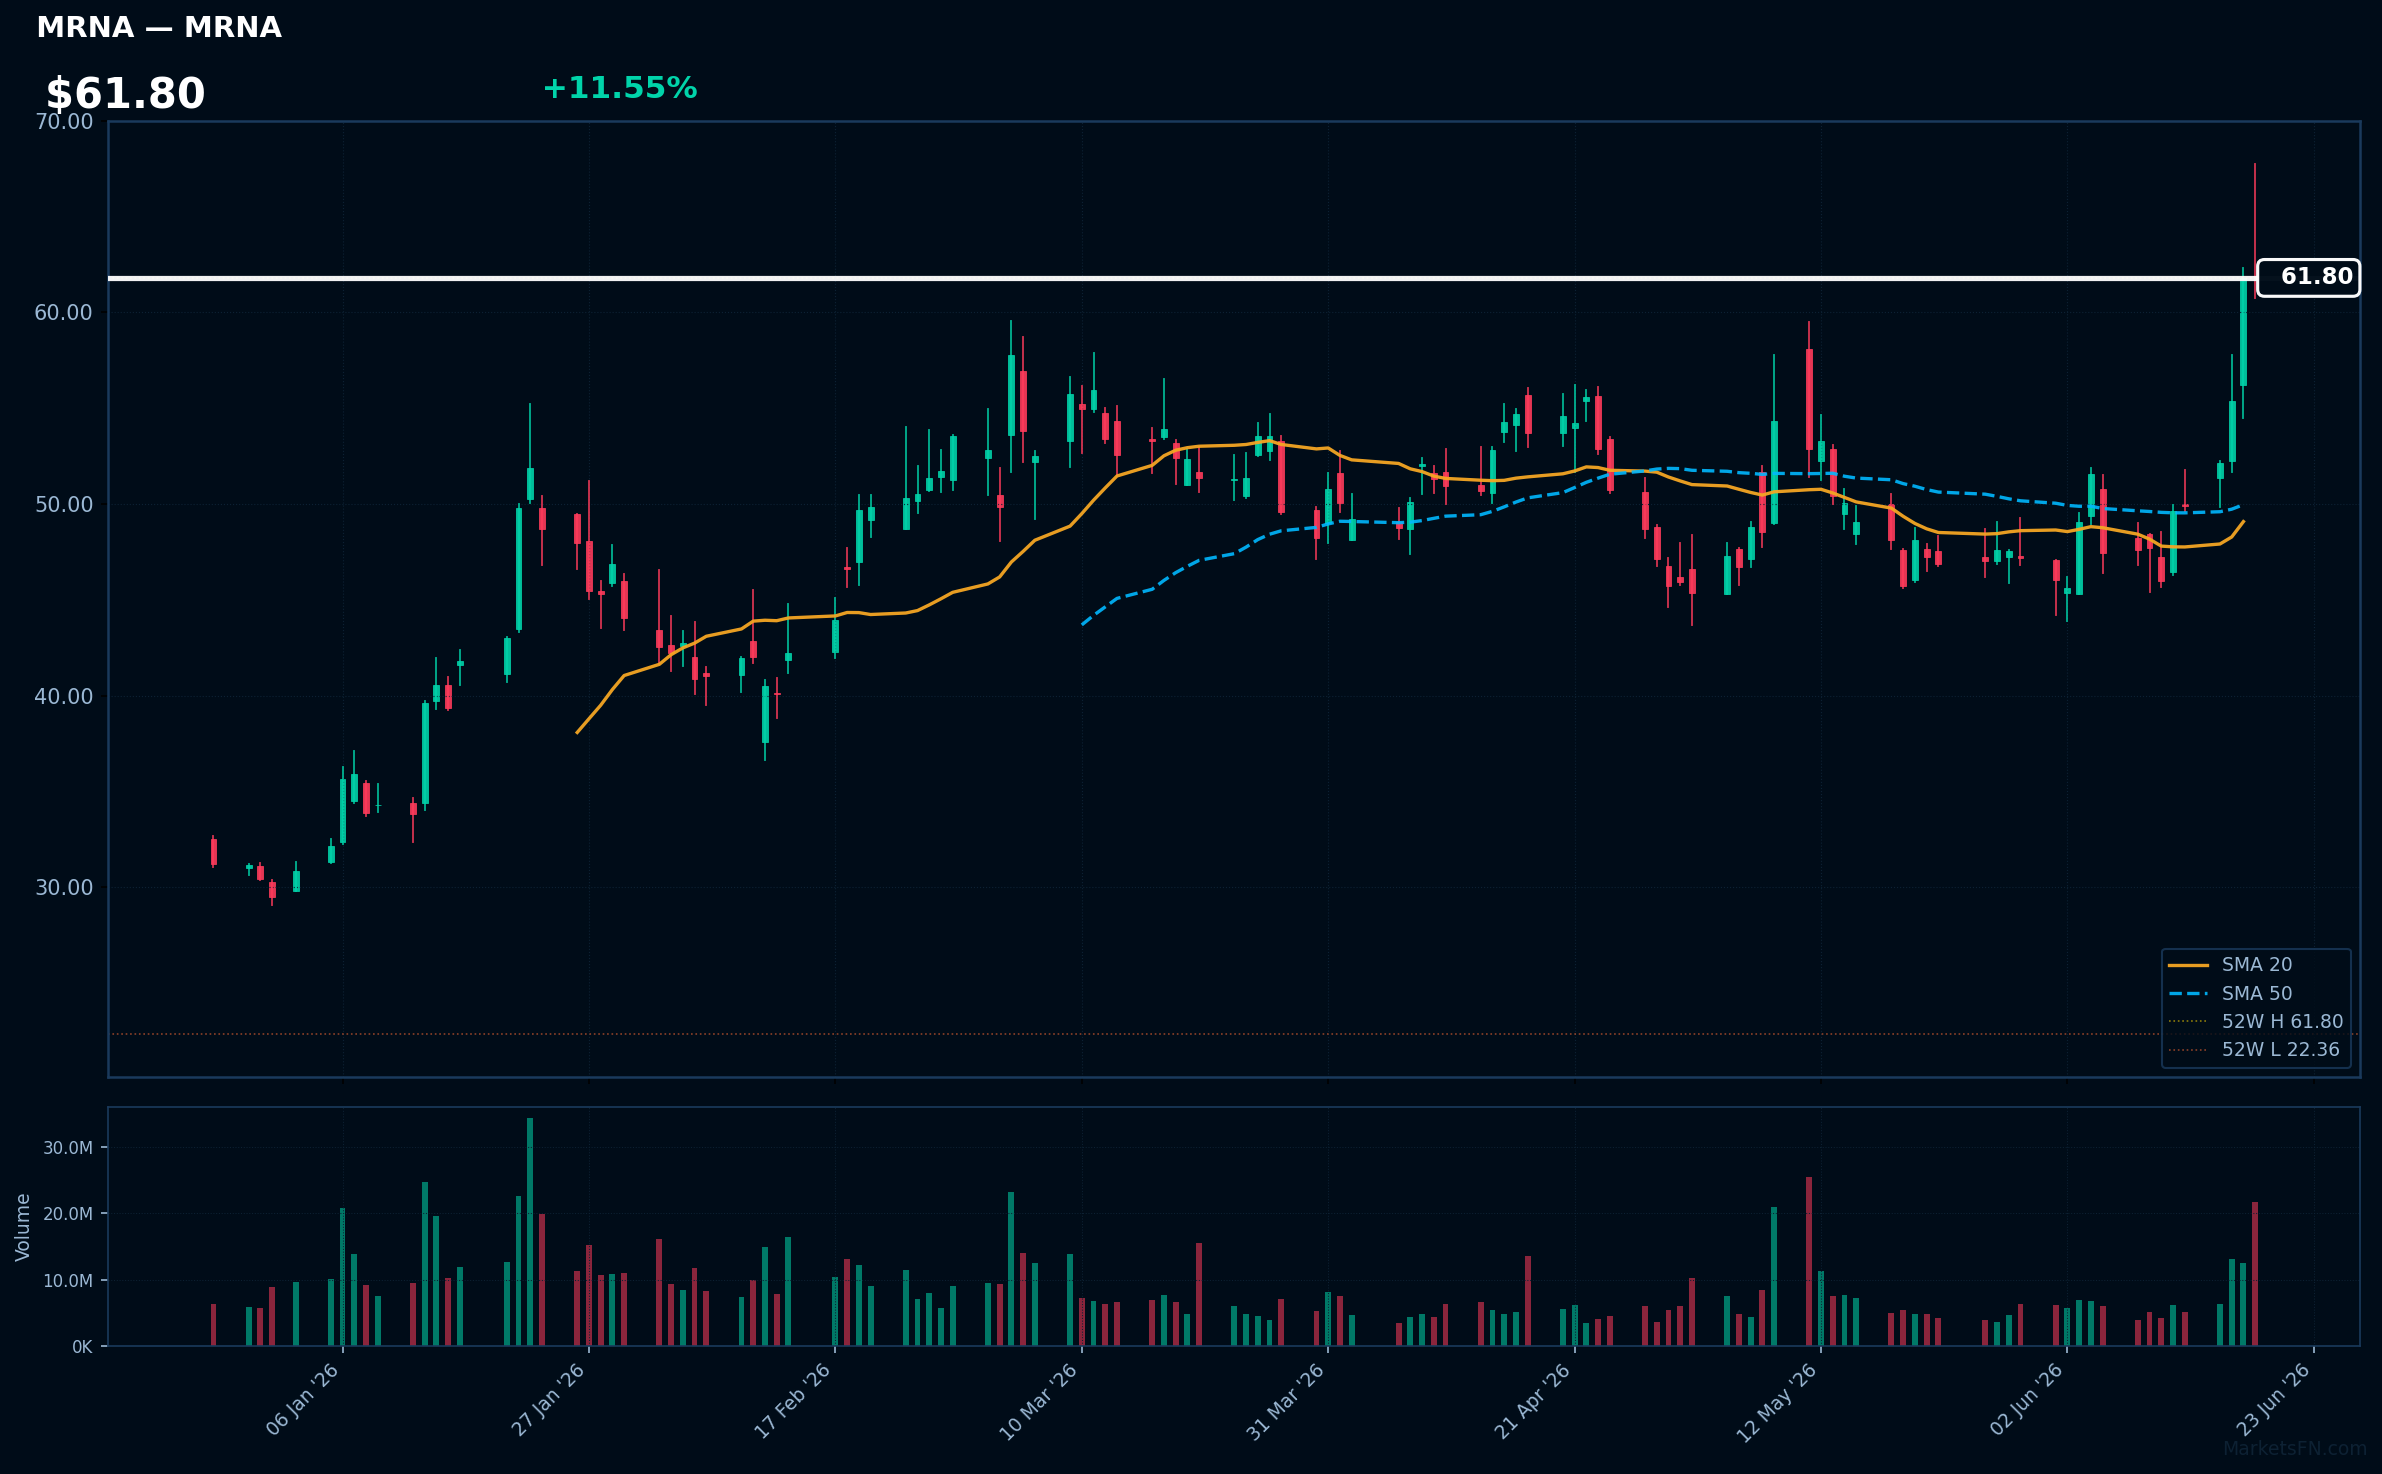
MRNA | Moderna Inc | Healthcare | Price: $61.80 | Day: +11.55% | 1W: +34.38% | 1M: +28.46% | RSI: 72.8 | vs MA200: +58.4% | Trend: Above MA20, MA50, MA200
GEV | GE Vernova Inc | Industrials | Price: $1048.86 | Day: +6.77% | 1W: +20.96% | 1M: +3.62% | RSI: 59.5 | vs MA200: +36.2% | Trend: Above MA20, MA50, MA200
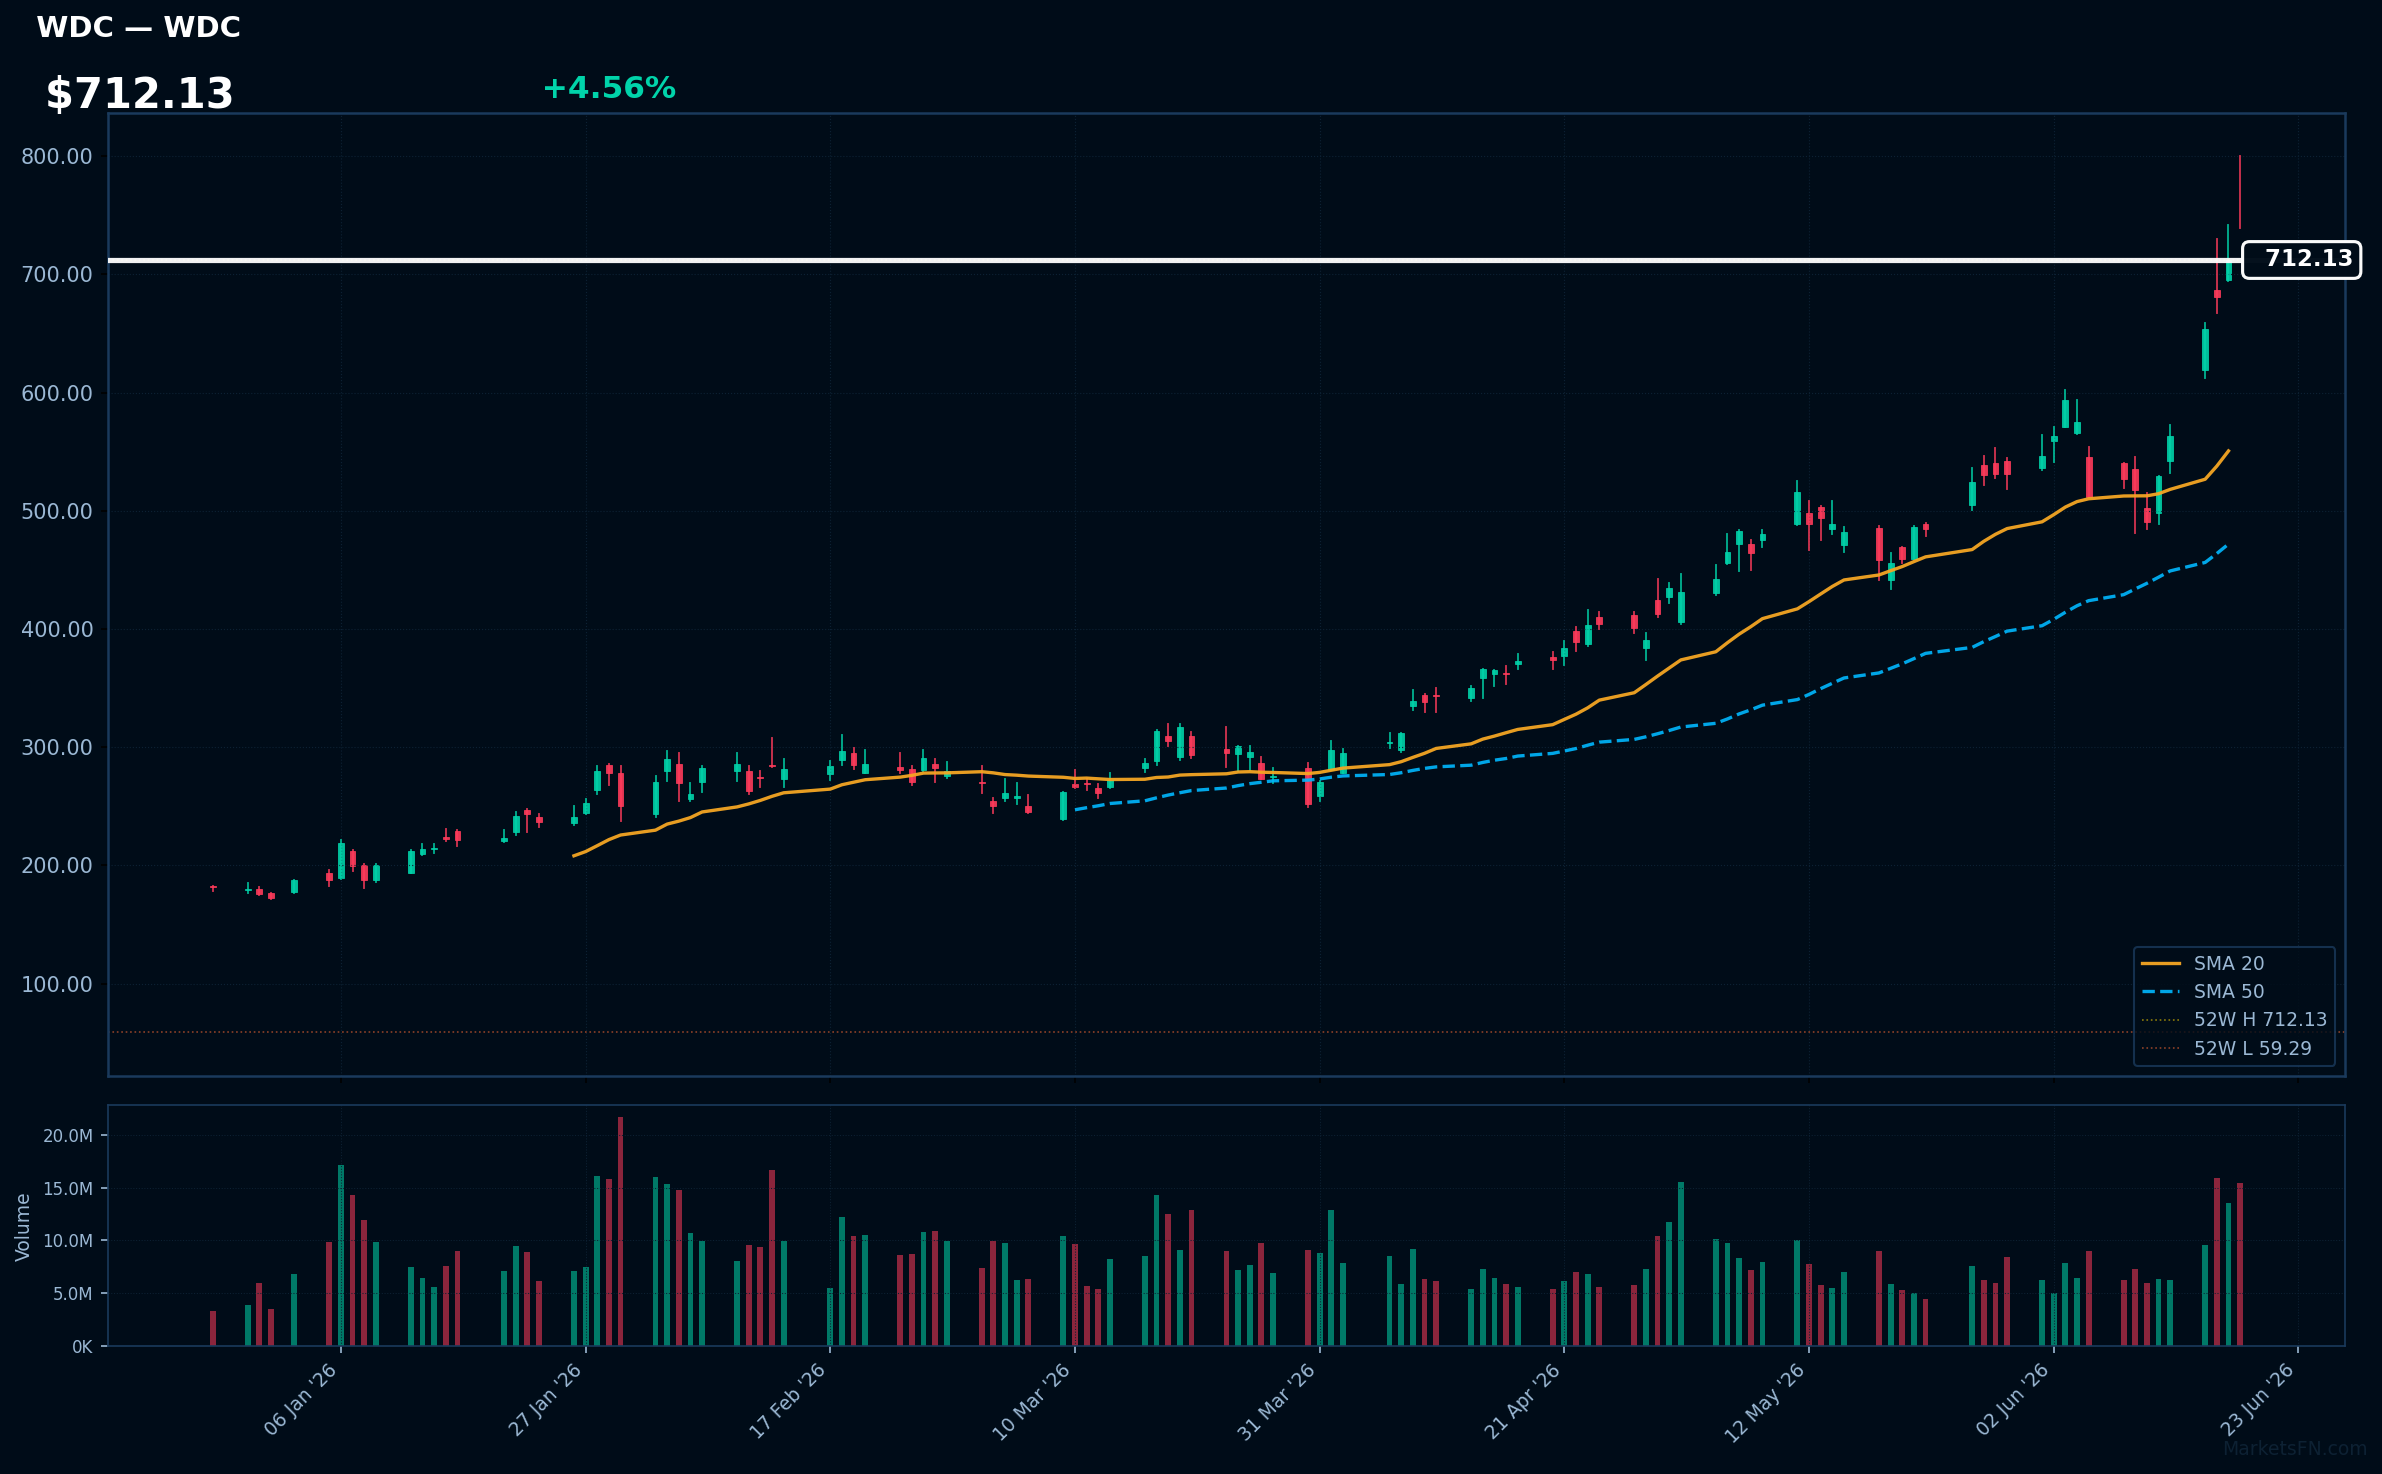
WDC | Western Digital Corp | Technology | Price: $712.13 | Day: +4.56% | 1W: +45.31% | 1M: +55.26% | RSI: 75.7 | vs MA200: +171.0% | Trend: Above MA20, MA50, MA200
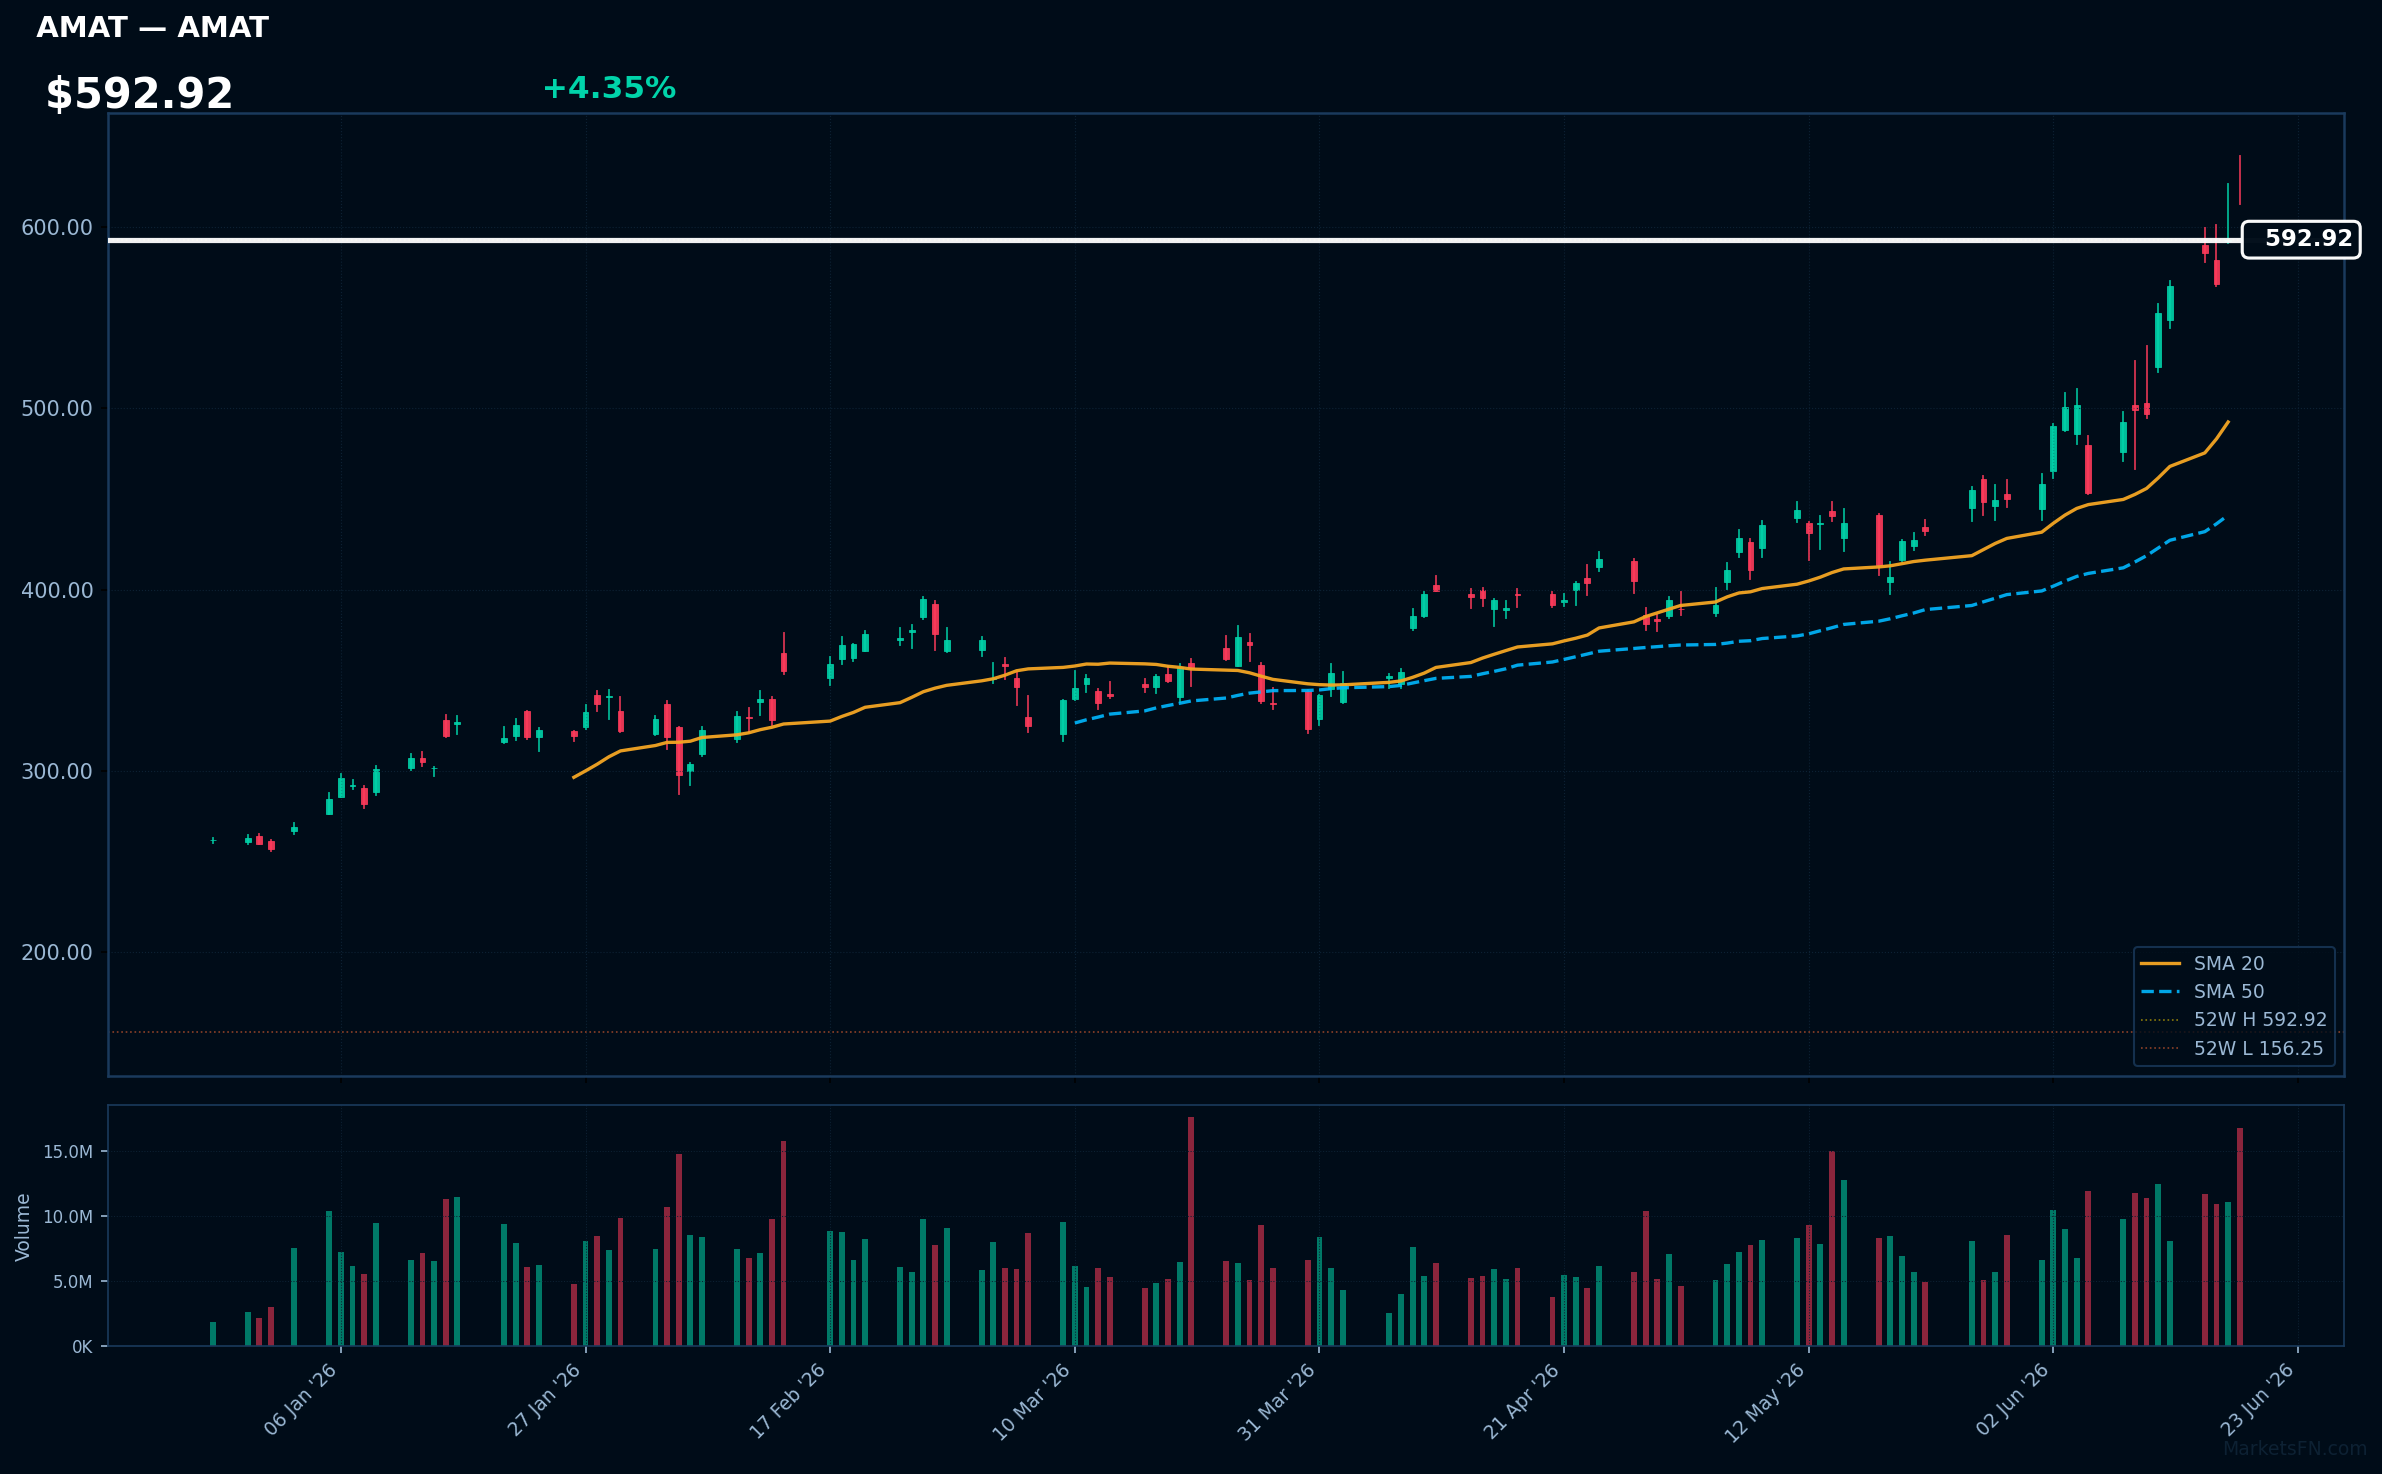
AMAT | Applied Materials Inc | Technology | Price: $592.92 | Day: +4.35% | 1W: +19.30% | 1M: +43.37% | RSI: 73.4 | vs MA200: +87.9% | Trend: Above MA20, MA50, MA200
Recent headlines (last 12h)
- US Tells ASML Its Concerned China May Have Top Chip Tool
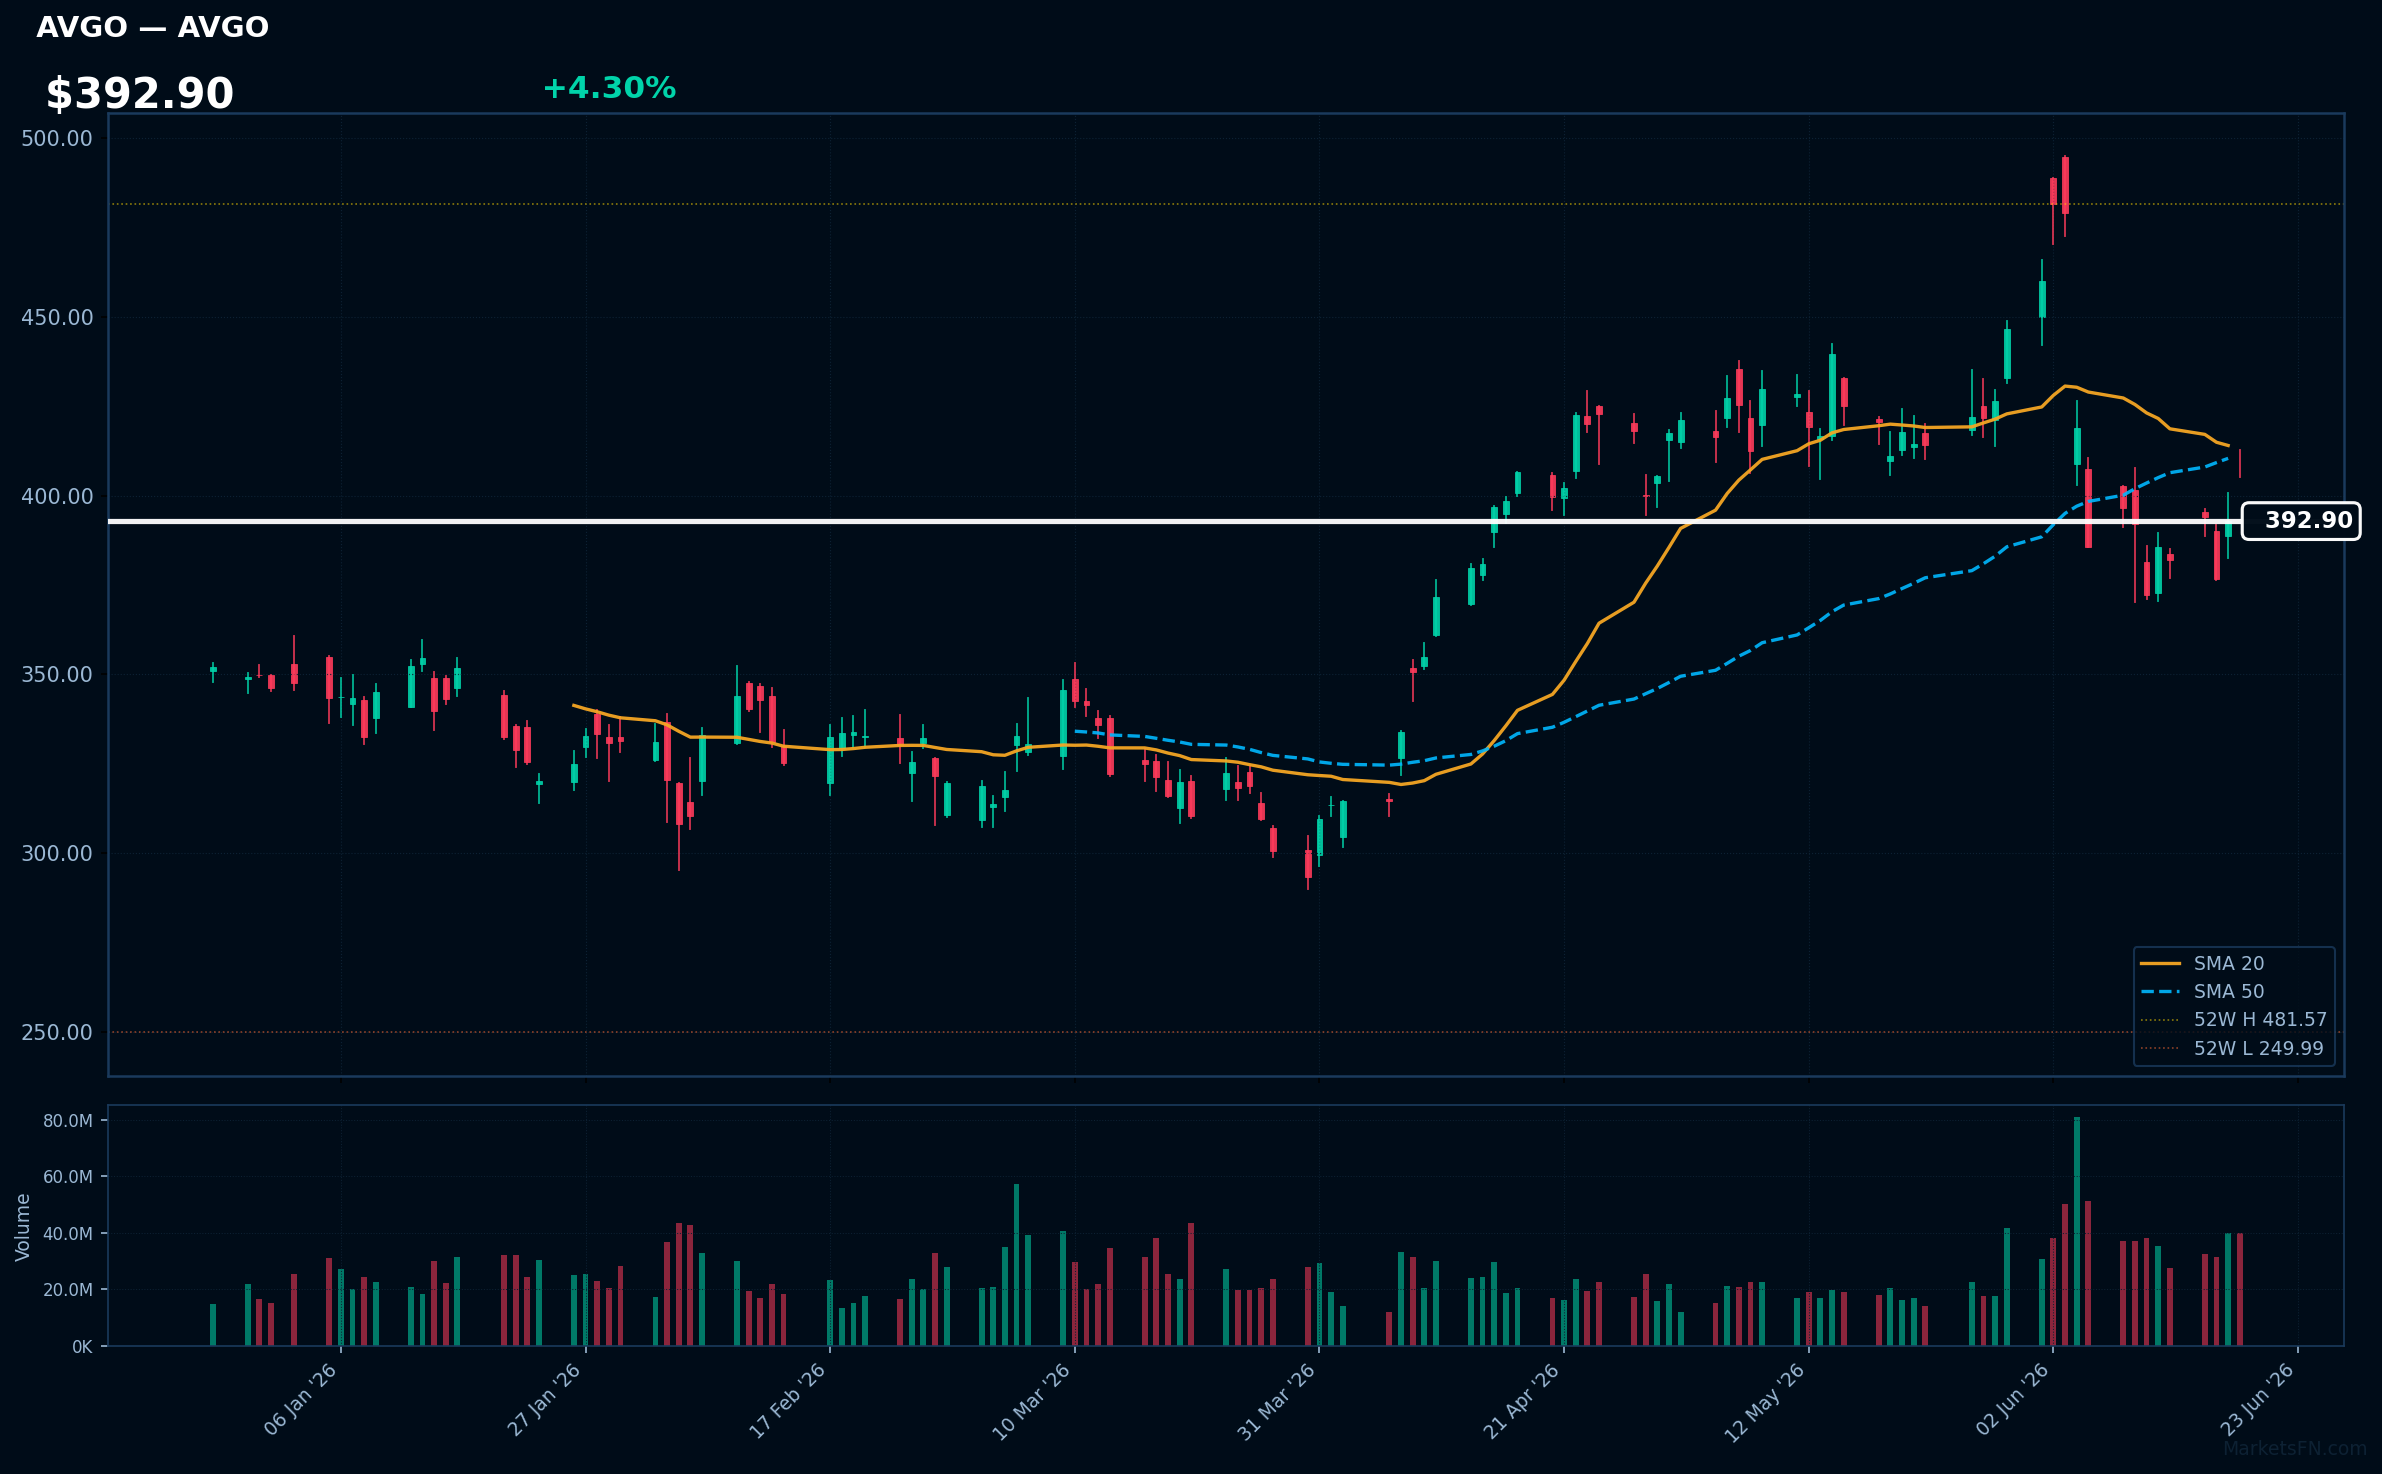
AVGO | Broadcom Inc | Technology | Price: $392.90 | Day: +4.30% | 1W: +5.59% | 1M: -6.61% | RSI: 46.1 | vs MA200: +9.3% | Trend: Above MA200 · Below MA20, MA50
Recent headlines (last 12h)
- Intel Leads Big Chip Stock Rally
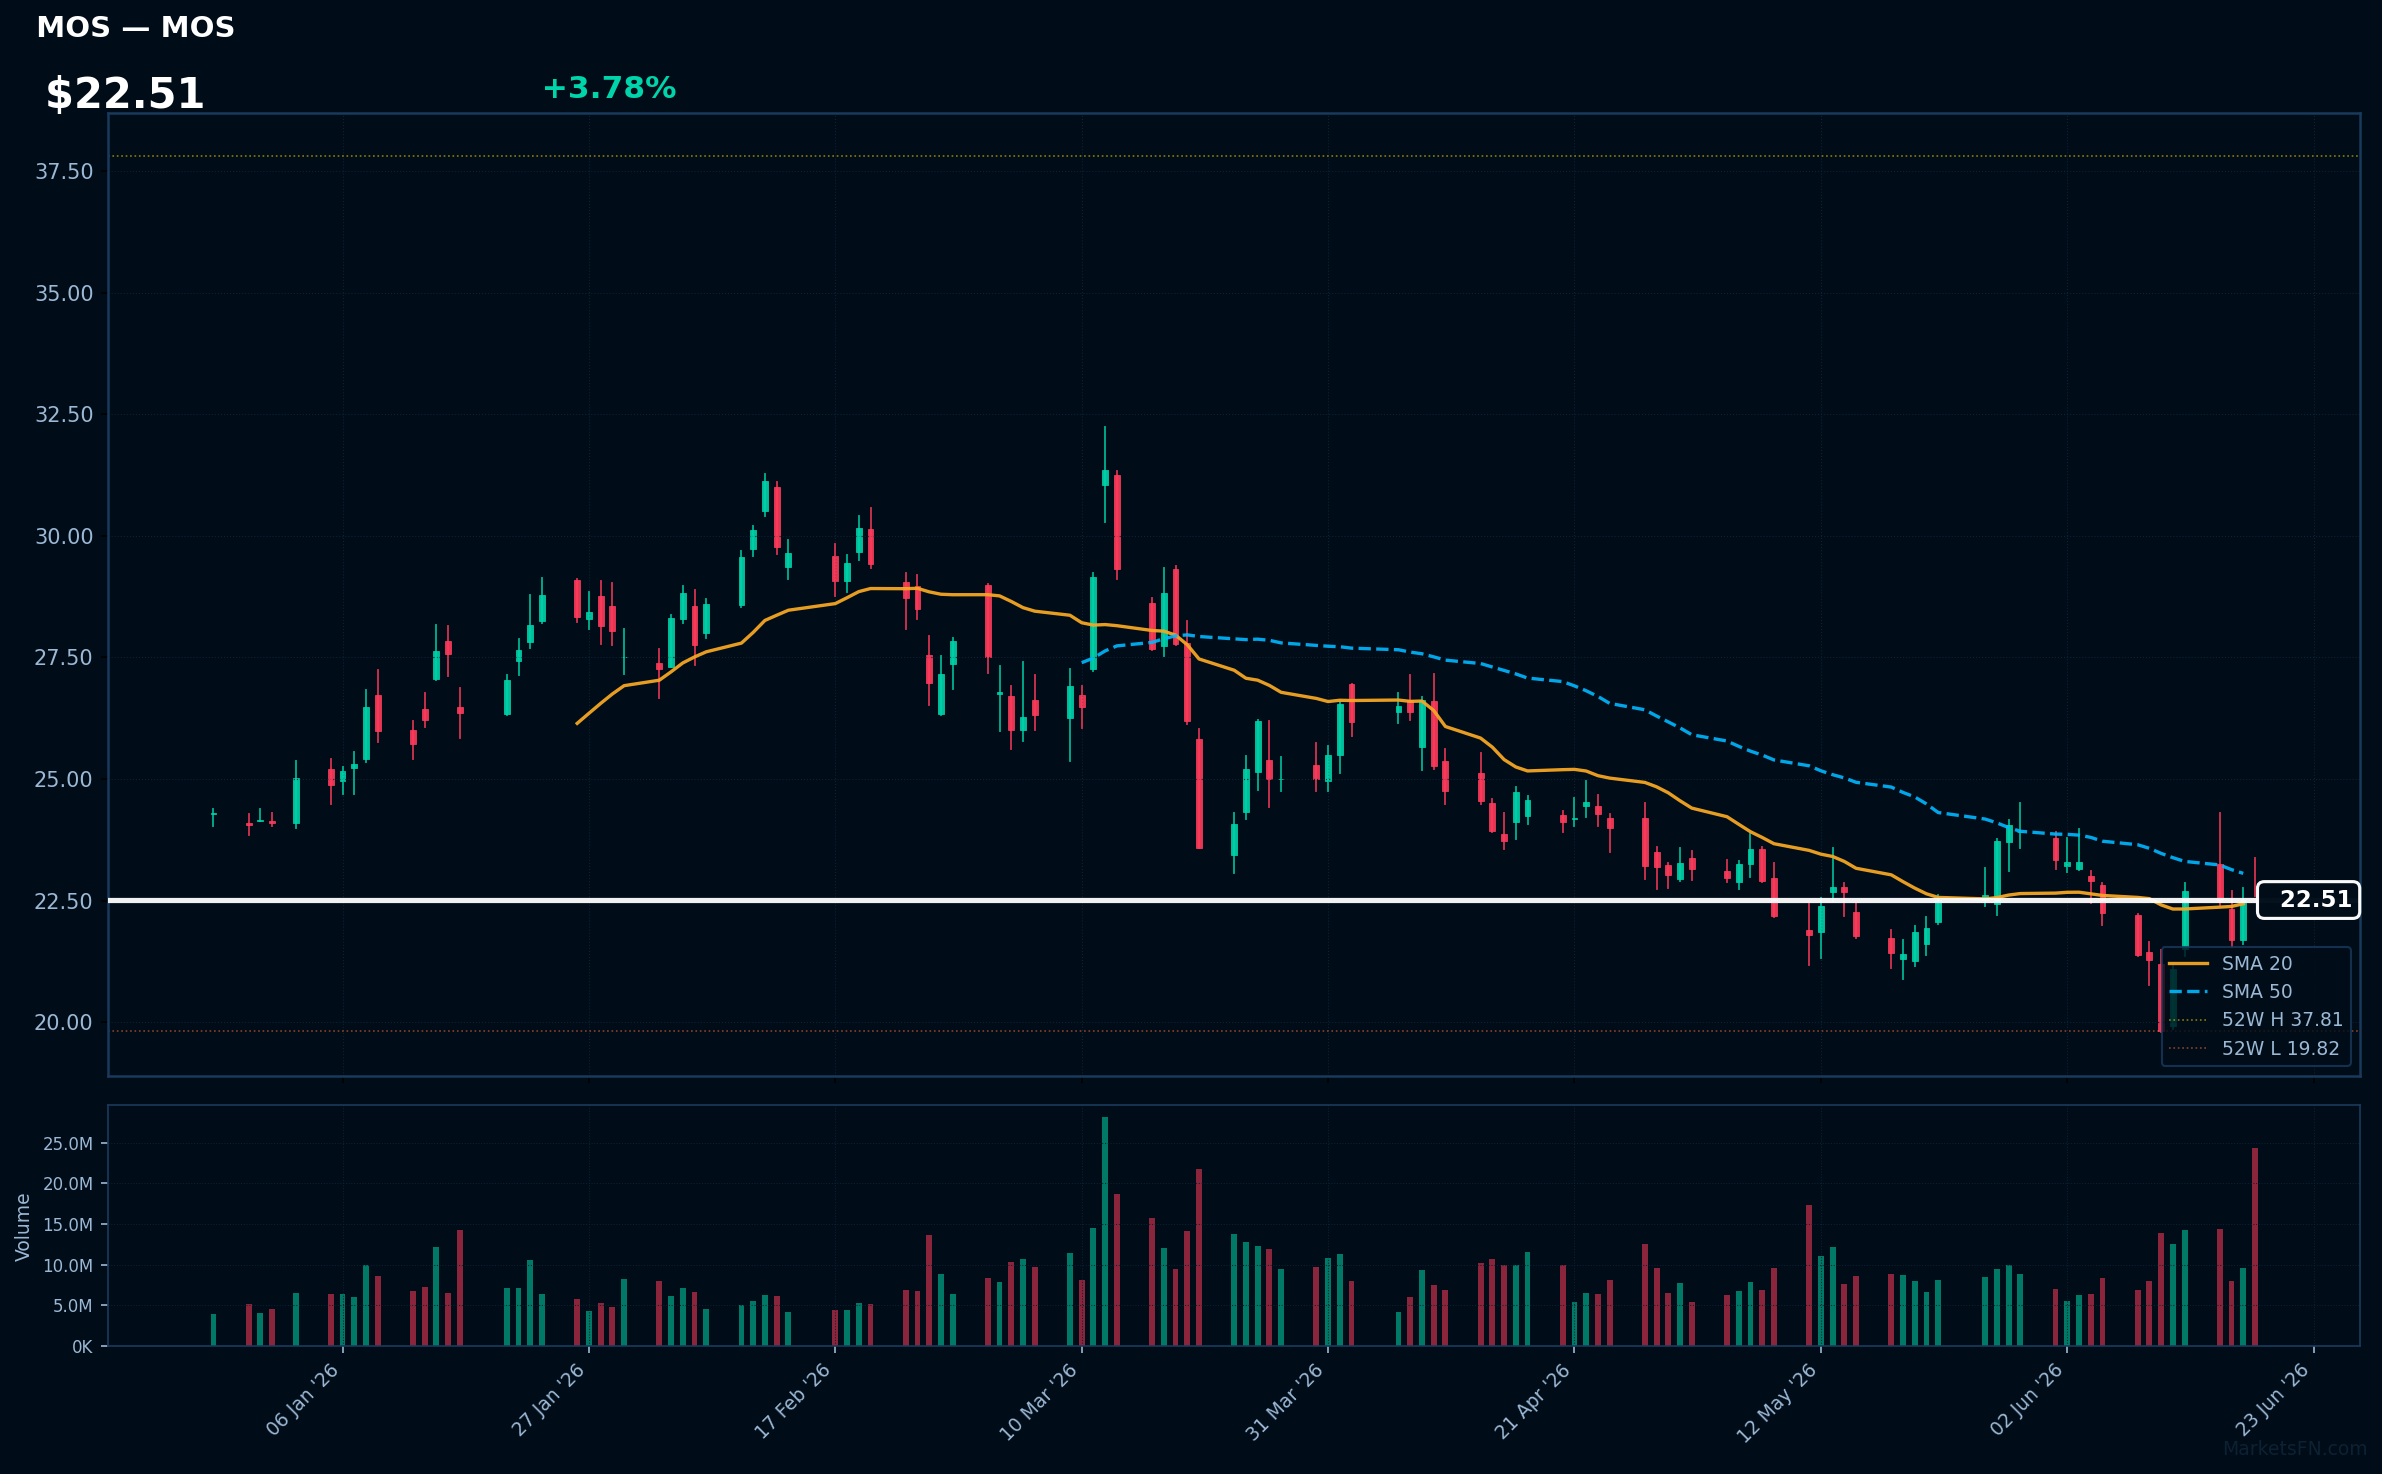
MOS | Mosaic Company | Basic Materials | Price: $22.51 | Day: +3.78% | 1W: +13.57% | 1M: +5.14% | RSI: 50.2 | vs MA200: -16.1% | Trend: Above MA20 · Below MA50, MA200
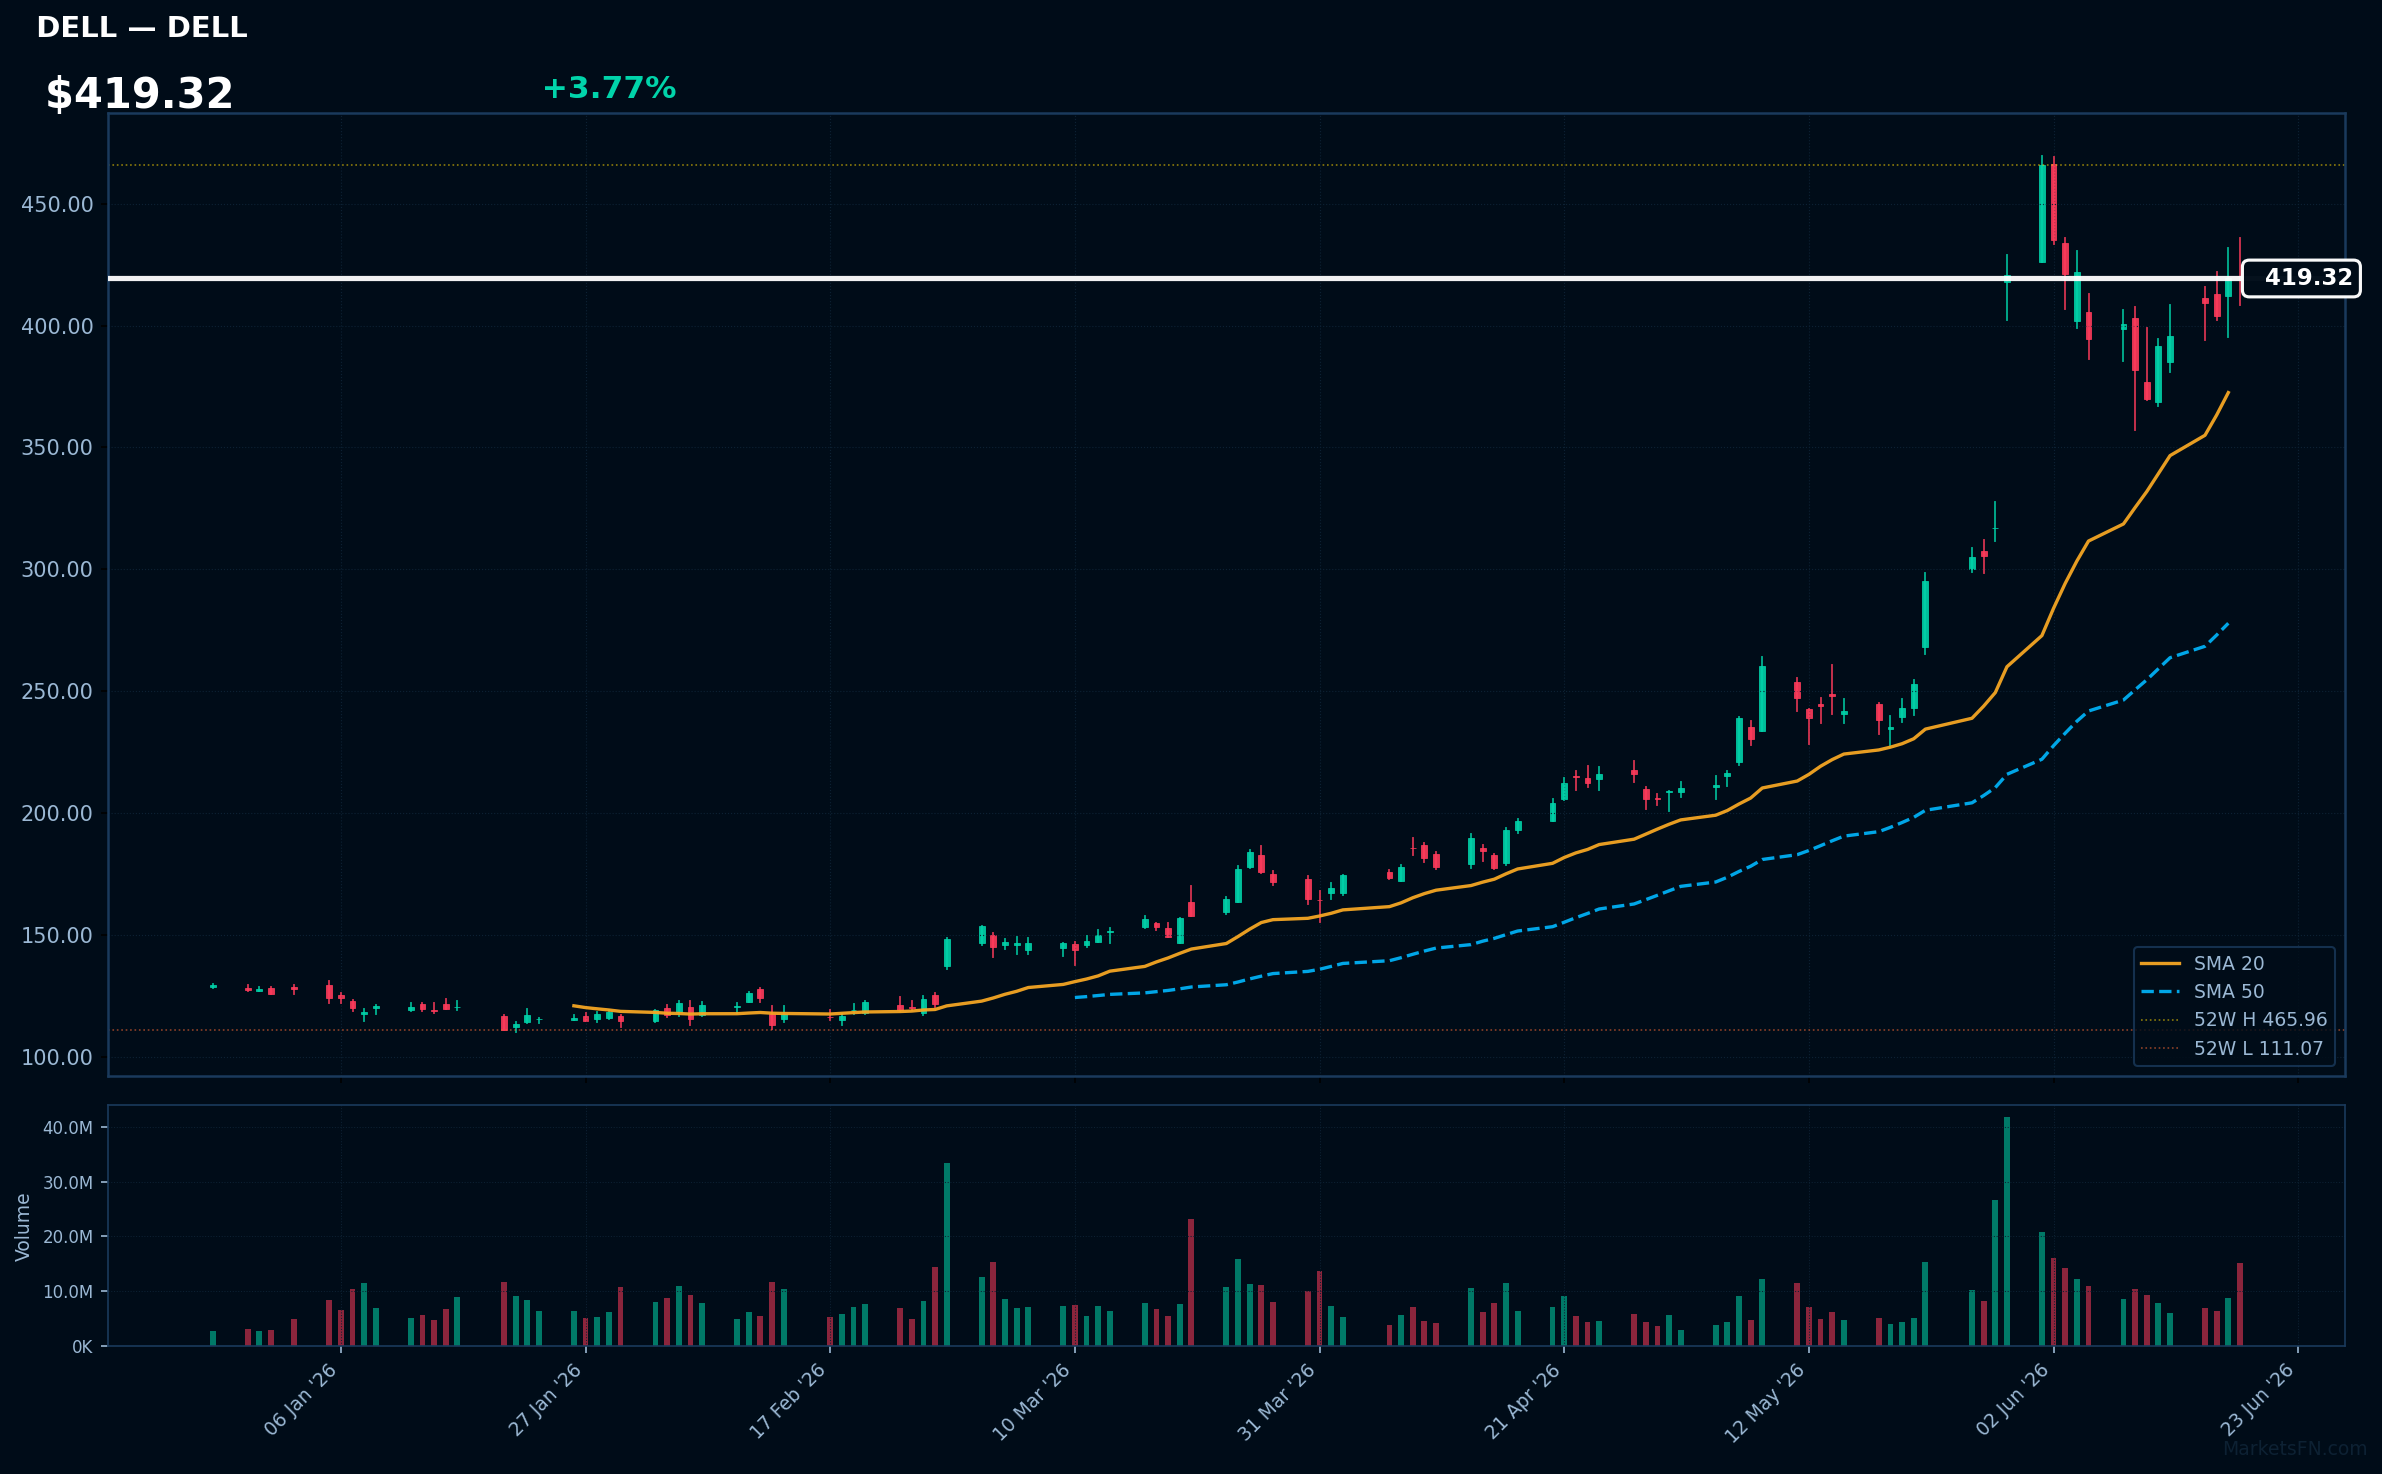
DELL | Dell Technologies Inc | Technology | Price: $419.32 | Day: +3.77% | 1W: +13.38% | 1M: +76.16% | RSI: 67.6 | vs MA200: +143.5% | Trend: Above MA20, MA50, MA200
Recent headlines (last 12h)
- Dell Was a Leader in PCs. Now It Is a Giant in AI Infrastructure, Thanks to Its CEO.
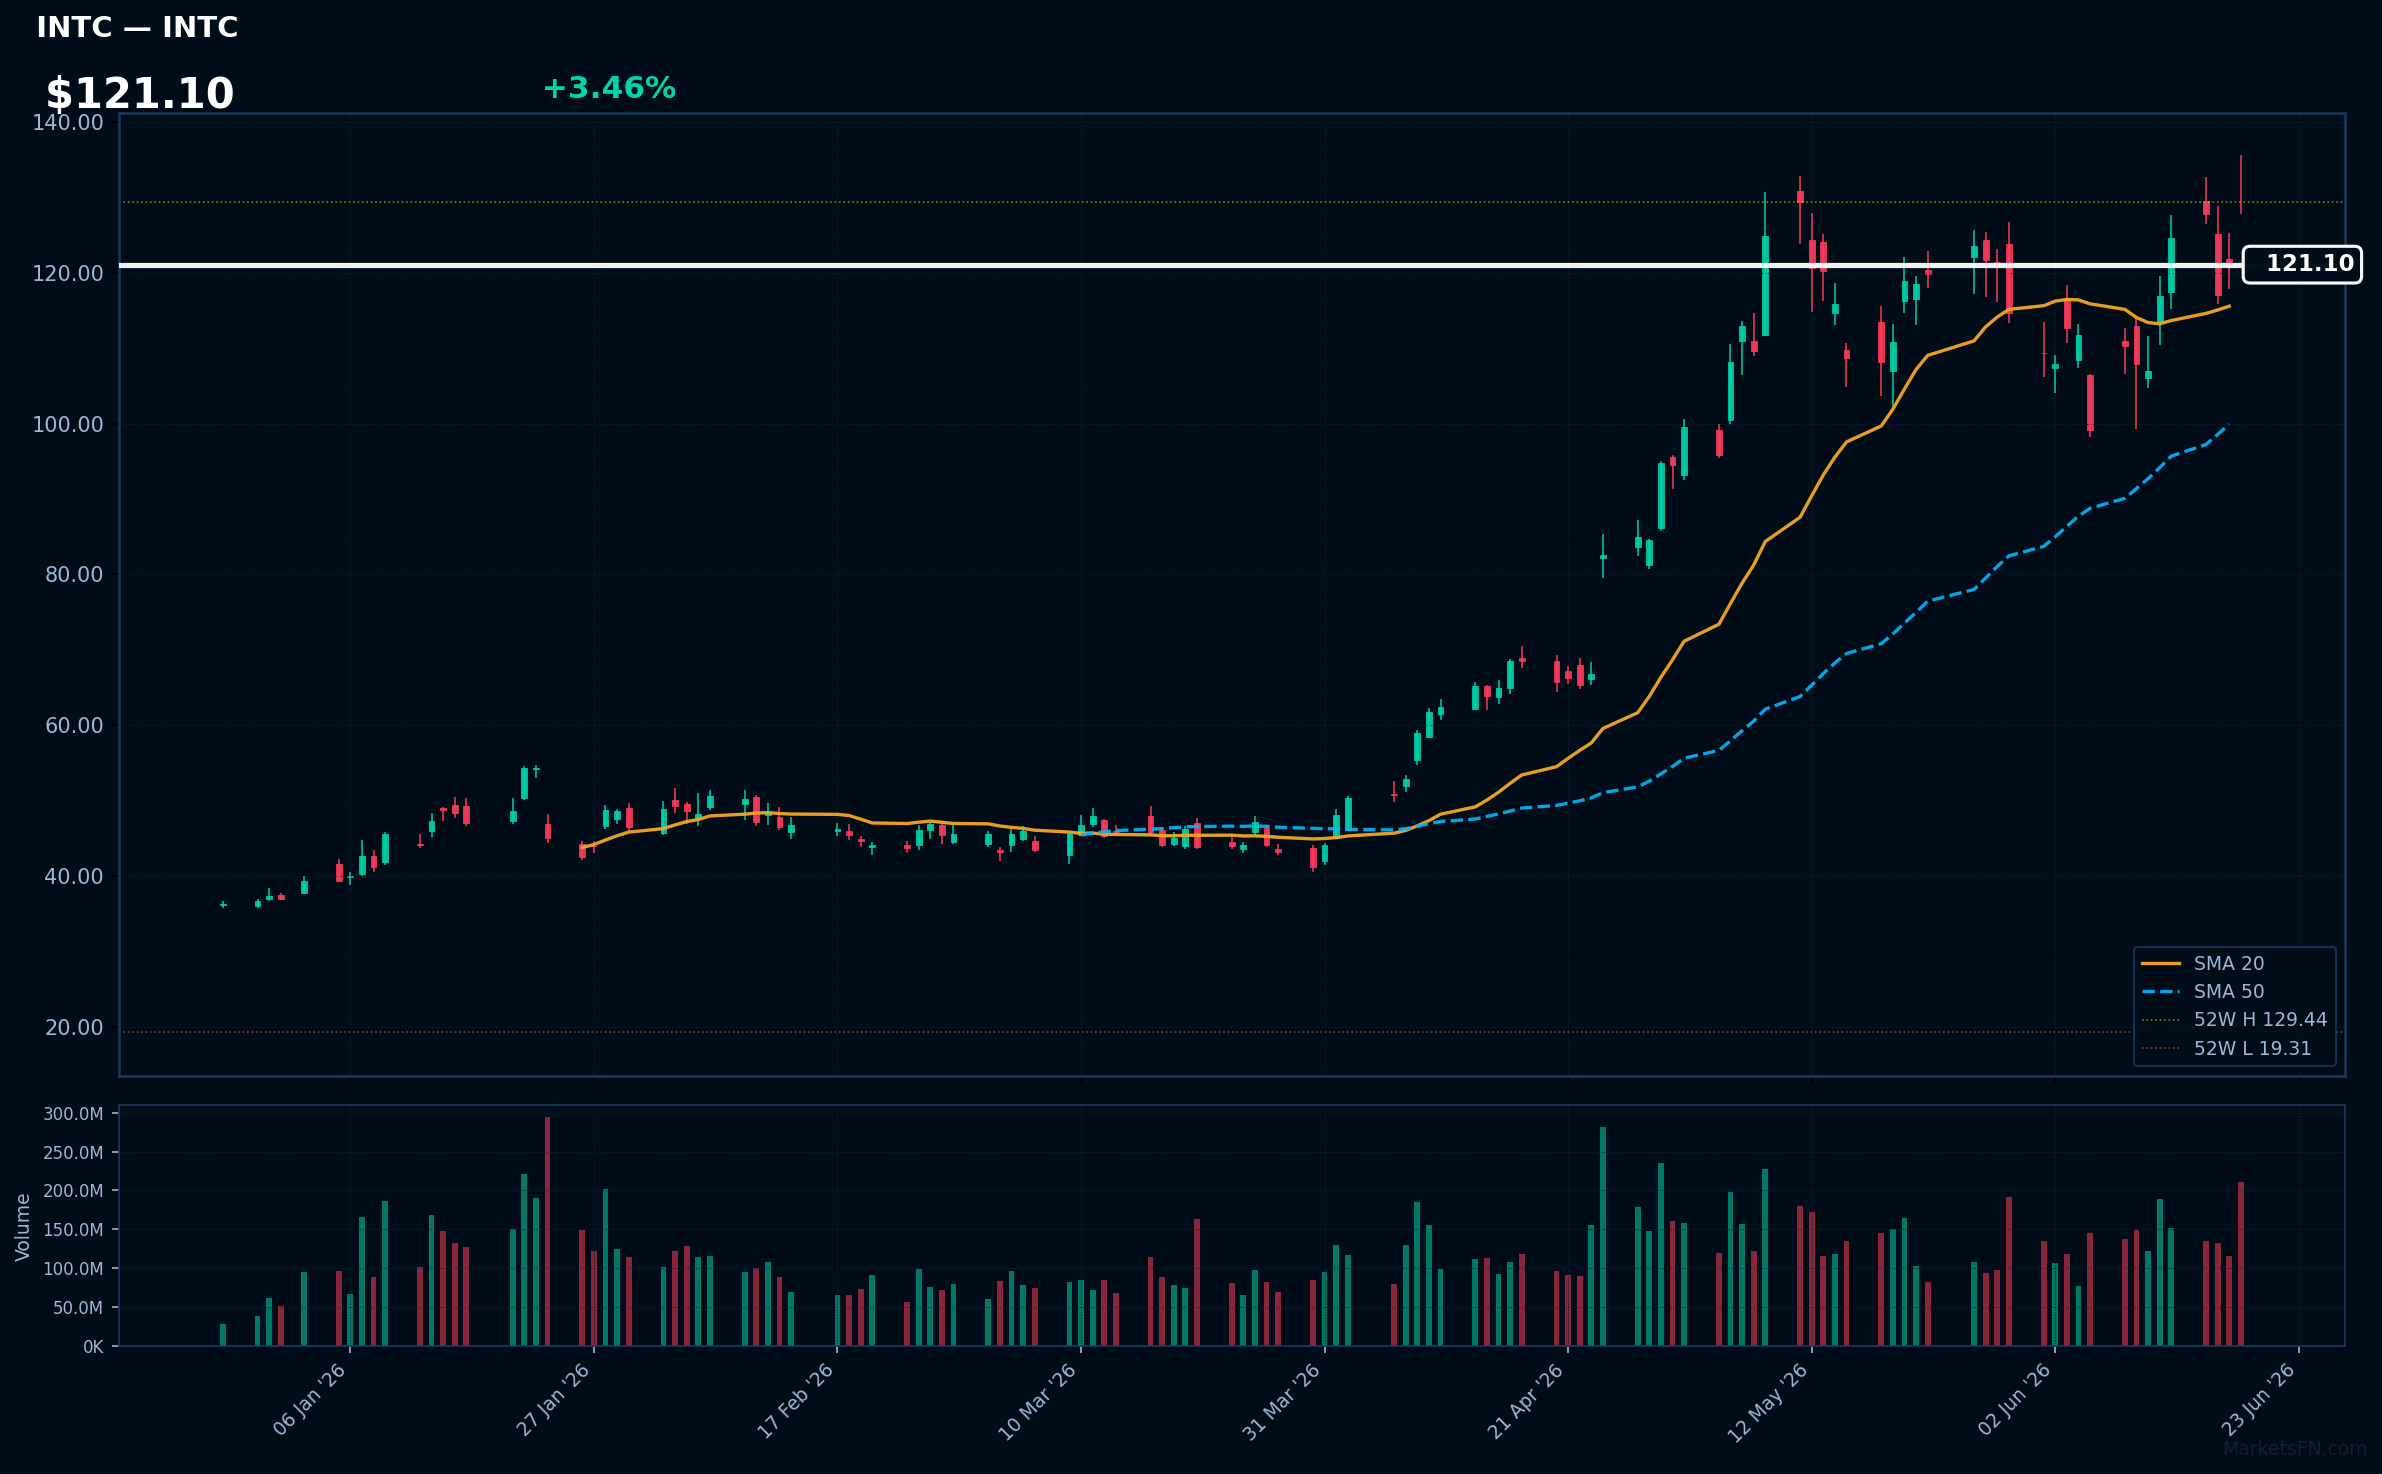
INTC | Intel Corp | Technology | Price: $121.10 | Day: +3.46% | 1W: +13.14% | 1M: +11.95% | RSI: 57.3 | vs MA200: +120.3% | Trend: Above MA20, MA50, MA200
Recent headlines (last 12h)
- Why Intel Hired the Former CEO of Micron's Big Rival SK Hynix
- Trump Handed Intel Stock a 10% Pop, but Markets Are Hedging
- Intel Leads Big Chip Stock Rally
- SpaceX Stock Gains the Size of Intel Since IPO. History Has a Warning.
STX | Seagate Technology Holdings Plc | Technology | Price: $1066.07 | Day: +3.37% | 1W: +30.65% | 1M: +43.90% | RSI: 73.8 | vs MA200: +155.4% | Trend: Above MA20, MA50, MA200
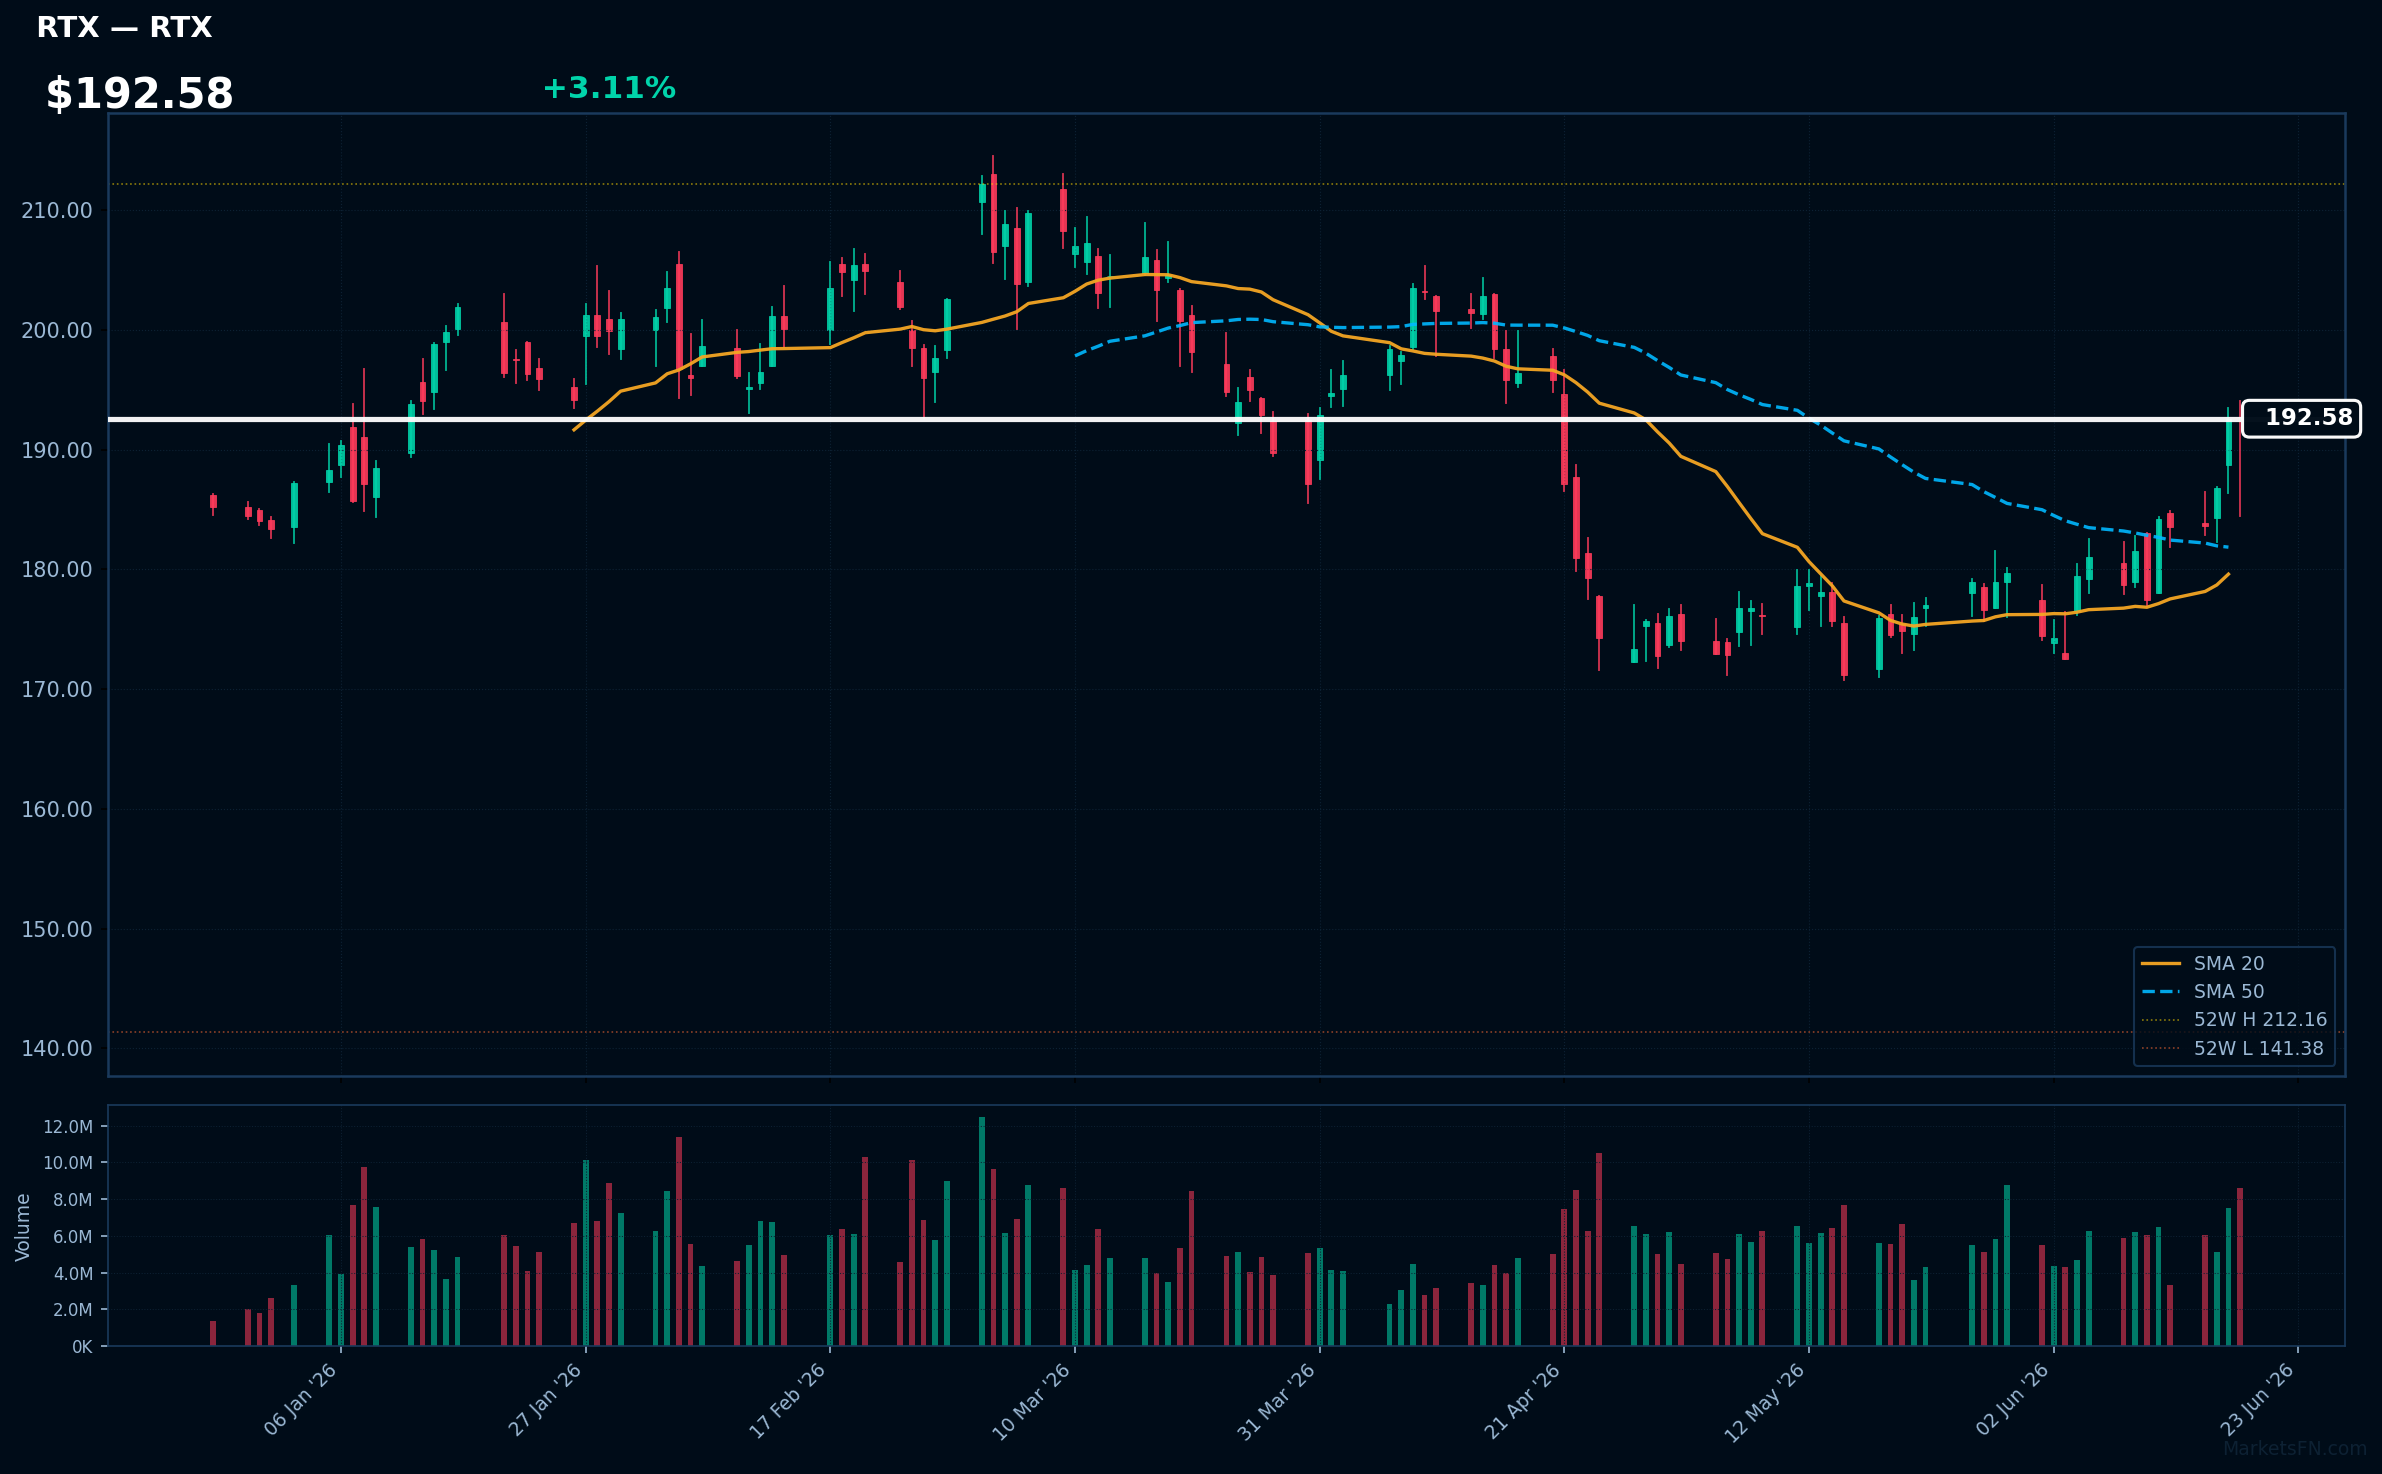
RTX | RTX Corp | Industrials | Price: $192.58 | Day: +3.11% | 1W: +8.55% | 1M: +9.45% | RSI: 66.0 | vs MA200: +5.6% | Trend: Above MA20, MA50, MA200
Top 10 Losers
Today's weakest S&P 500 performers. Sector drag: Technology (4), Industrials (2), Consumer Defensive (1), Financial (1), Communication Services (1), Consumer Cyclical (1).
| Ticker | Company | Sector | Price | Day % | 1W % | 1M % | RSI | vs MA200 | Trend |
|---|---|---|---|---|---|---|---|---|---|
| ODFL | Old Dominion Freight Line, Inc | Industrials | $218.36 | -5.72% | -7.45% | +6.97% | 44.6 | +24.0% | Above MA50, MA200 · Below MA20 |
| ACN | Accenture plc | Technology | $156.01 | -5.75% | -8.50% | -12.13% | 32.1 | -31.2% | Below MA20, MA50, MA200 |
| NOW | ServiceNow Inc | Technology | $95.48 | -5.77% | -9.98% | -7.68% | 41.1 | -30.4% | Below MA20, MA50, MA200 |
| EL | Estee Lauder Cos., Inc | Consumer Defensive | $82.46 | -5.85% | -3.43% | +3.06% | 45.8 | -11.5% | Above MA50 · Below MA20, MA200 |
| EPAM | EPAM Systems Inc | Technology | $87.70 | -6.03% | -5.74% | -12.68% | 31.2 | -43.6% | Below MA20, MA50, MA200 |
| IT | Gartner, Inc | Technology | $133.58 | -6.09% | -13.77% | -14.06% | 30.2 | -33.6% | Below MA20, MA50, MA200 |
| NDAQ | Nasdaq Inc | Financial | $83.29 | -6.72% | -3.96% | -10.05% | 36.3 | -7.2% | Below MA20, MA50, MA200 |
| CHTR | Charter Communications Inc | Communication Services | $132.00 | -6.90% | -4.20% | -6.52% | 35.7 | -37.8% | Below MA20, MA50, MA200 |
| EFX | Equifax, Inc | Industrials | $154.84 | -7.35% | -6.76% | -5.72% | 36.6 | -24.0% | Below MA20, MA50, MA200 |
| KMX | Carmax Inc | Consumer Cyclical | $47.43 | -8.98% | -2.21% | +28.02% | 56.3 | +9.0% | Above MA20, MA50, MA200 |
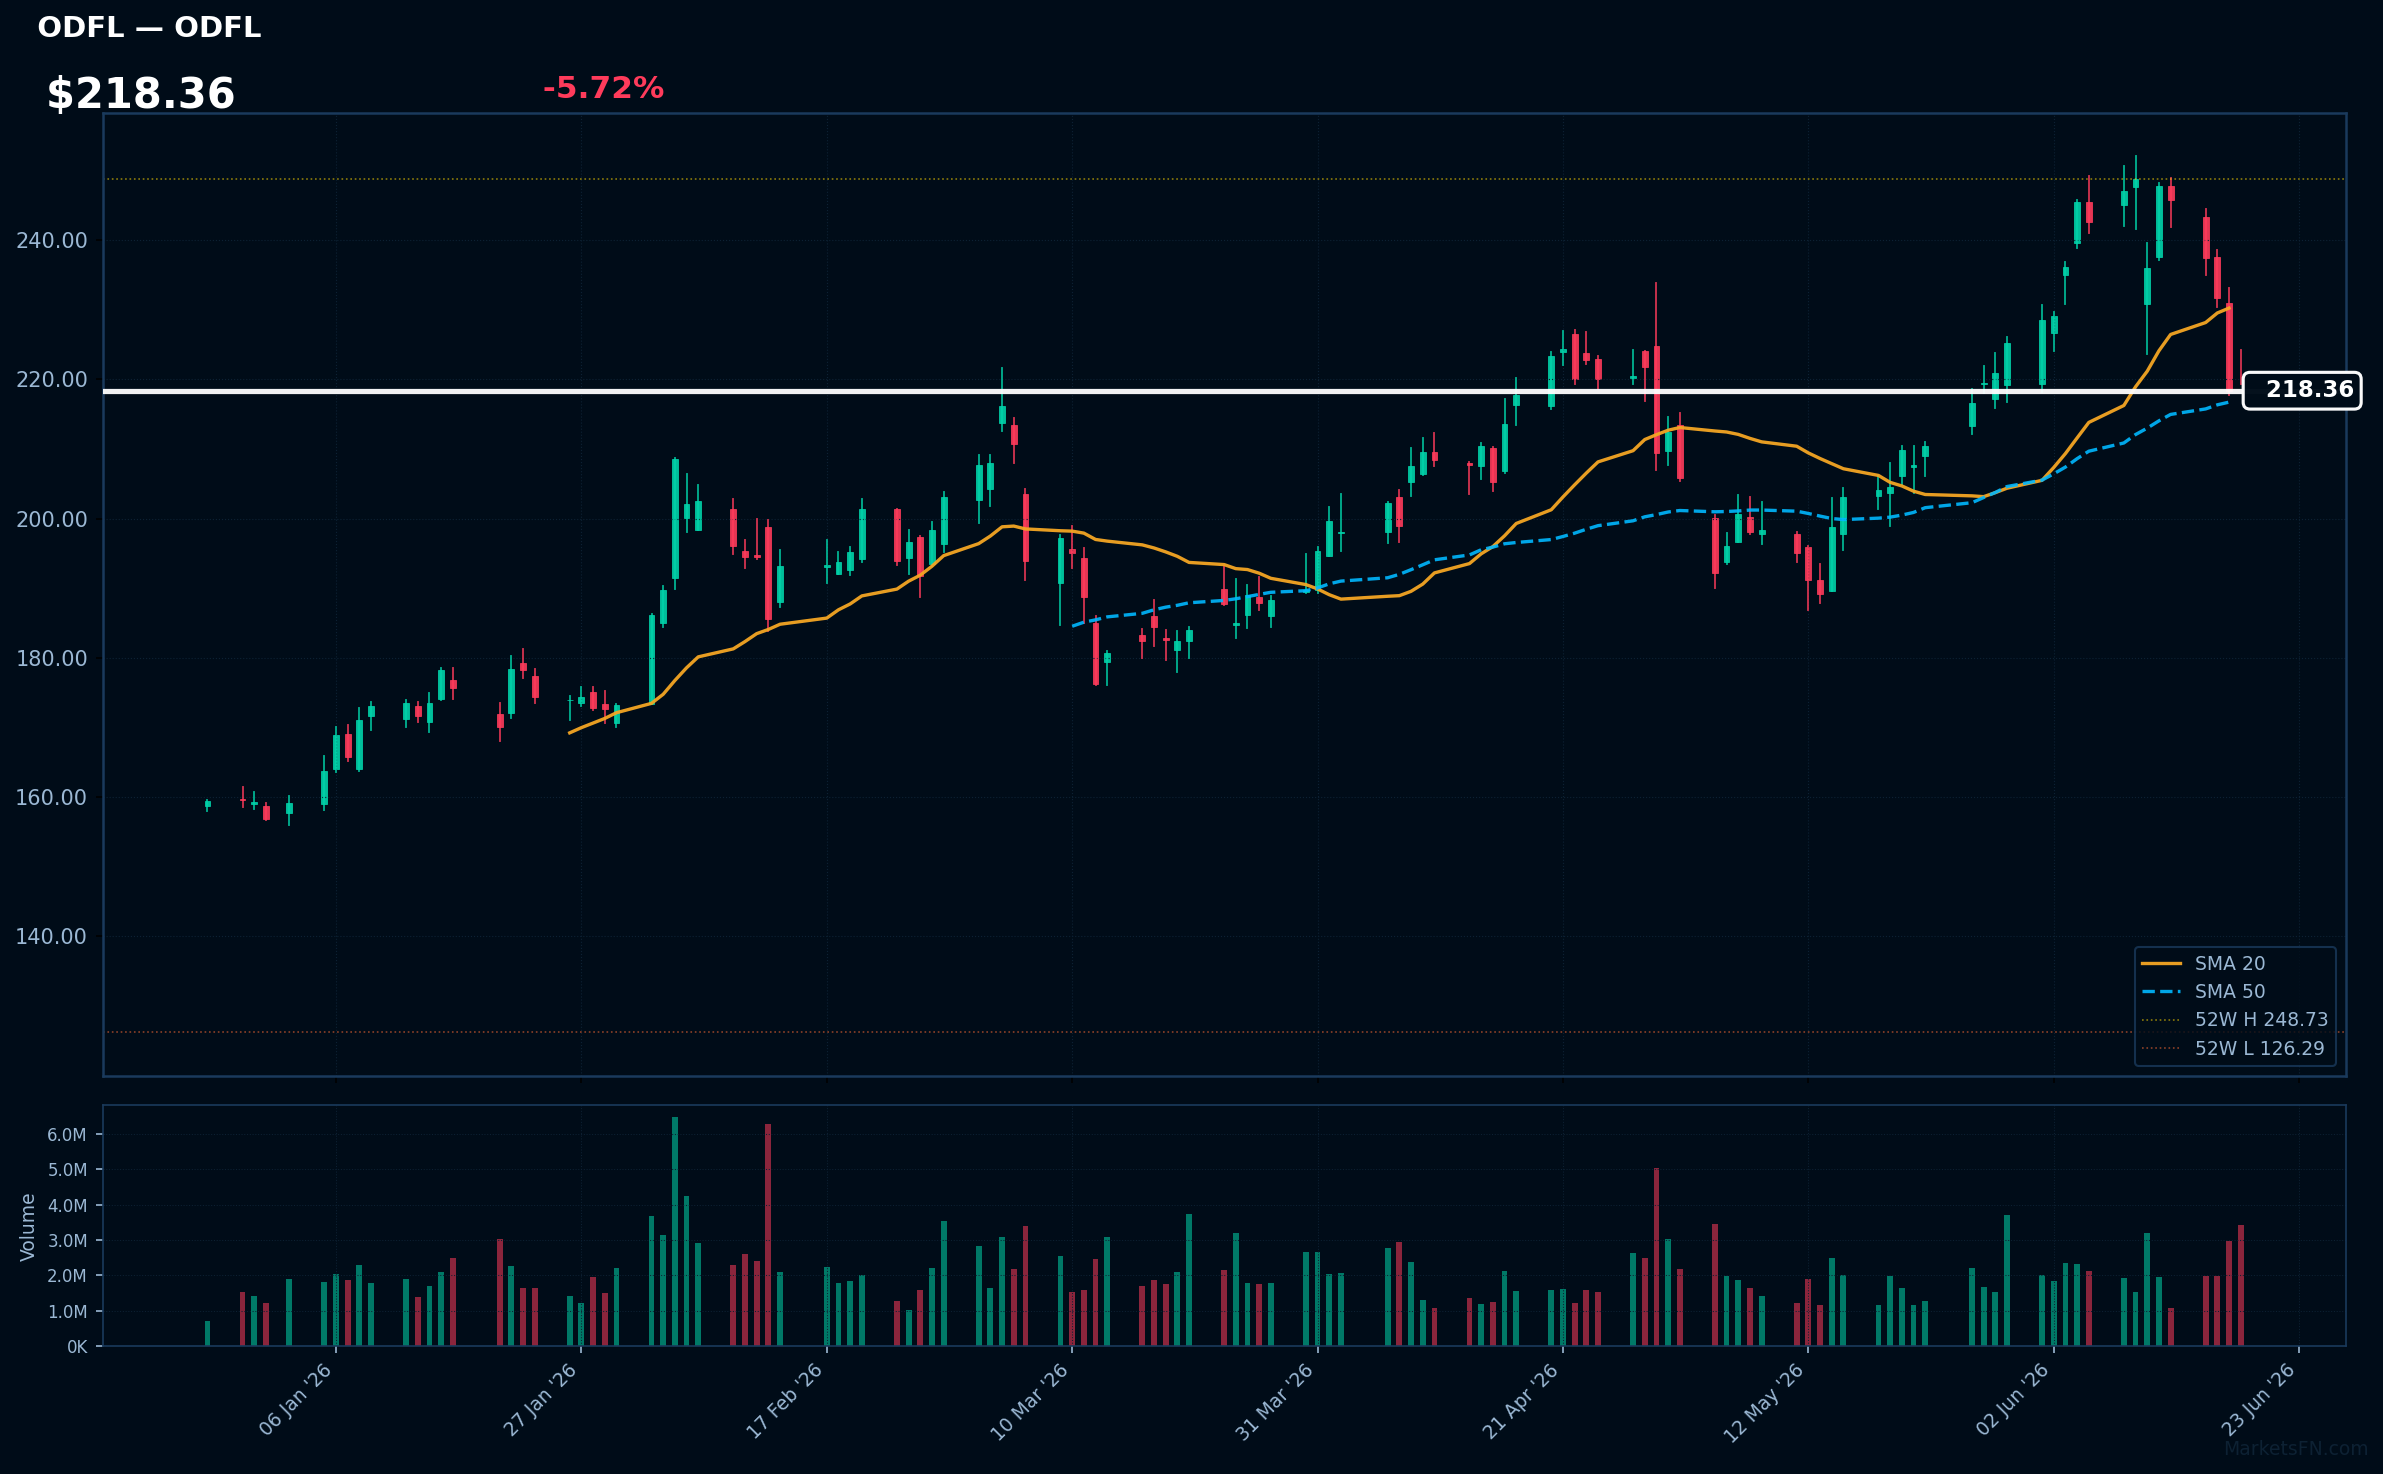
ODFL | Old Dominion Freight Line, Inc | Industrials | Price: $218.36 | Day: -5.72% | 1W: -7.45% | 1M: +6.97% | RSI: 44.6 | vs MA200: +24.0% | Trend: Above MA50, MA200 · Below MA20
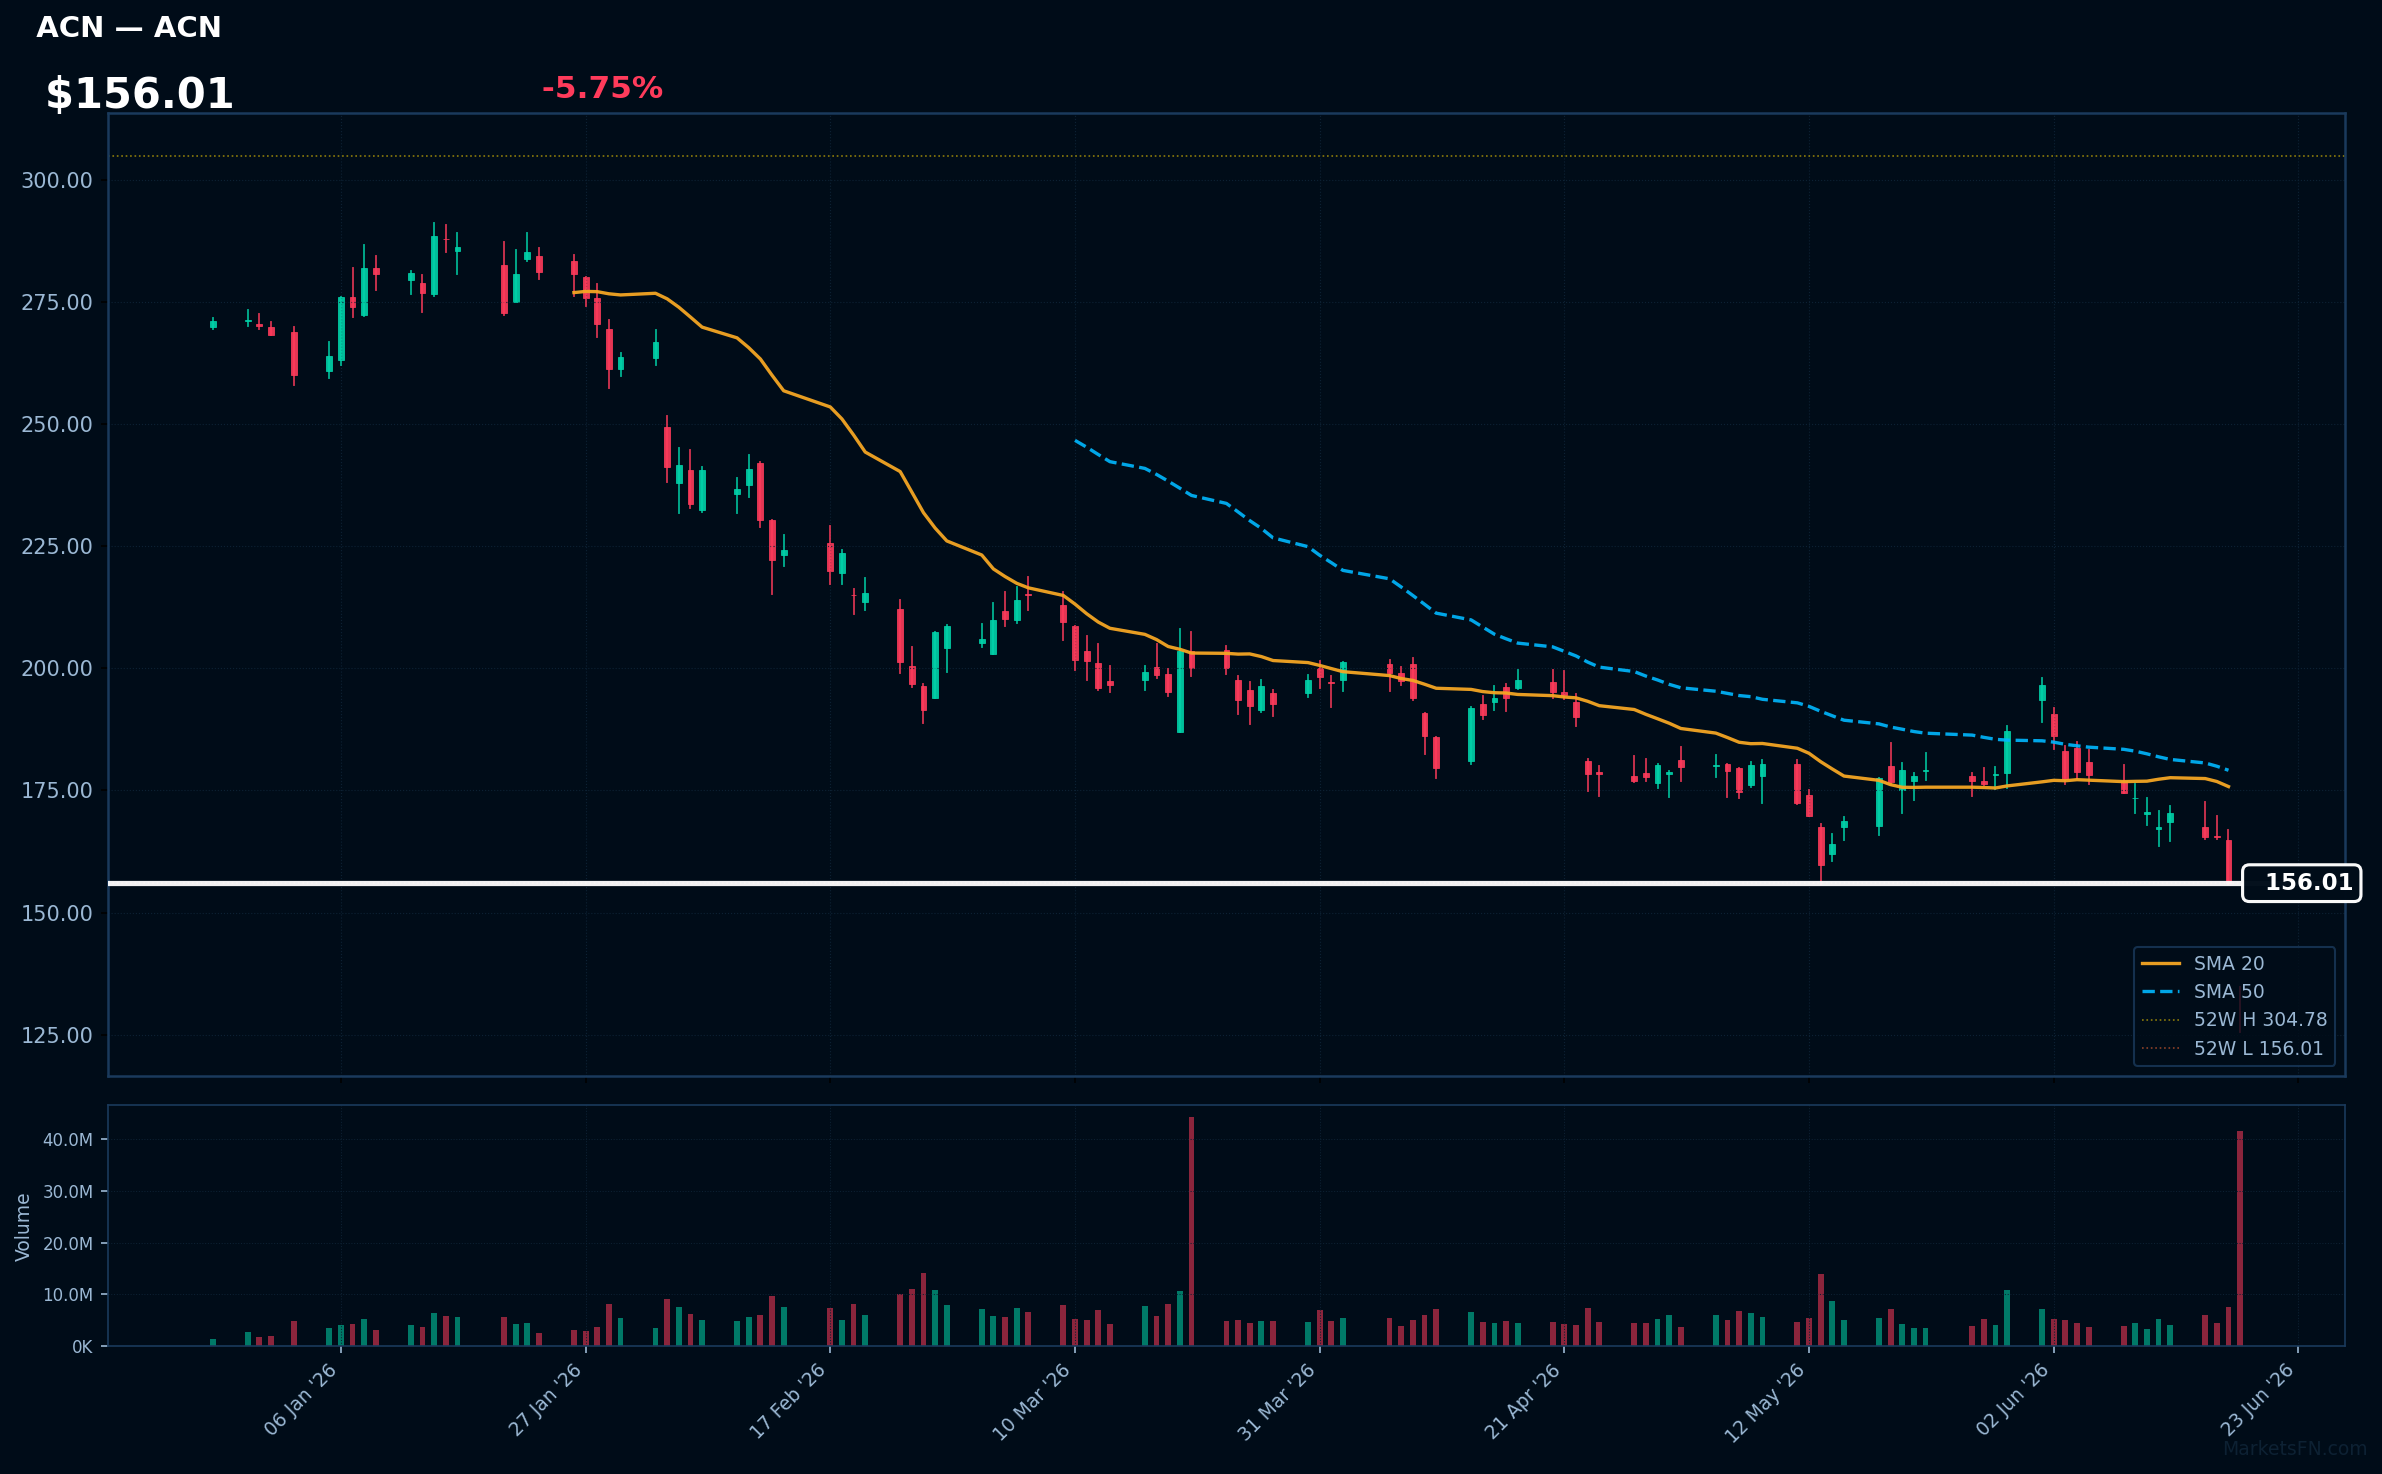
ACN | Accenture plc | Technology | Price: $156.01 | Day: -5.75% | 1W: -8.50% | 1M: -12.13% | RSI: 32.1 | vs MA200: -31.2% | Trend: Below MA20, MA50, MA200
Recent headlines (last 12h)
- Accenture to acquire Dragos, runZero and NetRise for $4.2bn
- India's Nifty IT index at three-year low as bellwether Accenture flags weak outlook
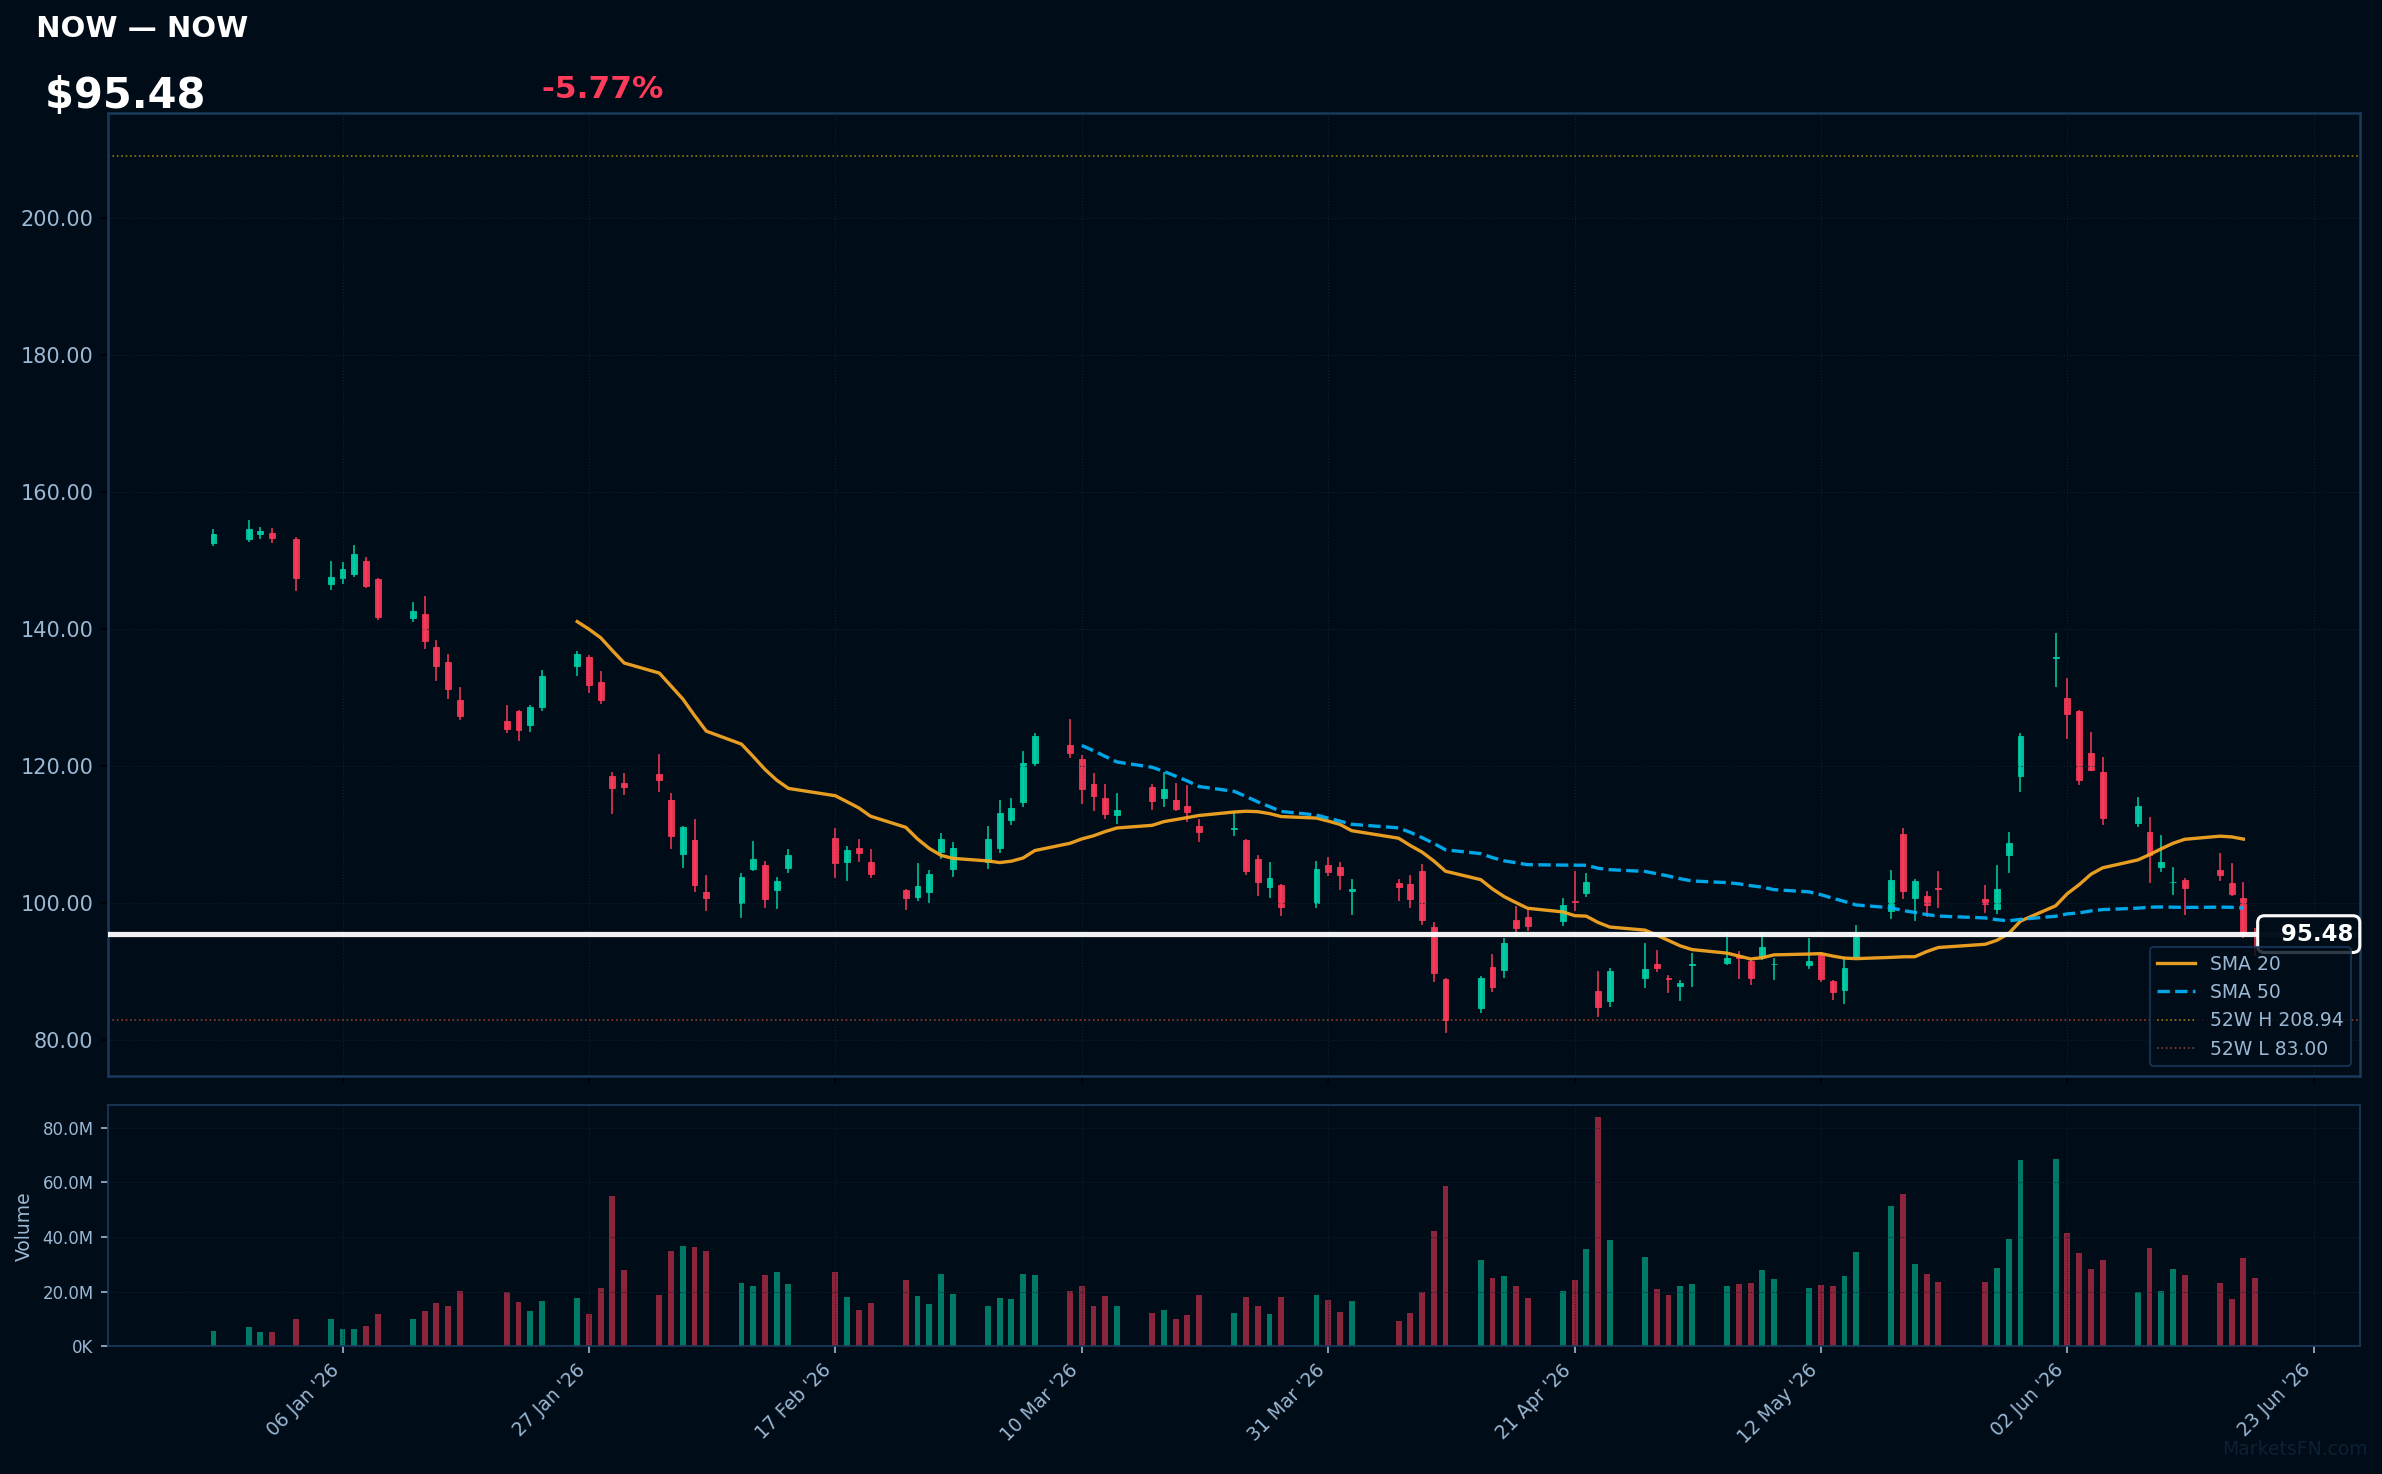
NOW | ServiceNow Inc | Technology | Price: $95.48 | Day: -5.77% | 1W: -9.98% | 1M: -7.68% | RSI: 41.1 | vs MA200: -30.4% | Trend: Below MA20, MA50, MA200
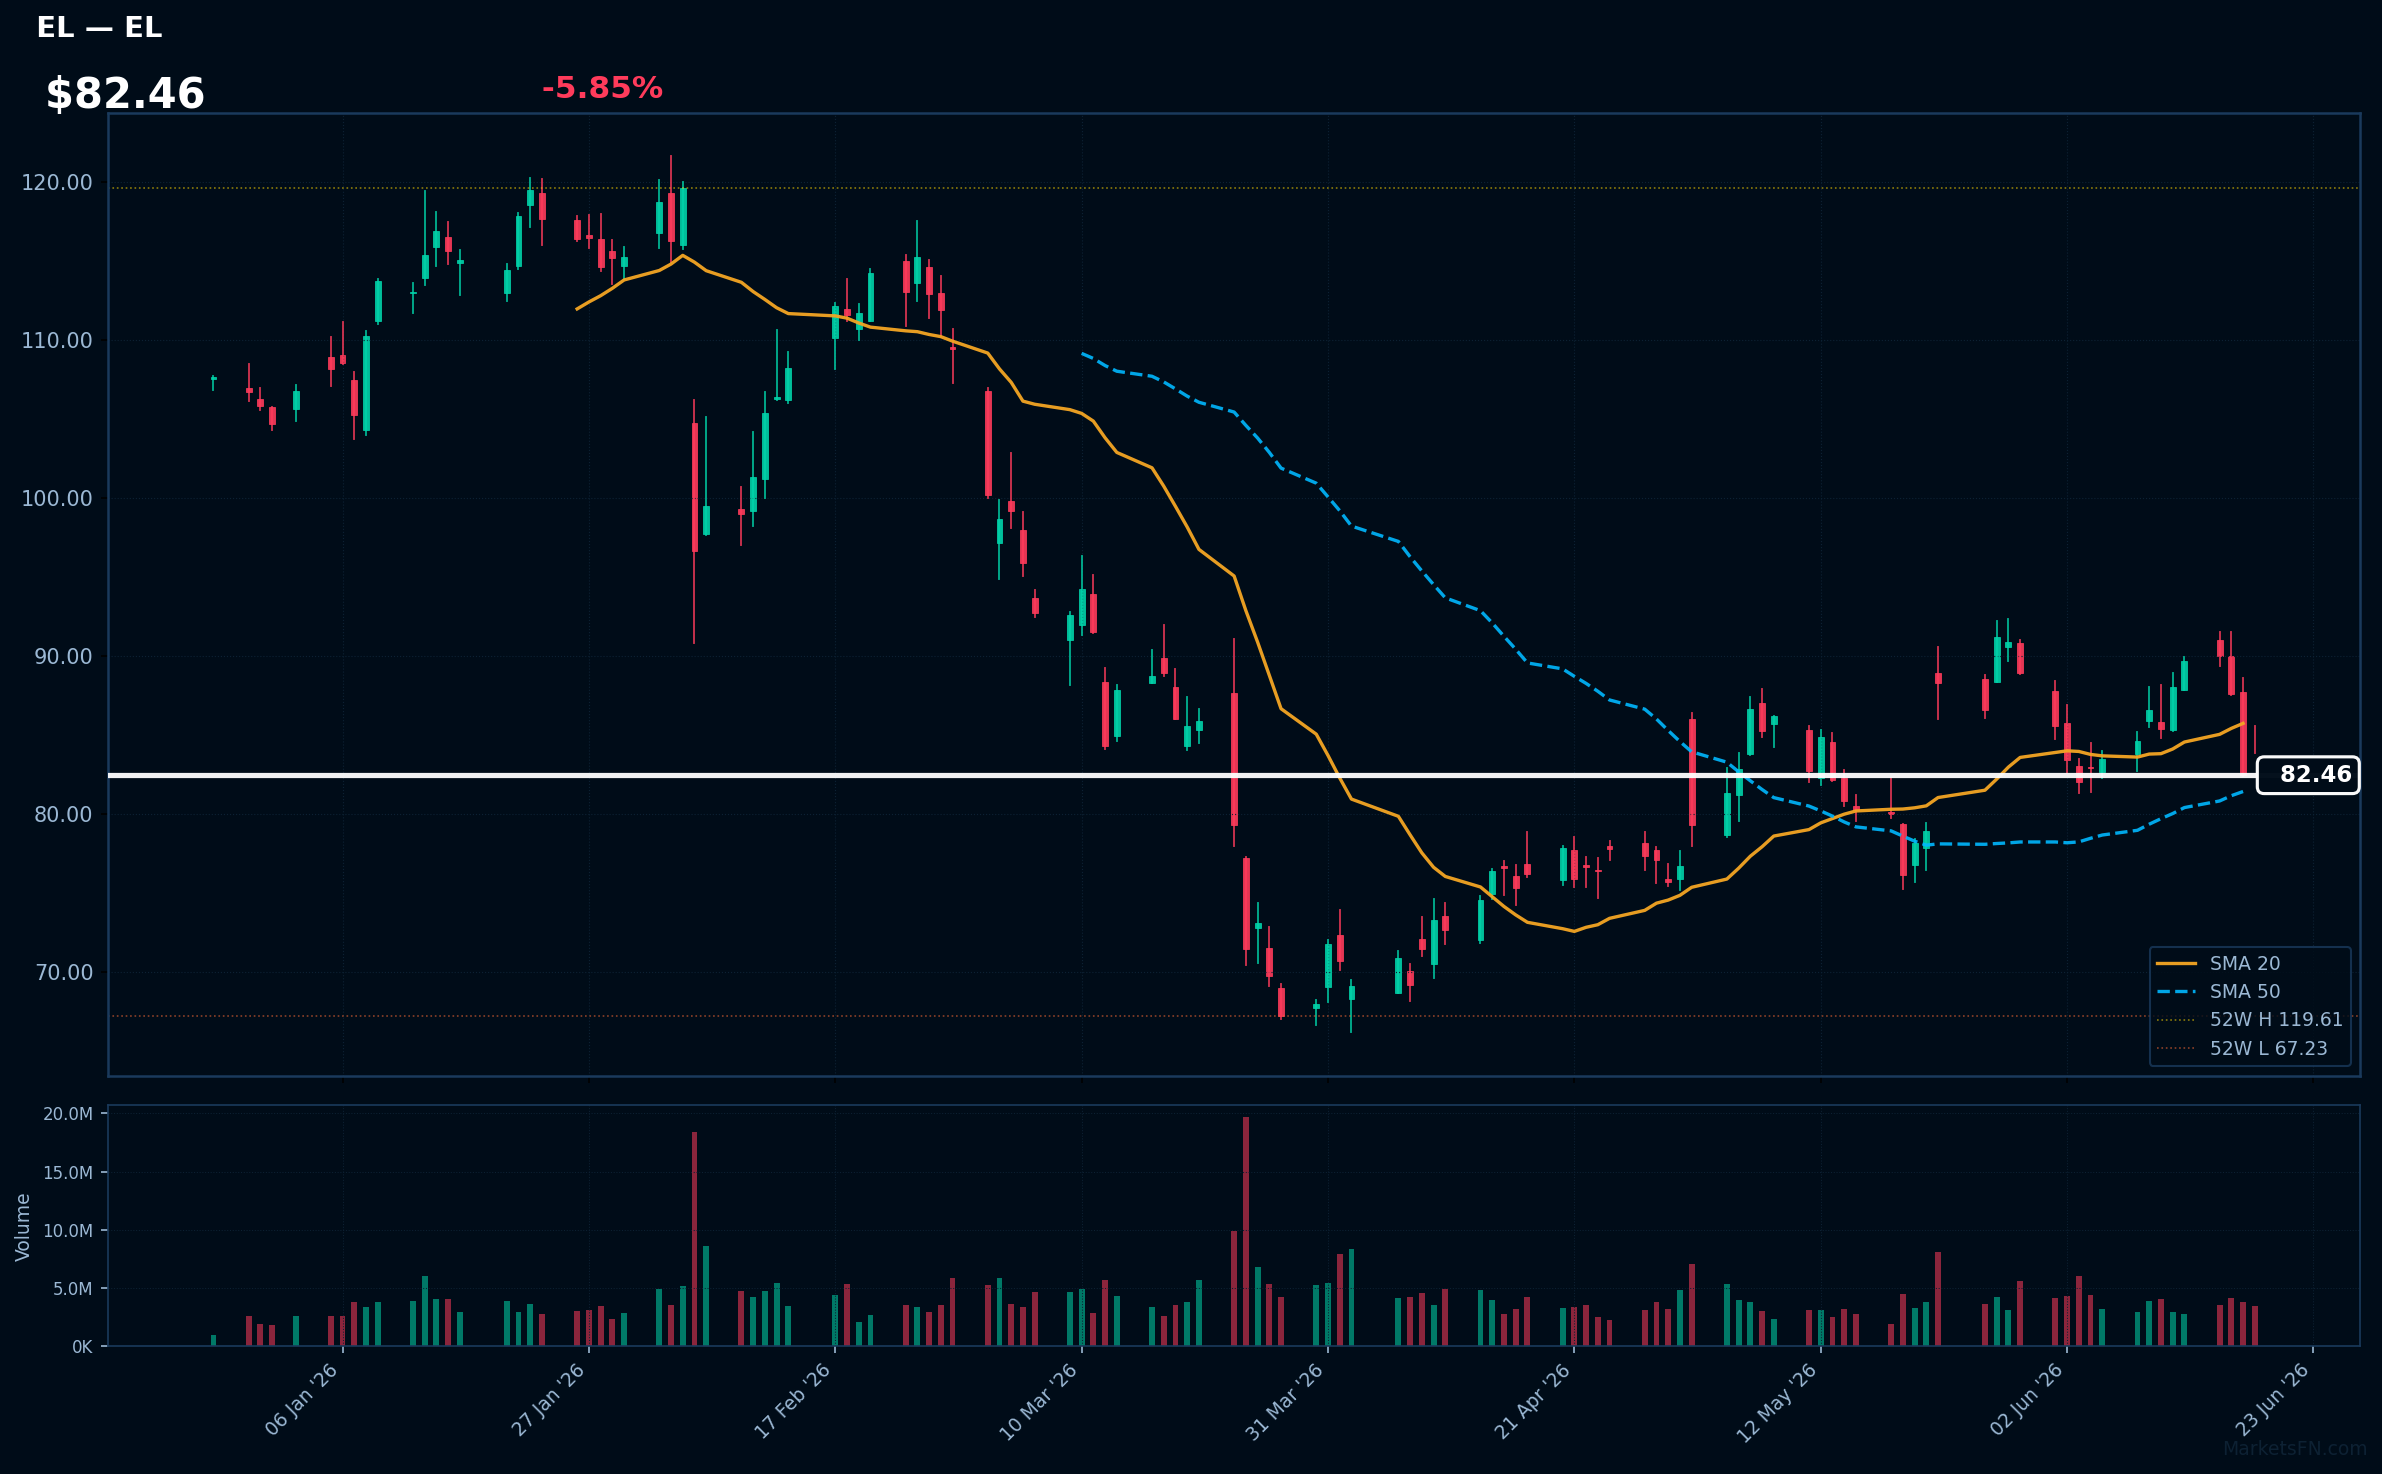
EL | Estee Lauder Cos., Inc | Consumer Defensive | Price: $82.46 | Day: -5.85% | 1W: -3.43% | 1M: +3.06% | RSI: 45.8 | vs MA200: -11.5% | Trend: Above MA50 · Below MA20, MA200
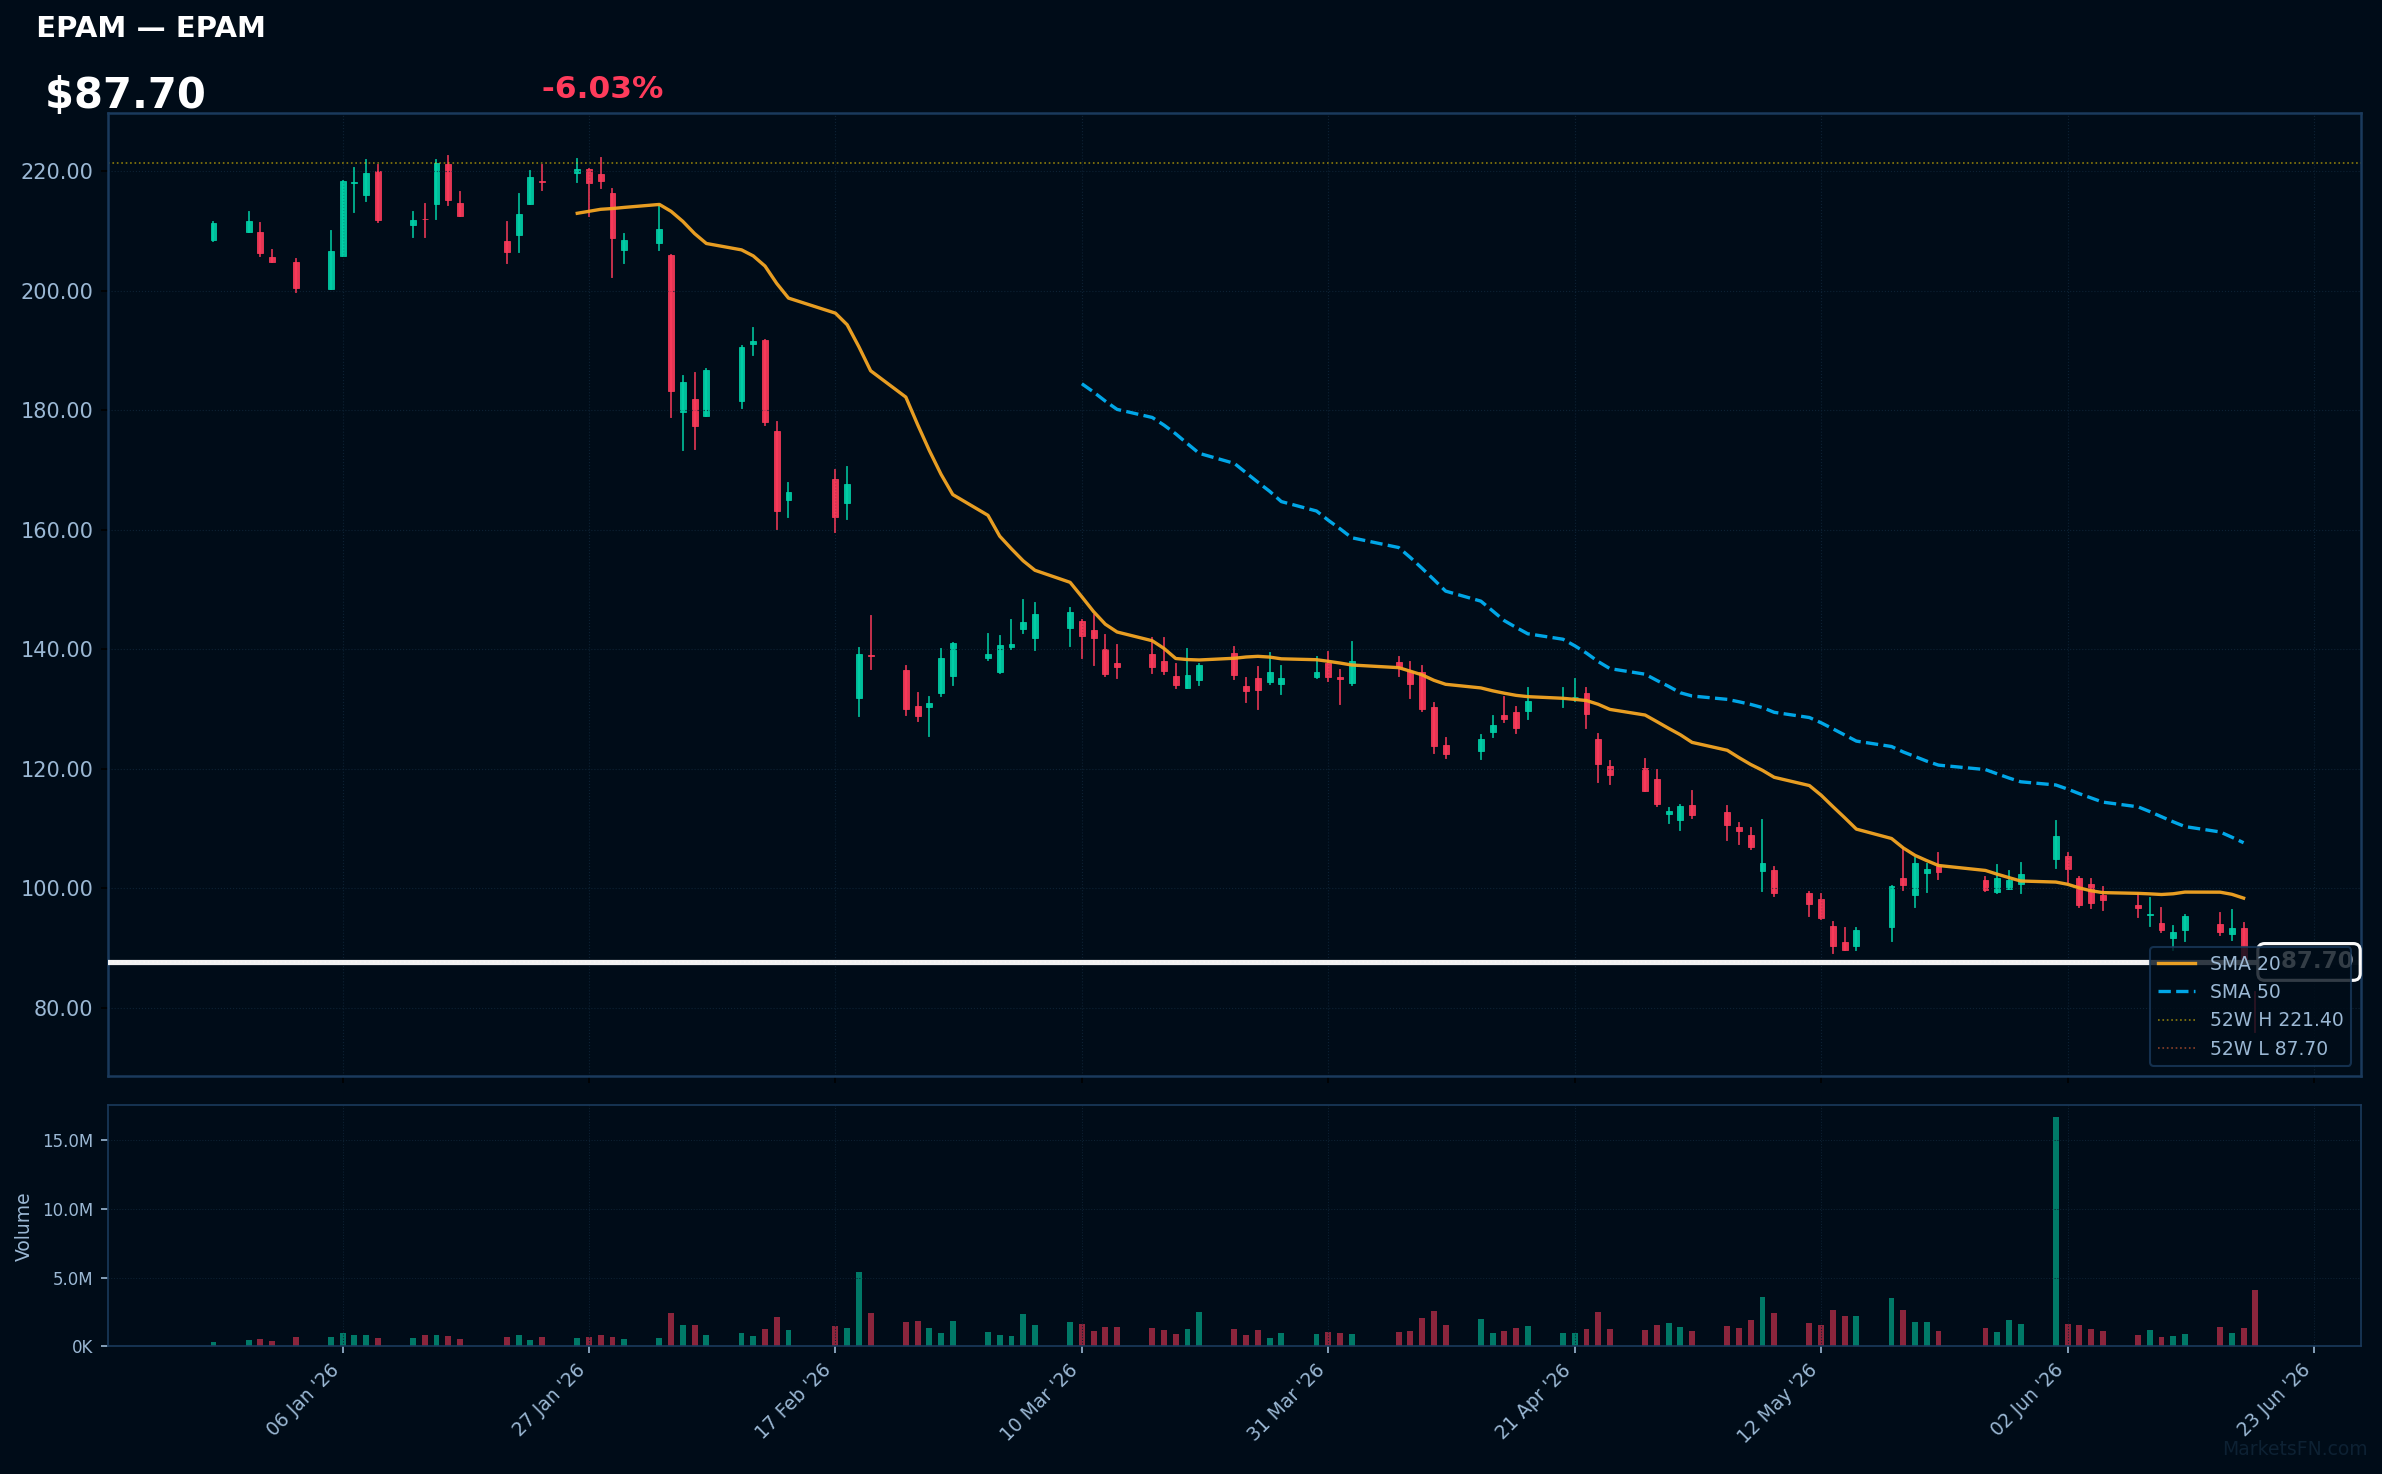
EPAM | EPAM Systems Inc | Technology | Price: $87.70 | Day: -6.03% | 1W: -5.74% | 1M: -12.68% | RSI: 31.2 | vs MA200: -43.6% | Trend: Below MA20, MA50, MA200
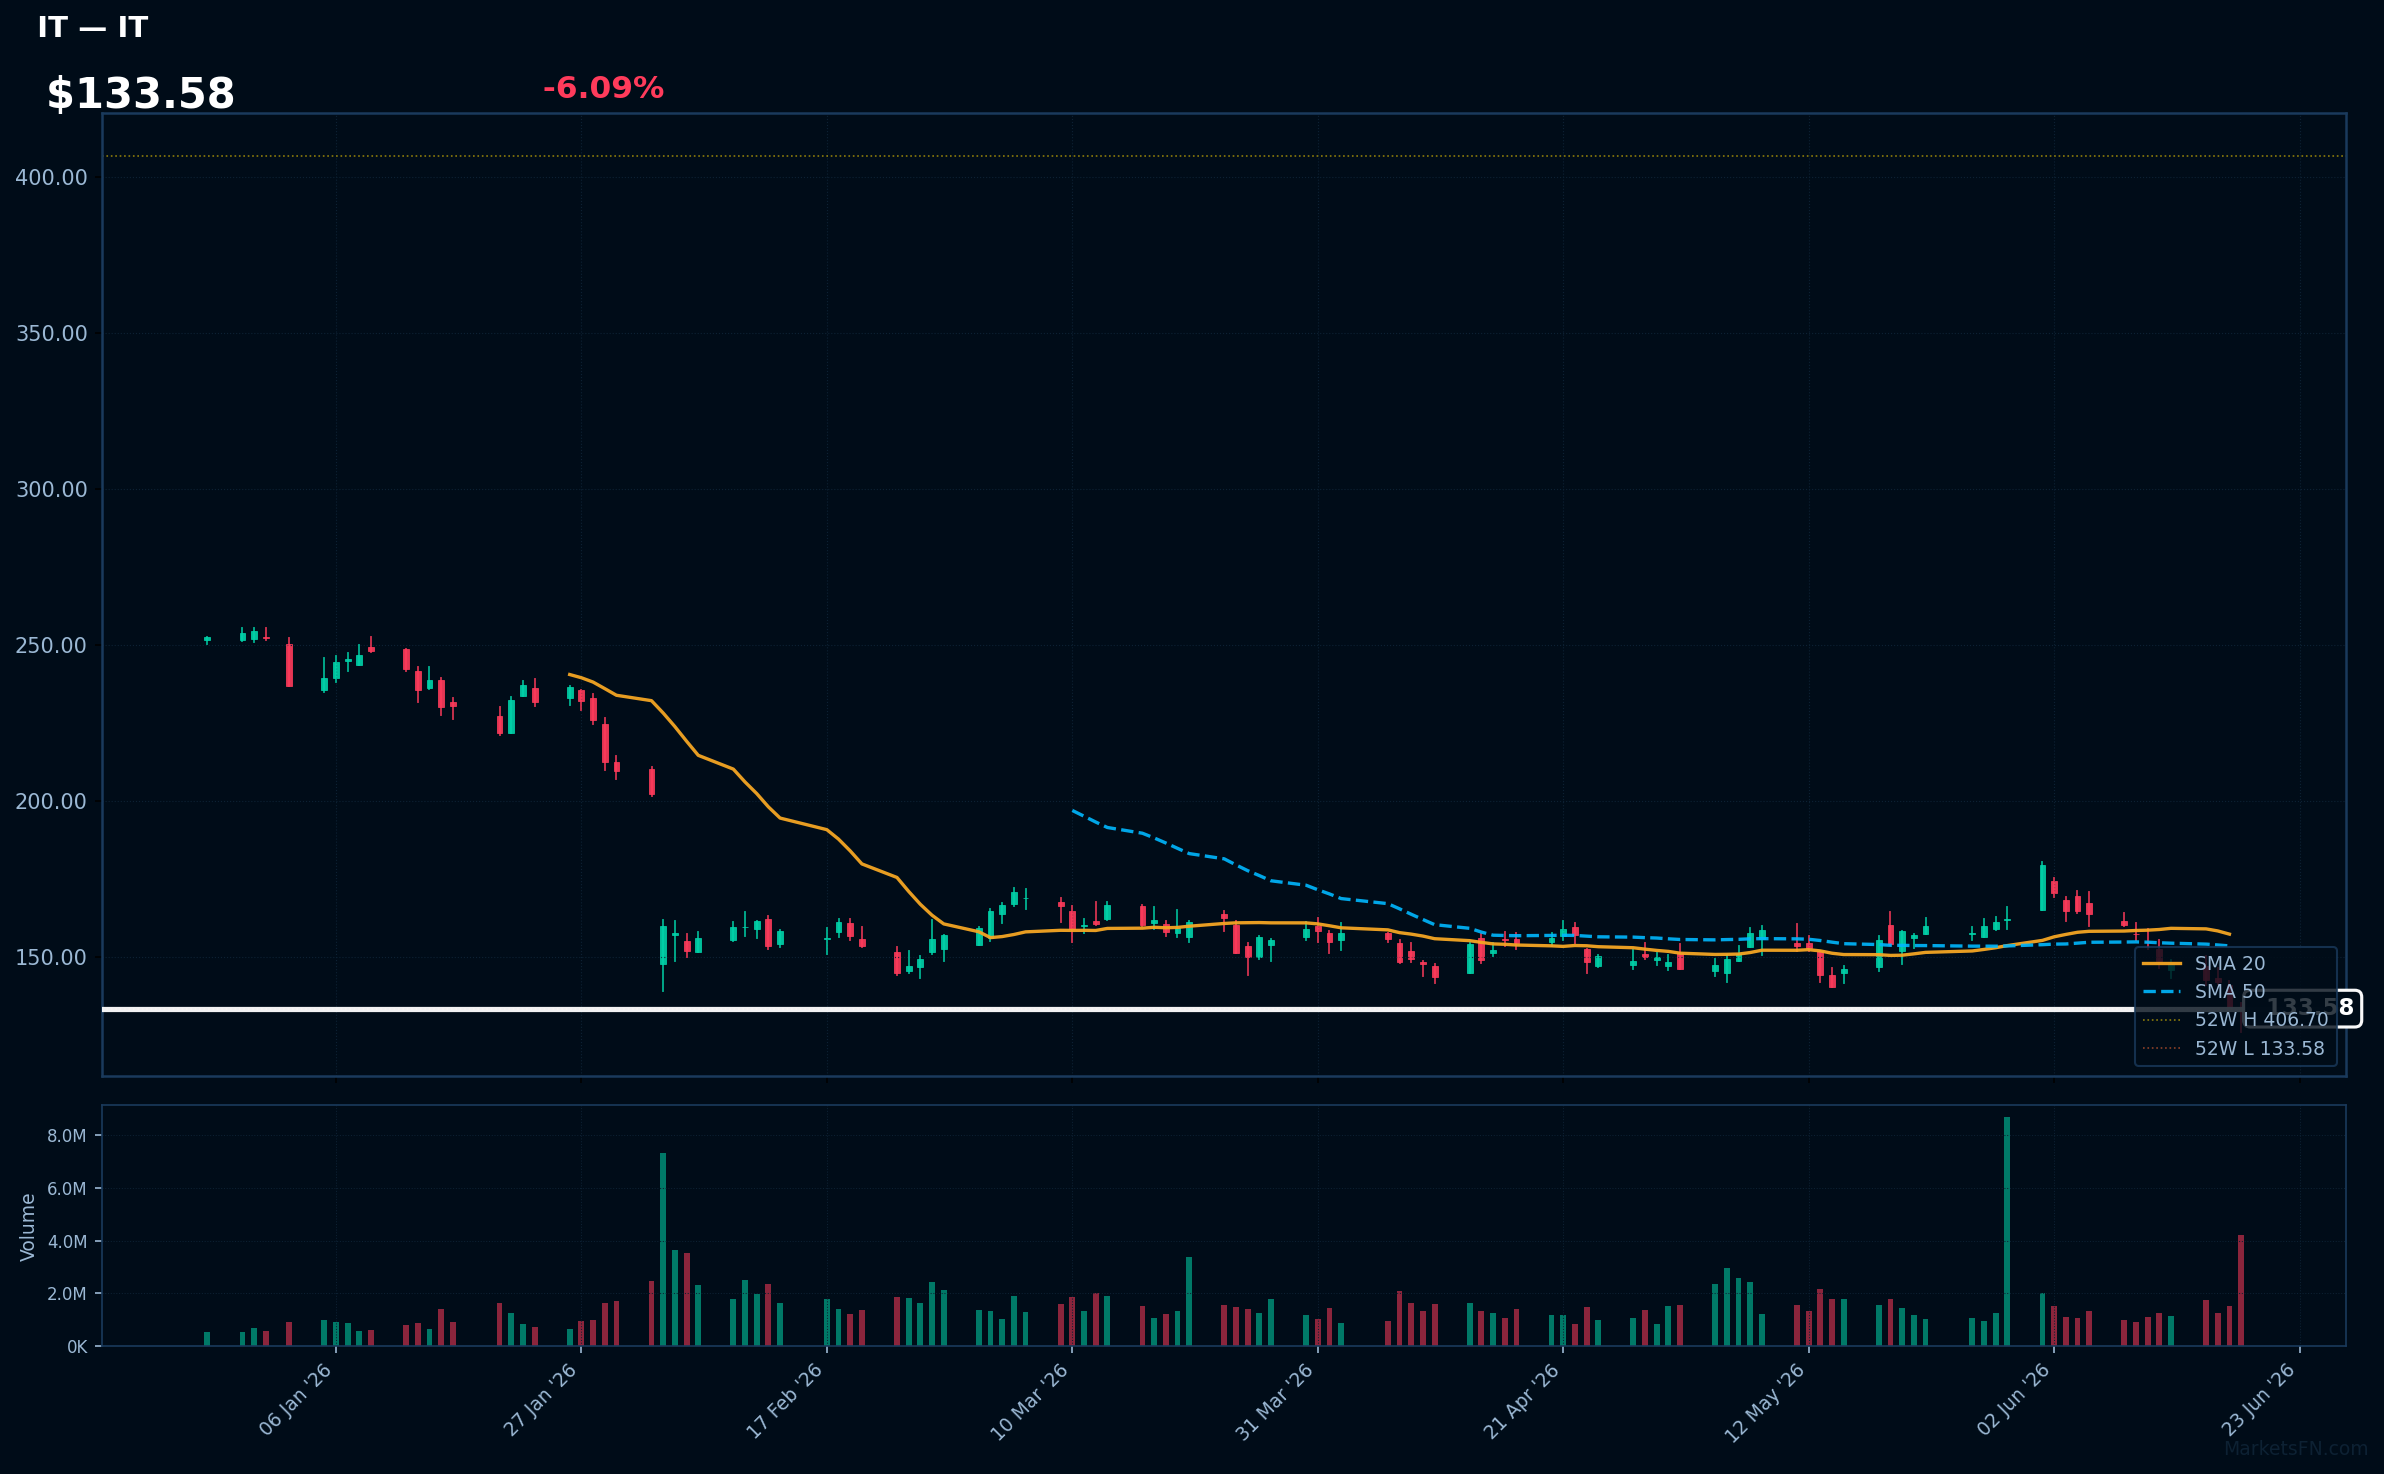
IT | Gartner, Inc | Technology | Price: $133.58 | Day: -6.09% | 1W: -13.77% | 1M: -14.06% | RSI: 30.2 | vs MA200: -33.6% | Trend: Below MA20, MA50, MA200
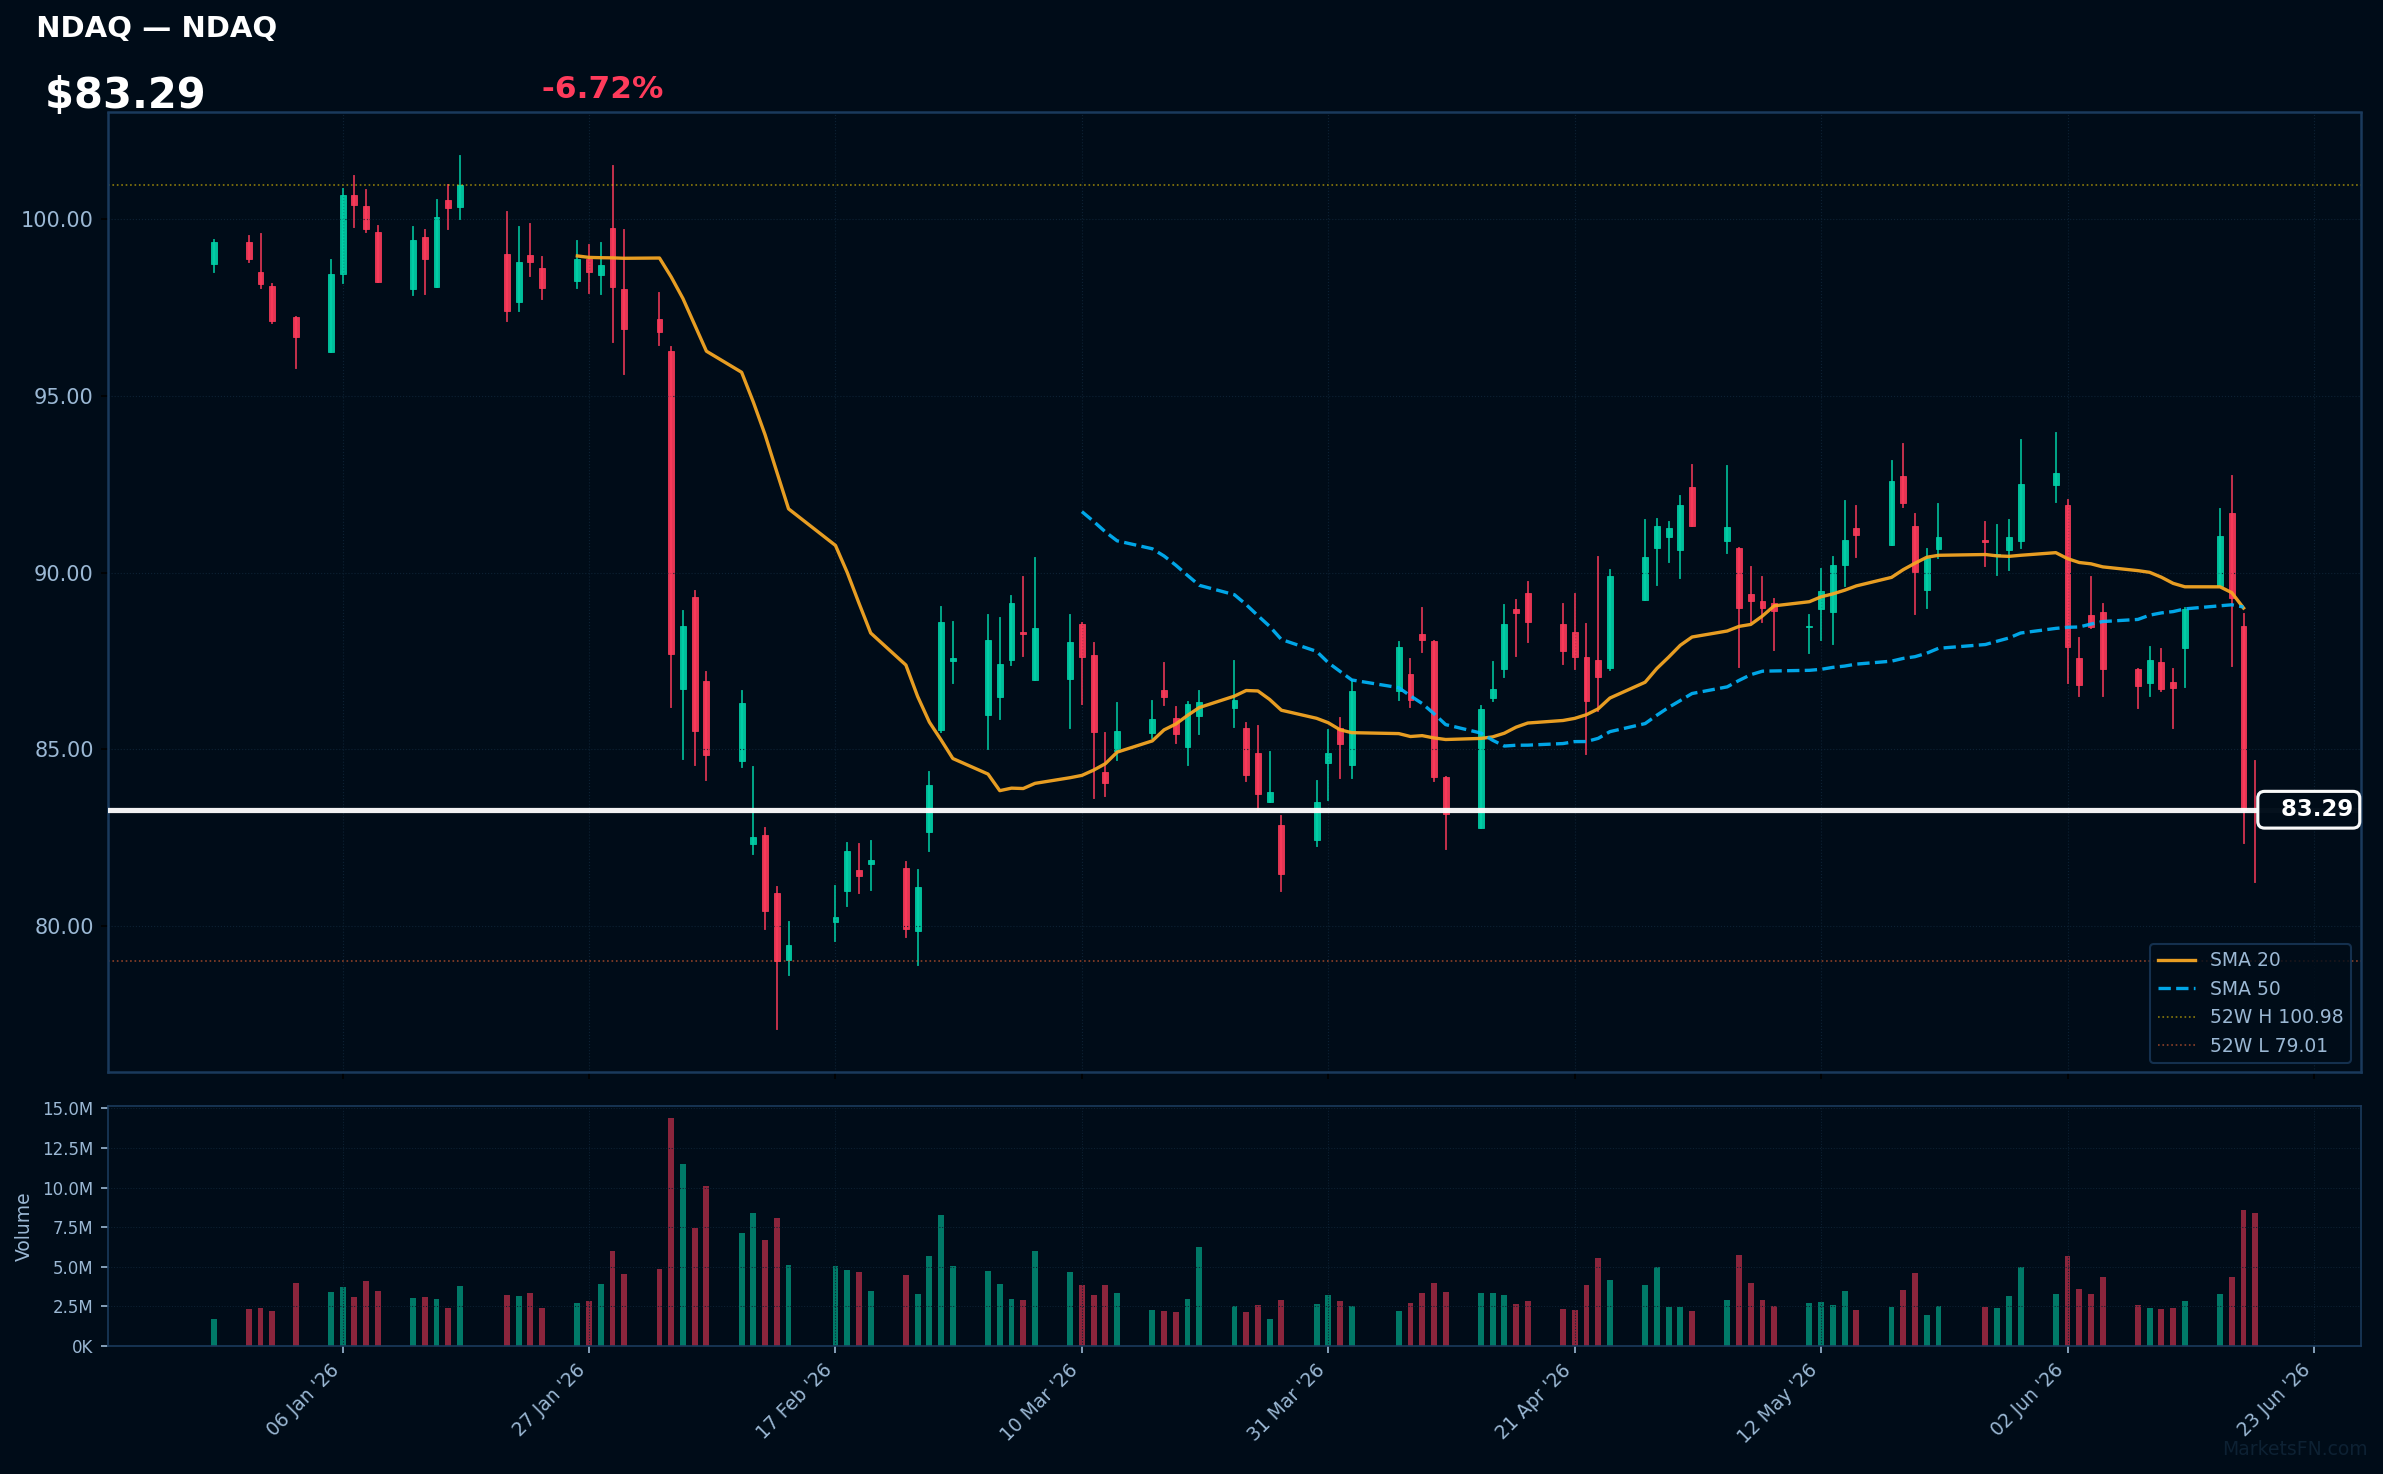
NDAQ | Nasdaq Inc | Financial | Price: $83.29 | Day: -6.72% | 1W: -3.96% | 1M: -10.05% | RSI: 36.3 | vs MA200: -7.2% | Trend: Below MA20, MA50, MA200
Recent headlines (last 12h)
- Is the Stock Market Open Today? Here Are the Trading Hours for Juneteenth.
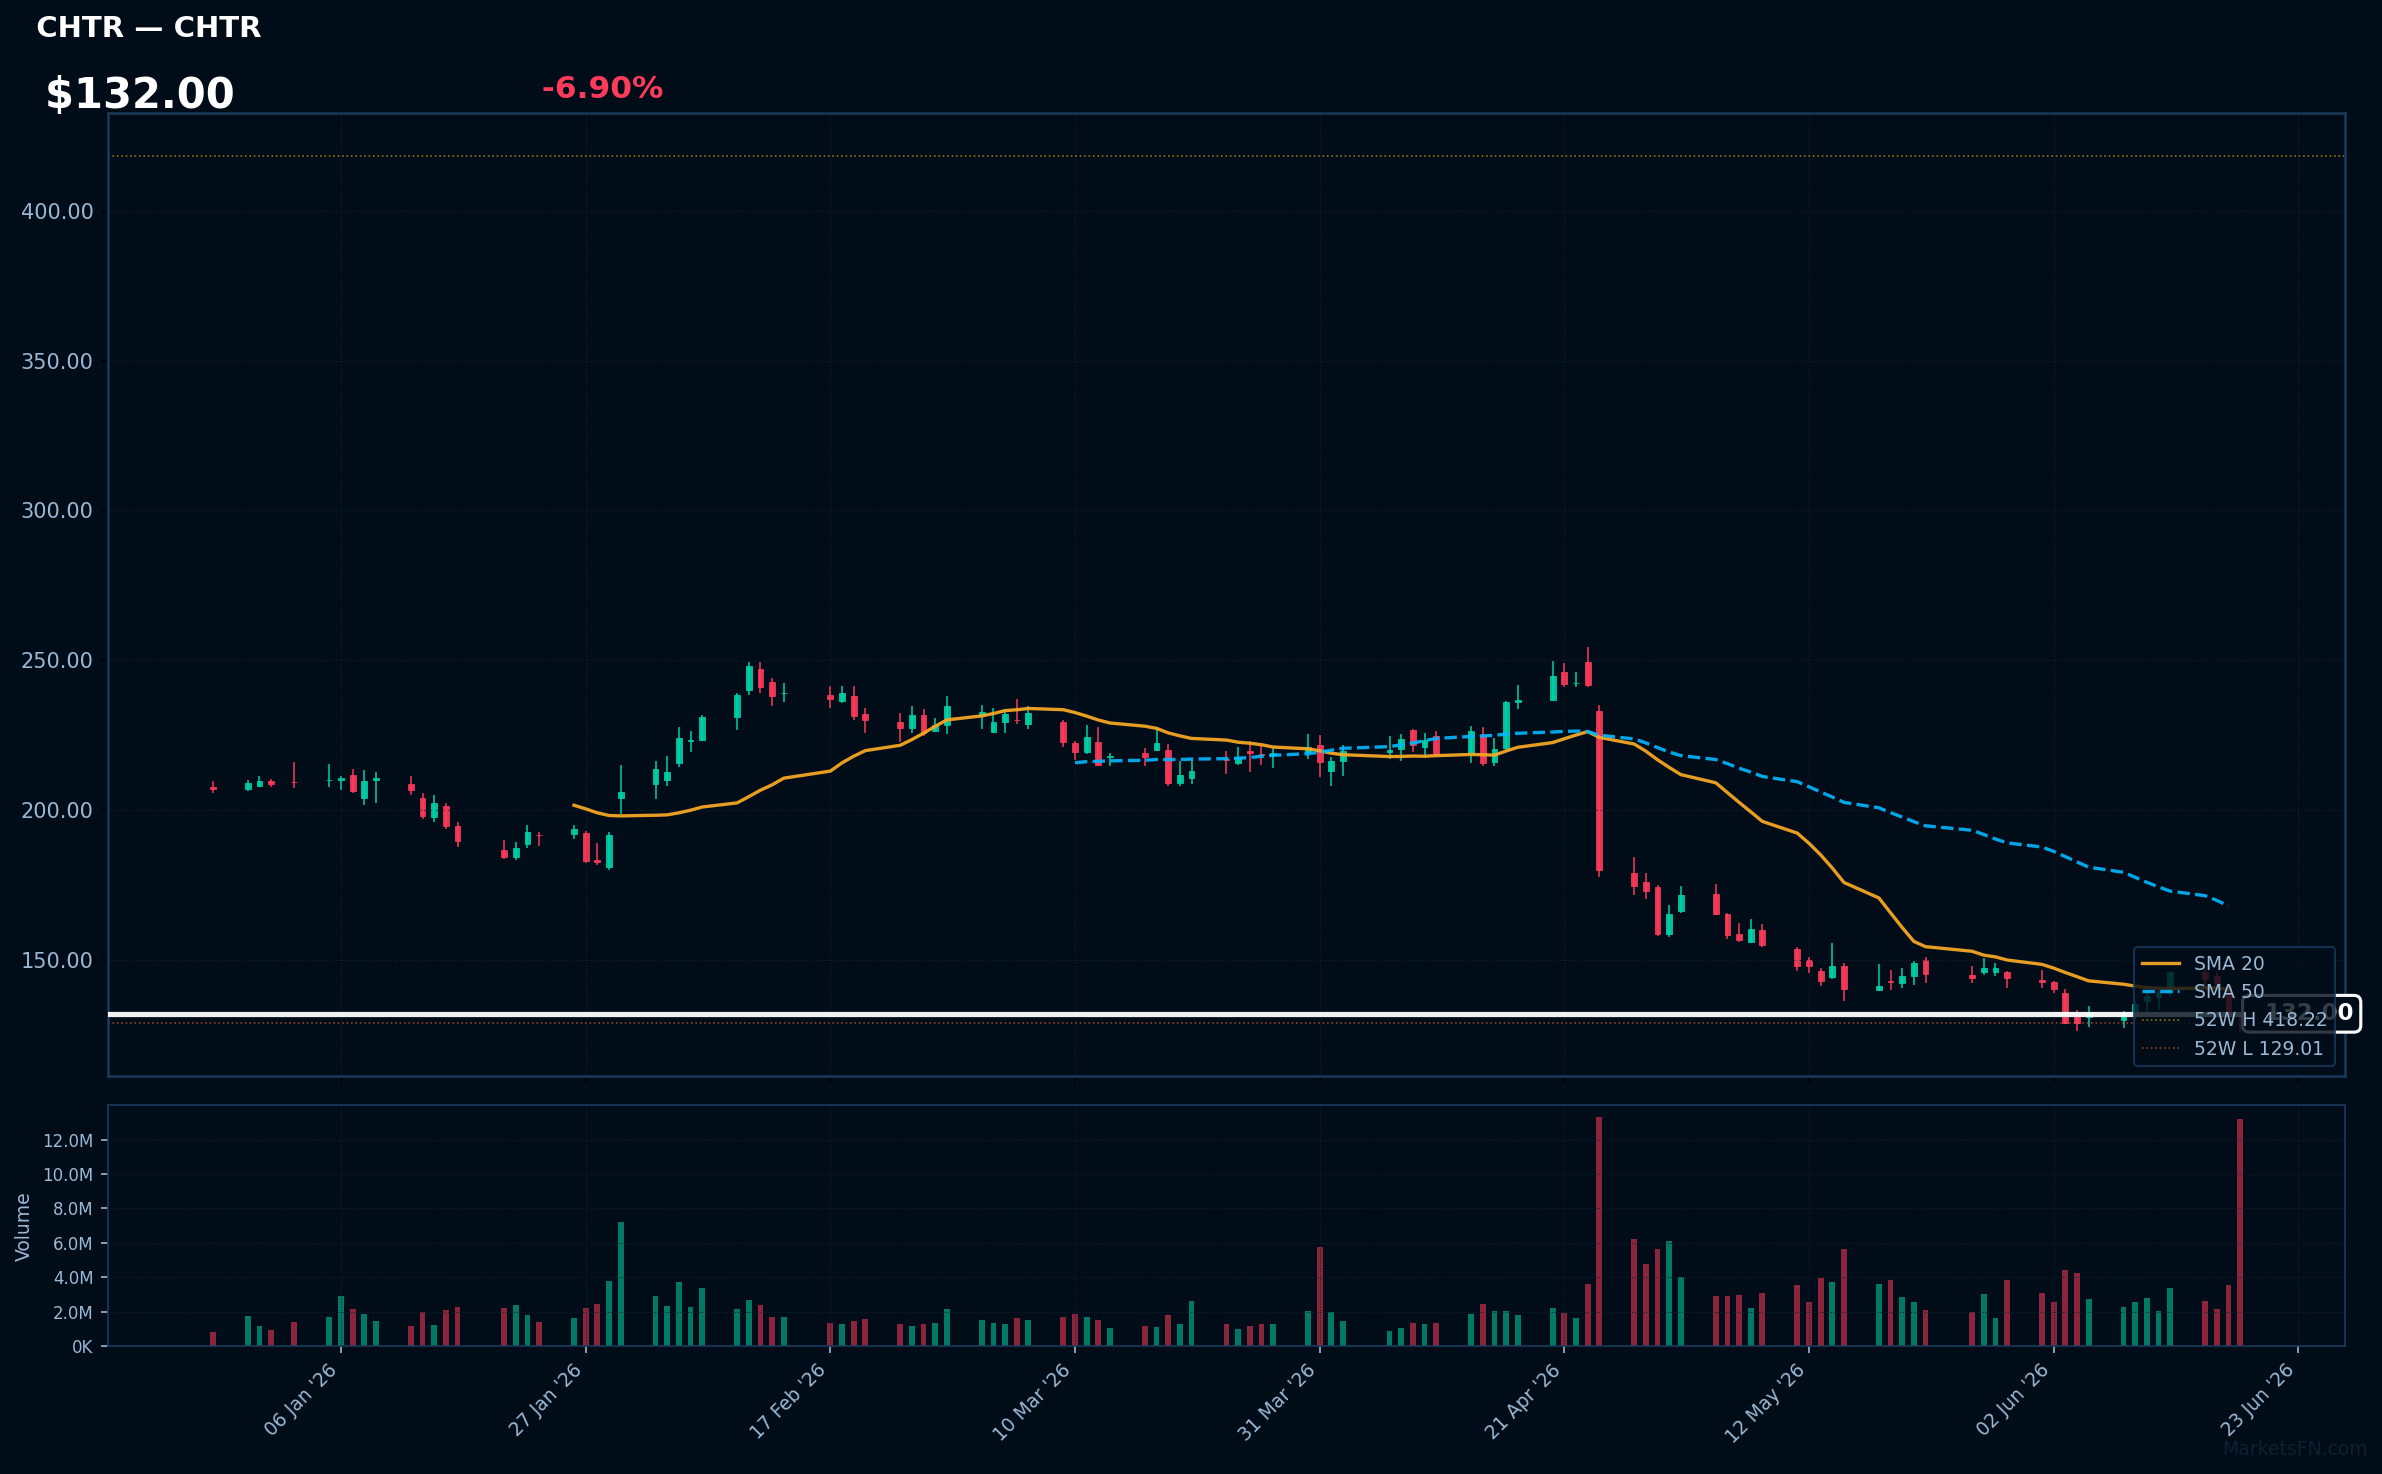
CHTR | Charter Communications Inc | Communication Services | Price: $132.00 | Day: -6.90% | 1W: -4.20% | 1M: -6.52% | RSI: 35.7 | vs MA200: -37.8% | Trend: Below MA20, MA50, MA200
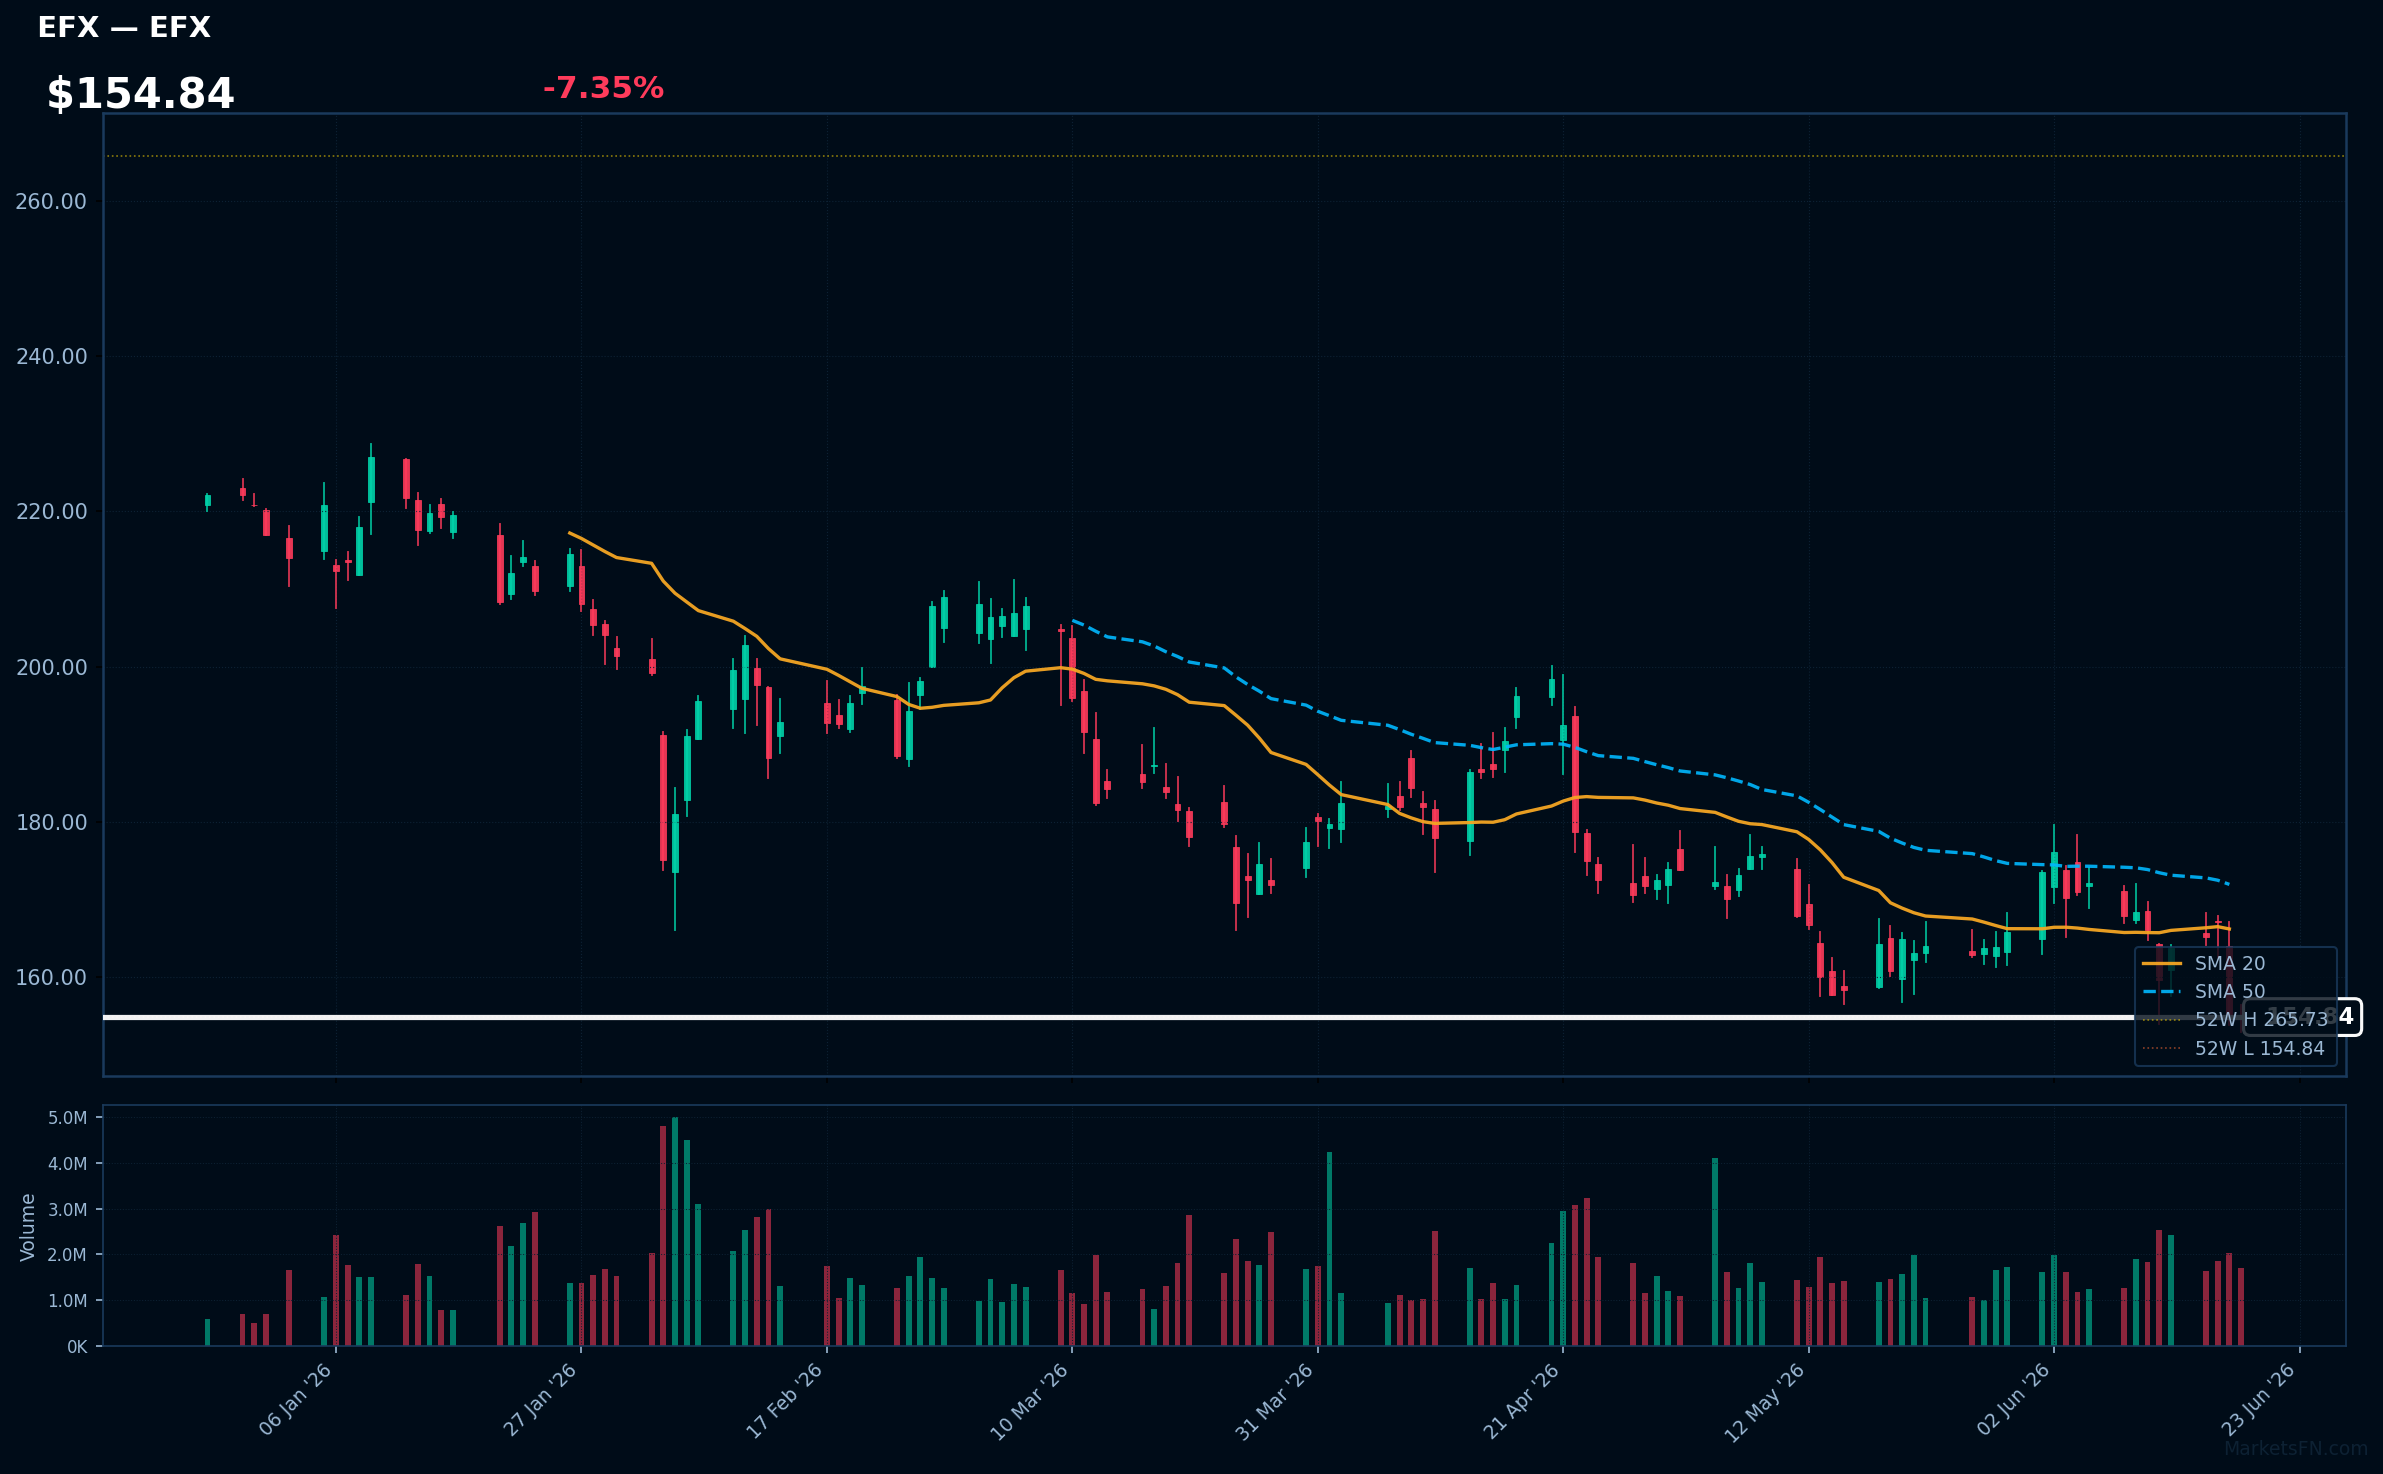
EFX | Equifax, Inc | Industrials | Price: $154.84 | Day: -7.35% | 1W: -6.76% | 1M: -5.72% | RSI: 36.6 | vs MA200: -24.0% | Trend: Below MA20, MA50, MA200
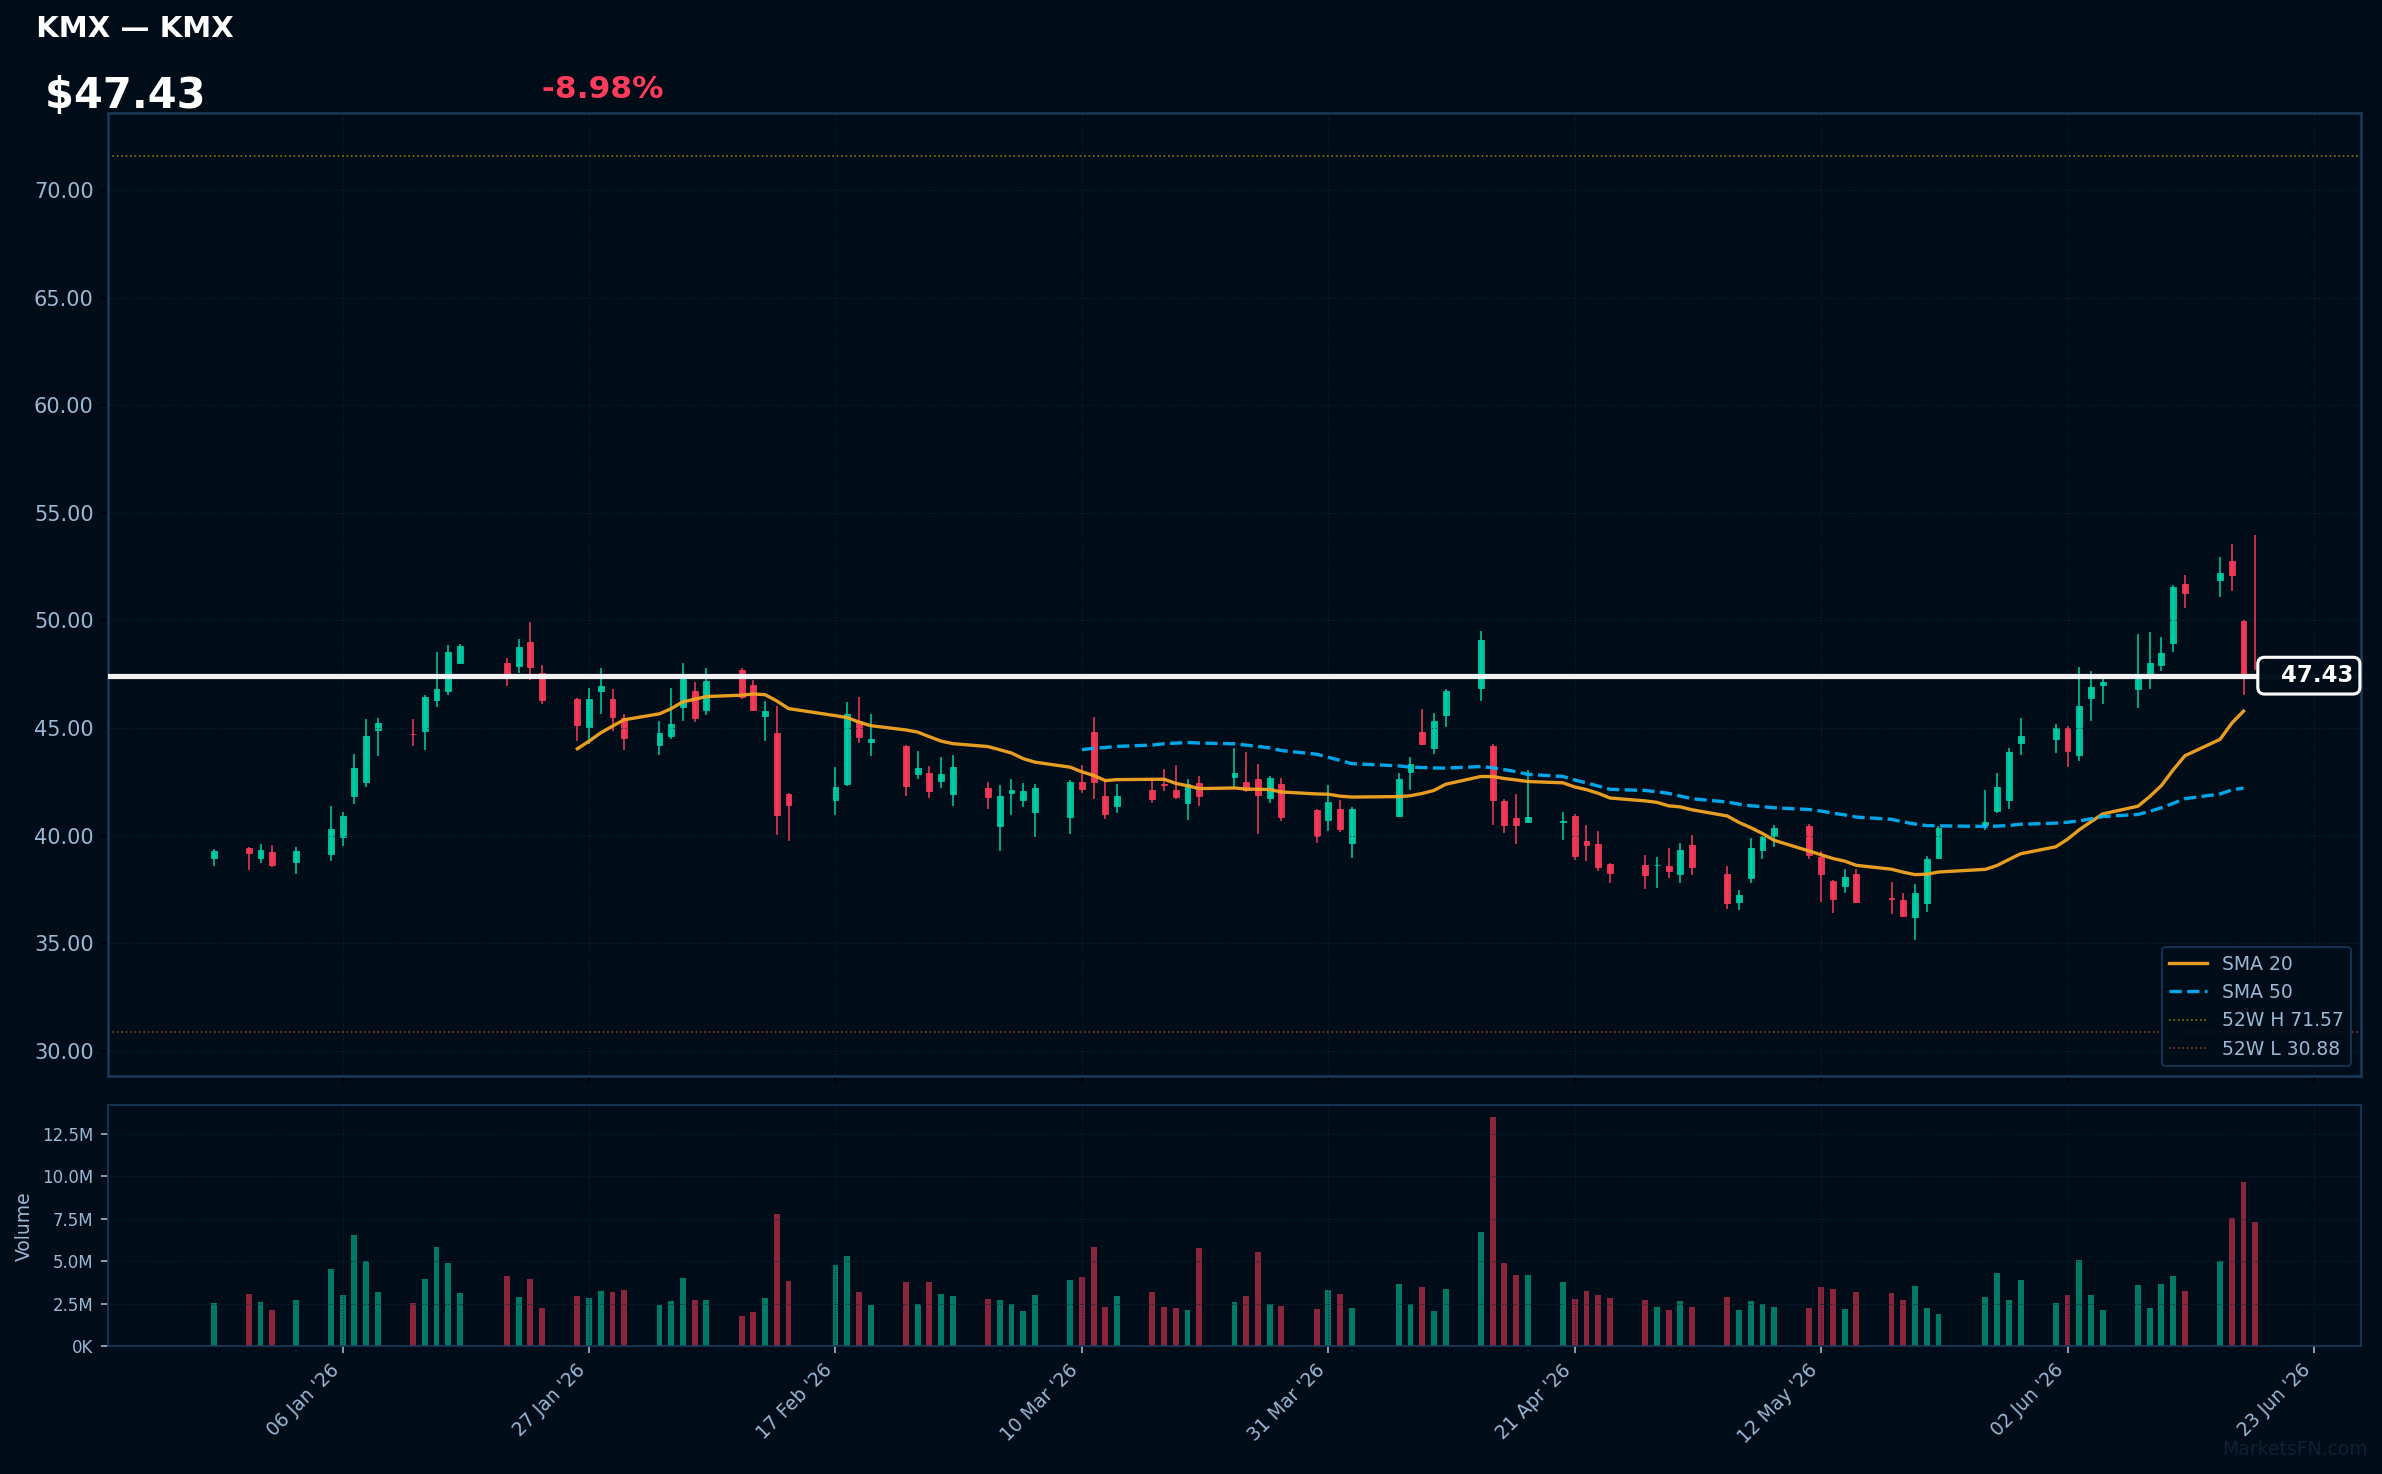
KMX | Carmax Inc | Consumer Cyclical | Price: $47.43 | Day: -8.98% | 1W: -2.21% | 1M: +28.02% | RSI: 56.3 | vs MA200: +9.0% | Trend: Above MA20, MA50, MA200
Market Commentary
The S&P 500 session on June 19, 2026, was marked by extreme weakness, with 428 decliners (86.5%) overwhelming the 66 advancers (13.3%), indicating a broad-based sell-off. The average daily change of 1.73% further underscores the session's negative tone.
Sector rotation is evident in the top gainers and losers. Industrials and Technology stocks were among the top gainers, with names like RTX, AMAT, and AVGO leading the charge, while Industrials, Consumer Cyclical, and Technology were also represented among the top losers, with ODFL, NOW, and IT declining. This mixed signal suggests a complex sector rotation, with some names bucking the trend within their respective sectors.
With only 2.2% of stocks above their MA200, the market is testing key support levels. Traders should watch for a continuation of the decline or a reversal, with the average daily change and advance/decline ratio serving as key indicators. A catalyst for a potential reversal could be a shift in the advance/decline ratio or a sustained move above the MA200 for a larger percentage of constituents.
Methodology
Daily ranking uses the latest session close versus the prior close. RSI (14-day EWM), MA20, MA50, and MA200 are computed from 12 months of daily OHLCV data sourced from Yahoo Finance. Charts show the last 120 trading sessions with SMA 20/50, 52-week H/L markers, and volume. Recent news (last 12 h) is sourced from FinViz. Updated every trading day.
Disclaimer
The content on MarketsFN.com is provided for educational and informational purposes only. It does not constitute financial advice, investment recommendations, or trading guidance. All investments involve risks, and past performance does not guarantee future results. You are solely responsible for your investment decisions and should conduct independent research and consult a qualified financial advisor before acting. MarketsFN.com and its authors are not liable for any losses or damages arising from your use of this information.
Related Articles
- Nasdaq 100 Bull & Bear Radar — June 19, 2026 — Nasdaq 100 Bull & Bear Radar — June 19, 2026 A daily technical sweep of 101 Nasdaq 100 constituents ranked by session…
- Nasdaq 100 Bull & Bear Radar — June 18, 2026 — Nasdaq 100 Bull & Bear Radar — June 18, 2026 A daily technical sweep of 101 Nasdaq 100 constituents ranked by session…
- Nasdaq 100 52-Week Highs & Lows Radar: ASML Holding NV (ASML), Palantir (PLTR) and more — Nasdaq 100 stocks nearest to their 52-week high and low. Bloomberg-style charts, RSI/MA analysis and Grok commentary.
- The Kroger Co. (KR) Sinks 6.80% After Earnings — Post Earning Analysis The Kroger Co. (KR) Sinks 6.80% After Earnings The Kroger Co. operates a chain of supermarkets…
- Kroger (KR) quarter year Kroger Co. Financial Results Summary — Kroger (KR) Q1 2026: Earnings Growth Amidst Sales Pressure — Cautiously Optimistic Kroger Co. (NYSE: KR) reported its…