Tron (TRX) Rises to $0.3288 as RSI Hits 66.4 – What’s Next?
· Crypto · QuoteReporter
Tron (TRX) Rises to $0.3288 as RSI Hits 66.4 – What’s Next?
Tron (TRX/USD) | June 25, 2026 $0.3288 +0.56%
🔍 Technical Analysis
### Technical Analysis of Tron (TRX)
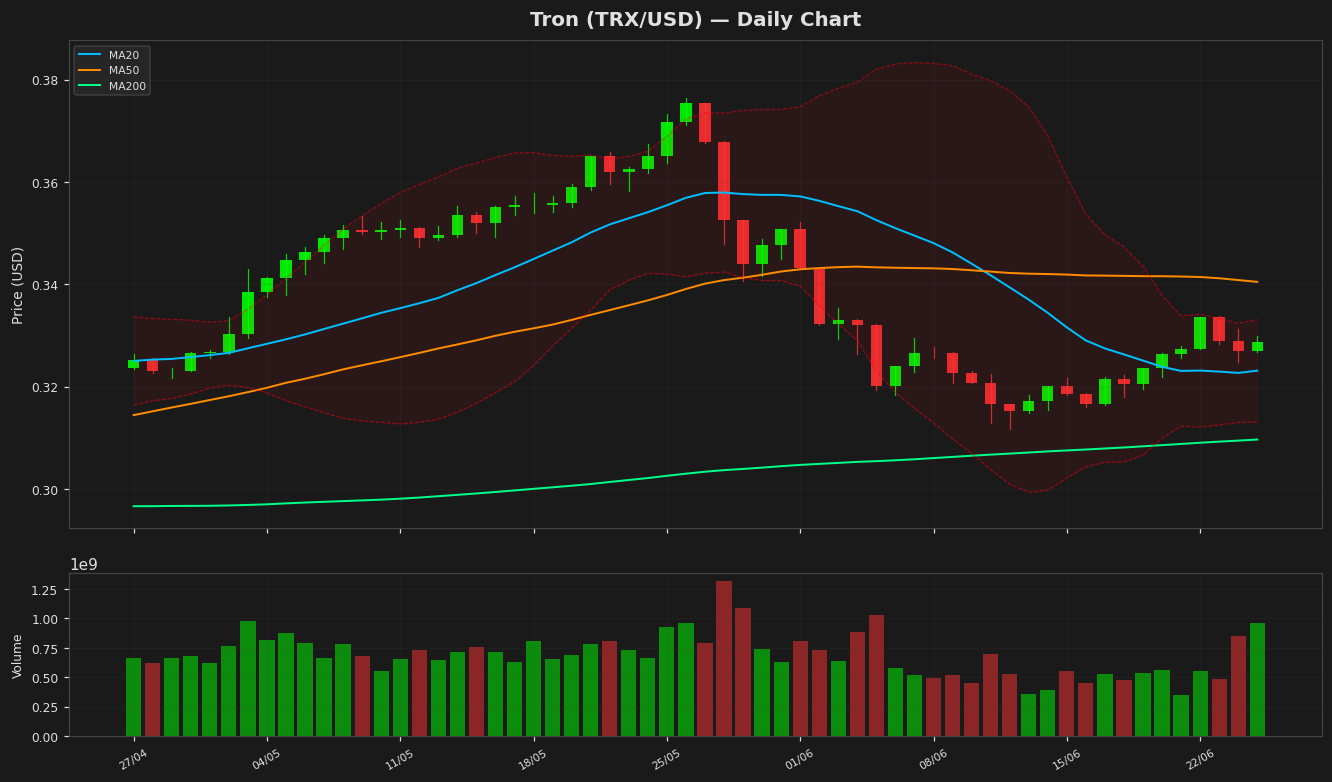
Tron (TRX) is currently trading at **$0.328787**, up **0.56%** on the day, showing mild bullish momentum. The price remains above the **20-day moving average (MA20) at $0.323099**, suggesting short-term support, but below the **50-day MA ($0.340465)**, indicating resistance overhead. The **200-day MA ($0.309633)** acts as a key long-term support level.
Bollinger Bands show the price hovering near the **upper band ($0.333095)**, signaling potential overbought conditions, while the **lower band ($0.313102)** provides immediate downside support. The **RSI(14) at 66.45** leans toward overbought territory but hasn’t yet crossed the 70 threshold, leaving room for further upside before a possible pullback.
The **MACD histogram (-0.002583)** remains below the signal line (-0.004569), reflecting weak bullish momentum and potential consolidation. The **ATR(14) at 0.004371** suggests low volatility, reinforcing a range-bound market.
Key resistance levels to watch are the **52-week high ($0.376332)** and the **YTD high ($0.37633201)**, while the **MA200 ($0.309633)** and **52-week low ($0.26813799)** serve as critical support zones. A breakout above the MA50 could signal a bullish reversal, whereas failure to hold above the MA20 may lead to a retest of lower supports.
Technical Metrics
| Metric | Value |
|---|---|
| Current Price | $0.3288 |
| Daily Change | +0.56% |
| MA 20 | $0.3231 |
| % from MA20 | +1.76% |
| MA 50 | $0.3405 |
| % from MA50 | -3.43% |
| MA 200 | $0.3096 |
| % from MA200 | +6.19% |
| BB Upper | $0.3331 |
| % from BB Upper | -1.29% |
| BB Lower | $0.3131 |
| % from BB Lower | +5.01% |
| RSI (14) | 66.45 |
| MACD | -0.002583 |
| MACD Signal | -0.004569 |
| ATR (14) | 0.004371 |
| 3-Day High | $0.3338 |
| 3-Day Low | $0.3248 |
| 52-Week High | $0.3763 |
| % from 52W High | -12.63% |
| 52-Week Low | $0.2681 |
| % from 52W Low | +22.62% |
| YTD High | $0.3763 |
| % from YTD High | -12.63% |
| YTD Low | $0.2681 |
| % from YTD Low | +22.62% |
📊 Market Commentary
**Tron (TRX) Market Commentary**
Tron (TRX) is trading at $0.3288, up 0.56% today, as the broader crypto market shows cautious optimism. The Relative Strength Index (RSI) at 66.4 suggests TRX is approaching overbought territory, though not yet extreme, indicating sustained buying interest. Over the past 52 weeks, TRX has fluctuated between $0.2681 and $0.3763, with the current price hovering near the upper half of this range.
Market sentiment around TRX remains mixed but leans slightly bullish, supported by steady network activity and its role in decentralized applications (dApps) and stablecoin transactions. Traders are watching key resistance near $0.3763, a break above which could signal further upside. On the downside, support levels around $0.3000 and $0.2681 remain critical to monitor for any pullbacks.
Volume has been moderate, reflecting neither strong accumulation nor distribution, suggesting a wait-and-see approach among investors. The recent uptick aligns with broader altcoin movements, though TRX’s performance remains tied to developments in its ecosystem, including adoption of its USDD stablecoin and network upgrades.
Given the RSI’s position, short-term consolidation or a minor retracement would not be surprising. Traders are keeping an eye on Bitcoin’s momentum, as it often dictates altcoin trends, while also assessing TRX’s ability to hold above $0.3200 for continued bullish momentum. Regulatory developments and macroeconomic factors remain key external influences.
Disclaimer
The content on MarketsFN.com is provided for educational and informational purposes only. It does not constitute financial advice or investment recommendations. All investments involve risk. Cryptocurrency markets are highly volatile. Past performance does not guarantee future results.