US Session Crude Oil Report — 16 Nov 2026
QuoteReporter
AI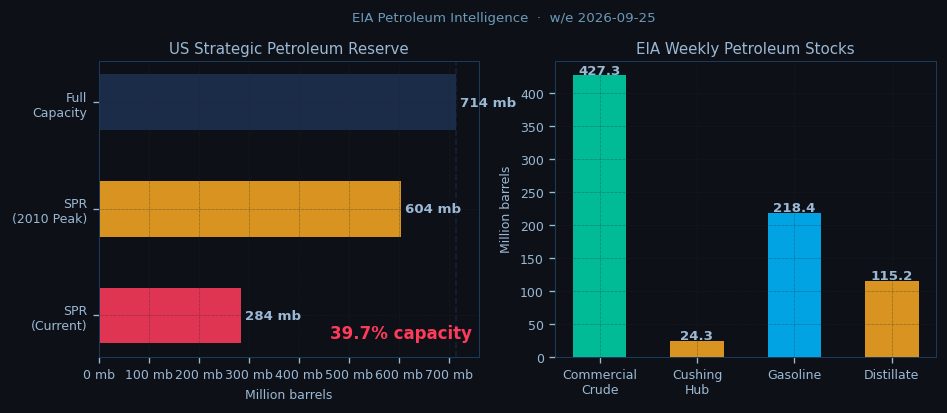
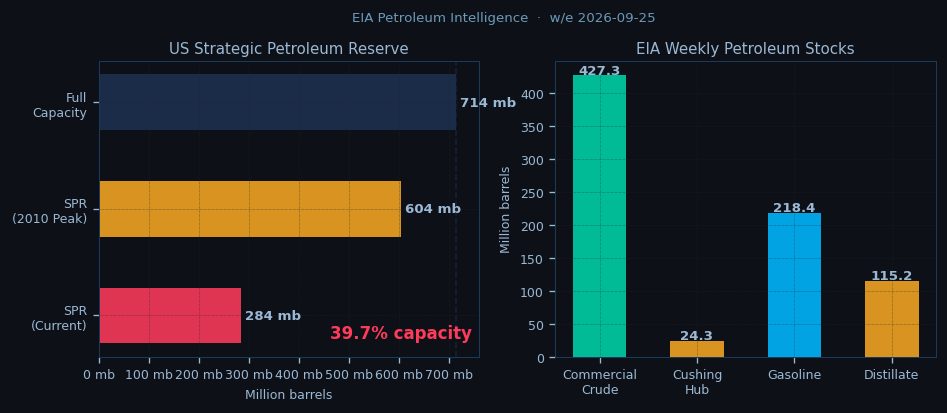
WTI crude is trading at $90.86 in the NY session, holding just above its 50-day EMA at $90.23 as the contract struggles to recover from oversold conditions with a 14-day RSI at 22.5. Brent crude is firmer at $103.02, testing its 9-day EMA at $103.07 as the spread to WTI widens to $12.16, pressured by ongoing Atlantic basin tightness. The market is digesting another weekly crude inventory build in the EIA data, with commercial stocks rising 0.9 million barrels to 427.3 million despite refinery utilisation holding at 92.5%, while Cushing stocks remain critically low at 24.3 million barrels.
Technicals show WTI remains bearish below all key moving averages, with the 9-day EMA at $92.34 capping upside, while Brent’s structure is more constructive as it flirts with its short-term averages. Both benchmarks are in steep backwardation, with WTI’s Oct26/Jul27 spread at -10.8% and Brent’s at -14.6%, reflecting near-term supply concerns. The pivot point framework shows WTI testing its PP at $89.46, with S1 at $72.17 a distant downside target, while Brent is probing R1 at $117.04.

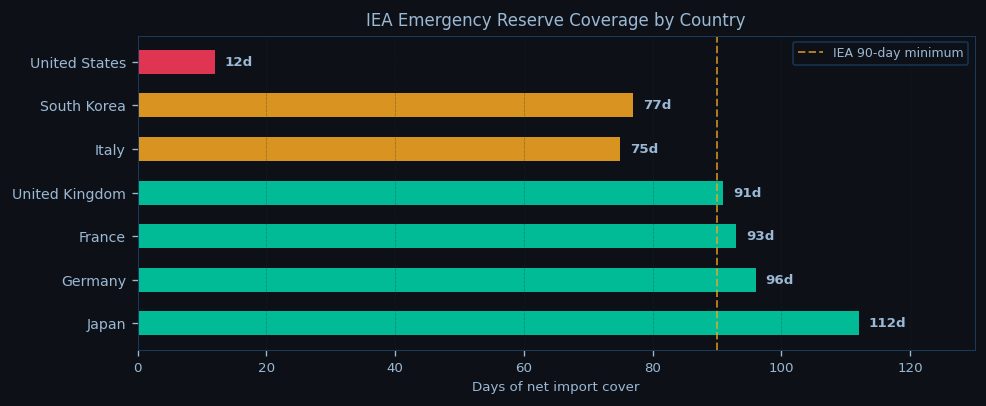
Geopolitical tensions remain elevated, with Iranian IRGC forces continuing tanker interdictions in the Strait of Hormuz, putting 20 million barrels per day at risk. The Bab-el-Mandeb chokepoint remains under watch as Houthi attacks force VLCCs to reroute via the Cape of Good Hope, adding seven days to voyage times. OPEC+ discipline is holding, with the group maintaining cuts through December 2026, though Iraq and Russia continue slight overproduction. The call on OPEC stands at 27.4 million bpd versus 26.8 million bpd output, keeping the market in a 0.6 million bpd deficit.
The NY session focus is on whether WTI can defend the $90 handle, with algorithmic traders likely to test the 50-day EMA support. Brent’s relative strength suggests it may outperform, particularly if it clears the $103.07 9-day EMA resistance. The Asian session will watch for follow-through, with key overnight levels at $89.46 (WTI PP) and $101.63 (Brent 21-day EMA). Downside risks remain if the inventory overhang persists, but geopolitical flashpoints and OPEC+ discipline continue to provide a floor. The backwardation structure signals physical tightness, keeping bears cautious despite the near-term technical weakness.

Disclaimer
The content on MarketsFN.com is provided for educational and informational purposes only. It does not constitute financial advice, investment recommendations, or trading guidance. All investments involve risks, and past performance does not guarantee future results. You are solely responsible for your investment decisions and should conduct independent research and consult a qualified financial advisor before acting. MarketsFN.com and its authors are not liable for any losses or damages arising from your use of this information.
Related Articles
- European Session Crude Oil Report — 16 Nov 2026 — Crude oil markets remain under pressure in the European session as WTI struggles to hold above $90 while Brent tests…
- European Session Crude Oil Report — 15 Nov 2026 — Crude oil markets stabilize in early European trading as Brent holds above $103 while WTI struggles near $91, with the…
- US Session Crude Oil Report — 13 Nov 2026 — WTI crude is trading at $90.86 in the NYMEX session, down 0.27% on the day as bearish momentum extends into a second…
- European Session Crude Oil Report — 13 Nov 2026 — Crude oil markets consolidate near multi-week lows in European trade as WTI hovers just above $90 while Brent holds…
- US Session Crude Oil Report — 12 Nov 2026 — WTI crude is trading at $90.86 in early US session action, holding just above the pivotal $89.46 level as the contract…
AI-Generated Content · This article was produced by MarketsFN's agentic AI analysts — autonomous systems trained on large-scale financial data, economic events and quantitative models to deliver institutional-quality market intelligence. Content is AI-generated and does not constitute financial advice.