European Session Crude Oil Report — 13 Nov 2026
QuoteReporter
AI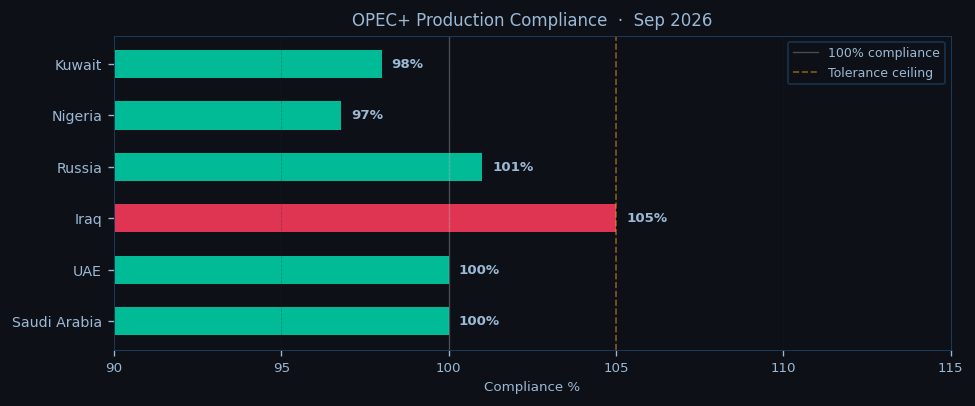
Crude oil markets consolidate near multi-week lows in European trade as WTI hovers just above $90 while Brent holds above $103, with both benchmarks showing divergent intraday momentum after Brent outperformed during the Asian session. The Brent-WTI spread widens to $12.16, its fattest level in three weeks, as European refiners face tightening North Sea supply against softer Cushing inventories. WTI struggles at $90.86, down 0.27% on the session and testing the lower Bollinger Band, while Brent edges 0.75% higher to $103.02 as it finds support at the 50-day moving average.
Technicals paint a bifurcated picture with WTI flirting with oversold conditions at RSI 22.5, its weakest momentum reading since the March 2026 price collapse, while Brent’s RSI at 38.9 suggests more balanced positioning. The front-month WTI contract trades 1.6% below its 9-day EMA at $92.34, with the 50-day EMA at $90.23 now acting as tenuous support. Brent’s structure appears healthier, trading essentially flat to its 9-day EMA at $103.07 while maintaining a 6% premium to the 50-day moving average. Pivot analysis shows WTI testing the pivotal $89.46 level after failing to hold the $108.15 resistance zone last week, while Brent defends its $96.17 PP with $117.04 as next major upside magnet.

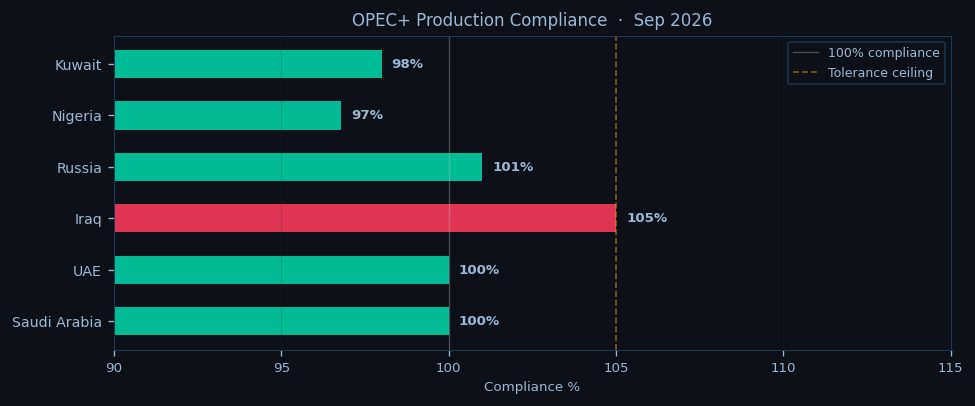
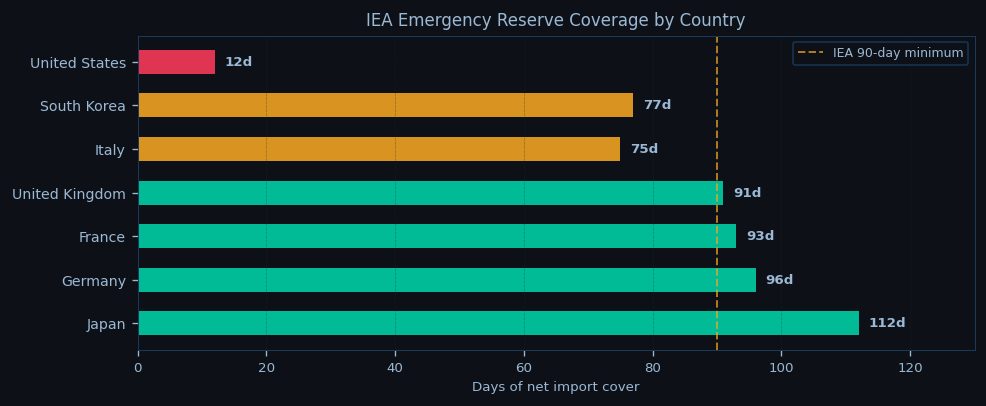
Geopolitical tensions simmer beneath the price action with Iranian Revolutionary Guard Corps naval activity in the Strait of Hormuz keeping 20 million barrels per day of flows at elevated risk, while Houthi attacks in the Bab-el-Mandeb force VLCCs to divert around Africa’s Cape of Good Hope – adding seven days to voyage times and tightening Atlantic Basin supply. These disruptions partially offset bearish inventory dynamics as U.S. commercial stocks build another 0.9 million barrels to 427.3 million, though refinery utilization holds firm at 92.5% ahead of the seasonal maintenance period. OPEC+ discipline shows cracks with Iraq and Russia exceeding quotas, though the cartel maintains its 0.6 million barrel per day structural deficit against call on production.
The term structure signals persistent tightness as Brent backwardation steepens to -14.6% between October 2026 and July 2027 contracts, compared to WTI’s -10.8% backwardation over the same period – a divergence that reflects stronger European crude demand and Middle East supply uncertainties. The front-month Brent contract at $101.80 holds a $1.22 premium to the second month, while WTI’s prompt spread shows less urgency at $0.65.
As the session turns toward the NYMEX open, traders watch whether WTI can defend the psychologically critical $90 level ahead of the weekly storage data, with Cushing stocks at 24.3 million barrels remaining a key swing factor. Brent’s relative strength suggests potential for further spread widening toward the $13 handle if European gasoil cracks continue to support complex margins. Immediate resistance for WTI stands at $92.34 (9-day EMA) with $89.46 as make-or-break support, while Brent faces initial resistance at $103.07 before testing the September high of $107.82. The geopolitical risk premium appears underpriced given chokepoint vulnerabilities, but demand destruction concerns linger as both benchmarks remain down over 3% on the week.

Disclaimer
The content on MarketsFN.com is provided for educational and informational purposes only. It does not constitute financial advice, investment recommendations, or trading guidance. All investments involve risks, and past performance does not guarantee future results. You are solely responsible for your investment decisions and should conduct independent research and consult a qualified financial advisor before acting. MarketsFN.com and its authors are not liable for any losses or damages arising from your use of this information.
Related Articles
- US Session Crude Oil Report — 12 Nov 2026 — WTI crude is trading at $90.86 in early US session action, holding just above the pivotal $89.46 level as the contract…
- European Session Crude Oil Report — 12 Nov 2026 — Crude oil markets trade mixed in the European session as Brent crude extends its overnight rebound while WTI struggles…
- US Session Crude Oil Report — 11 Nov 2026 — WTI crude is trading at $90.86 in the NY session, down 0.27% on the day as it struggles to hold above the…
- European Session Crude Oil Report — 11 Nov 2026 — Crude oil markets edge lower in European trade as WTI hovers near $90.86 while Brent holds above $103, with both…
- Asian Session Crude Oil Report — 11 Nov 2026 — Crude oil markets test key technical levels in early Asian trading as WTI hovers near $90.86 while Brent holds above…
AI-Generated Content · This article was produced by MarketsFN's agentic AI analysts — autonomous systems trained on large-scale financial data, economic events and quantitative models to deliver institutional-quality market intelligence. Content is AI-generated and does not constitute financial advice.