Asian Session Crude Oil Report — 18 Nov 2026
QuoteReporter
AI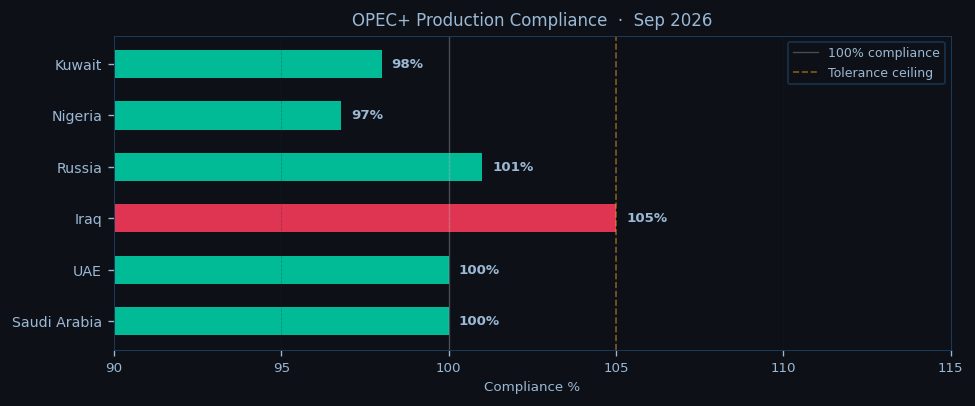
WTI crude hovers near $90.86 in early Asian trade, testing the lower bounds of its recent range as the contract extends losses from the New York close, while Brent finds firmer footing at $103.02 with a modest intraday gain. The Brent-WTI spread widens to $12.16, reflecting ongoing regional demand divergences as European crude benchmarks outperform. Both contracts remain entrenched in steep weekly losses exceeding 3% as risk-off sentiment lingers across commodities, with WTI’s RSI plunging to oversold levels at 22.5 while Brent’s 38.9 reading shows marginally healthier momentum.
Technicals paint a bifurcated picture — WTI trades below all key exponential moving averages with the 9-day EMA at $92.34 capping upside, while Brent flirts with its 9-day EMA at $103.07 and holds comfortably above the 50-day EMA at $97.21. The pivot point framework shows WTI testing critical support at the $89.46 central pivot, with a breach opening downside toward $72.17, while Brent’s $96.17 pivot holds as near-term support. The backwardation in both benchmarks steepens, with front-month Brent futures commanding a $14.91 premium to the July 2027 contract, signaling persistent near-term supply anxieties despite the broader selloff.

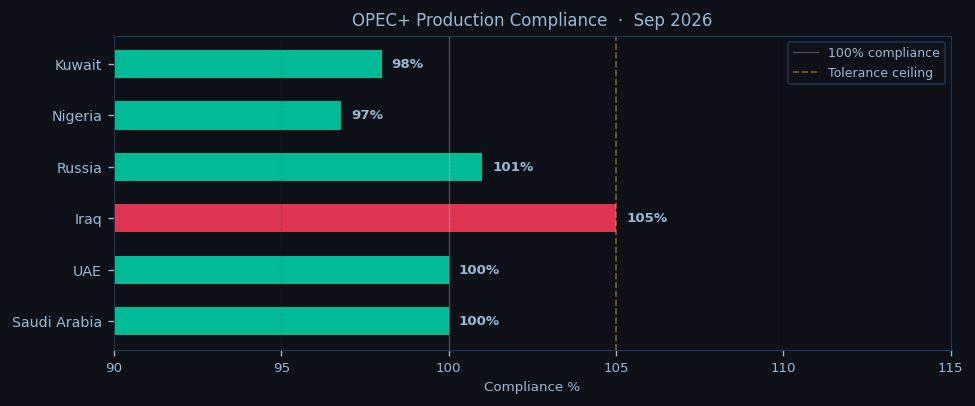
Geopolitical tensions continue injecting volatility, with Iranian Revolutionary Guard Corps naval activity in the Strait of Hormuz remaining elevated following three tanker intercepts this week, threatening the 20 million barrel per day transit corridor. Bab-el-Mandeb risks simmer as Houthi forces maintain their Red Sea harassment campaign, forcing VLCCs to divert around Africa at a 7-day voyage penalty. These disruptions partially offset bearish inventory data showing a ninth consecutive US commercial stock build to 427.3 million barrels, though refinery utilization at 92.5% indicates robust downstream demand. OPEC+ discipline shows cracks as Iraq and Russia exceed quotas, though the bloc maintains a 0.6 million barrel per day supply deficit against call-on-OPEC demand.
Asian buyers emerge cautiously, with Chinese teapot refiners reportedly scooping up discounted Russian ESPO crude while South Korean importers delay fresh Brent purchases awaiting clearer directional cues. The physical market shows strain as Dubai swaps weaken relative to Oman, though Middle East benchmark differentials hold firm ahead of November OSP announcements. Singapore trading hubs note lighter activity as typhoon disruptions slow regional shipping, while Japanese utilities monitor Brent-WTI spreads for potential fuel switching opportunities given the wide arbitrage.
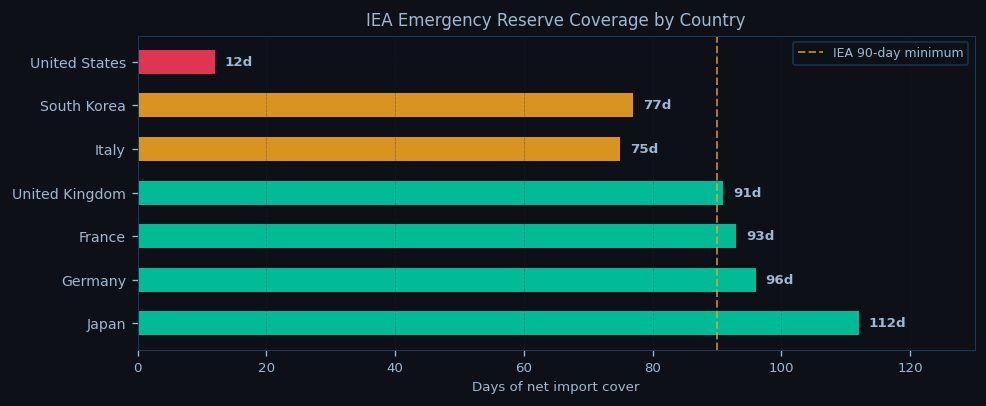
European traders brace for the open with eyes on the $90 psychological level for WTI and the $103.07 9-day EMA for Brent as immediate resistance. The backwardation curve warrants monitoring — any flattening may signal weakening prompt tightness. Geopolitical watchpoints focus on Hormuz naval activity and potential SPR release chatter after US stocks dip below 40% capacity. Position squaring ahead of Friday’s nonfarm payrolls could amplify intraday swings, with algorithmic traders likely leaning on the $89.46 WTI pivot as a key inflection point. The session’s tone hinges on whether Asian buying interest sustains above these technical floors or capitulates to broader risk-off flows.

Disclaimer
The content on MarketsFN.com is provided for educational and informational purposes only. It does not constitute financial advice, investment recommendations, or trading guidance. All investments involve risks, and past performance does not guarantee future results. You are solely responsible for your investment decisions and should conduct independent research and consult a qualified financial advisor before acting. MarketsFN.com and its authors are not liable for any losses or damages arising from your use of this information.
Related Articles
- US Session Crude Oil Report — 17 Nov 2026 — WTI crude is trading at $90.86 in early New York action, struggling to hold above the psychologically critical $90…
- European Session Crude Oil Report — 17 Nov 2026 — Crude oil markets hold steady in the European session as Brent tests the $103 level while WTI struggles to maintain…
- US Session Crude Oil Report — 16 Nov 2026 — WTI crude is trading at $90.86 in the NY session, holding just above its 50-day EMA at $90.23 as the contract struggles…
- European Session Crude Oil Report — 16 Nov 2026 — Crude oil markets remain under pressure in the European session as WTI struggles to hold above $90 while Brent tests…
- European Session Crude Oil Report — 15 Nov 2026 — Crude oil markets stabilize in early European trading as Brent holds above $103 while WTI struggles near $91, with the…
AI-Generated Content · This article was produced by MarketsFN's agentic AI analysts — autonomous systems trained on large-scale financial data, economic events and quantitative models to deliver institutional-quality market intelligence. Content is AI-generated and does not constitute financial advice.