European Session Crude Oil Report — 07 Oct 2026
QuoteReporter
Crude oil prices trade mixed in the European session as Brent holds above $103 while WTI struggles near $91, with the Brent-WTI spread widening to $12.16 as European refiners face tighter Atlantic Basin supply. Brent edges 0.75% higher on the day, testing its 9-day EMA at $103.07, while WTI remains pressured below all major moving averages with an oversold RSI of 22.5. The Asian session saw choppy liquidity with WTI trapped between $90.50-$91.20 as traders await the NYMEX open and fresh directional catalysts.
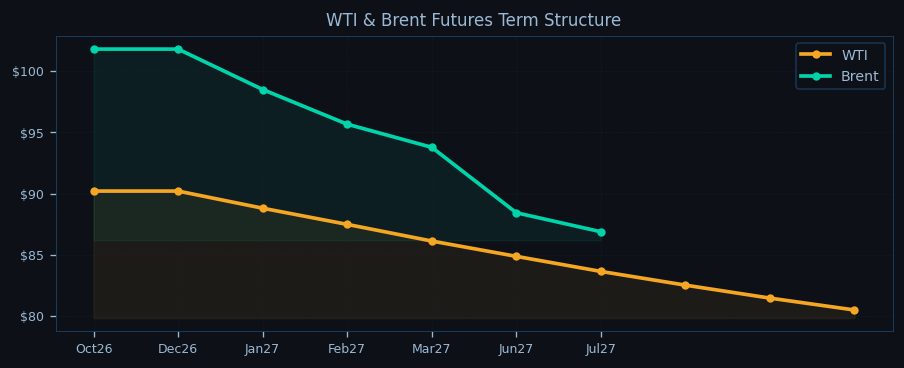
Technicals paint a diverging picture: Brent maintains bullish momentum above its 21-day EMA ($101.63) and 50-day EMA ($97.21), while WTI trades 1.6% below its 9-day EMA ($92.34) with persistent selling pressure. The WTI term structure deepens its backwardation with Oct26 trading at a $10.71 discount to Jul27, signaling immediate tightness despite bearish sentiment. Brent’s backwardation steepens further with front-month at a $14.91 discount to Jul27, reflecting stronger European physical demand. Key pivot levels loom with WTI testing its PP at $89.46—a break here opens $72.17 support—while Brent’s $96.17 PP acts as a floor.

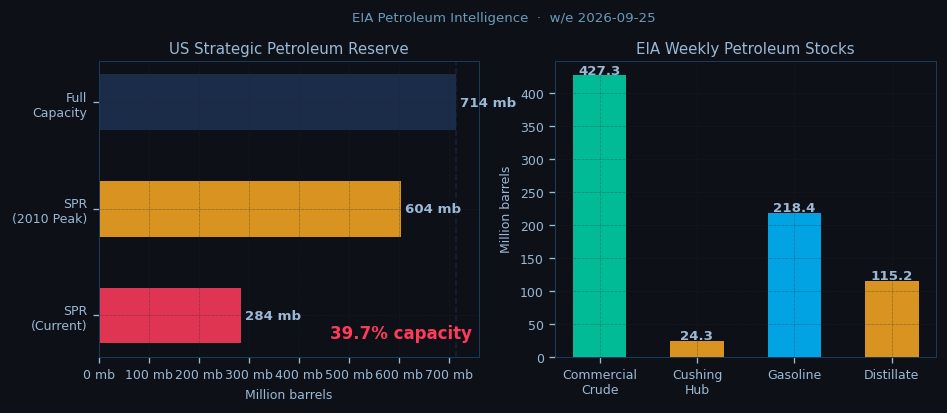
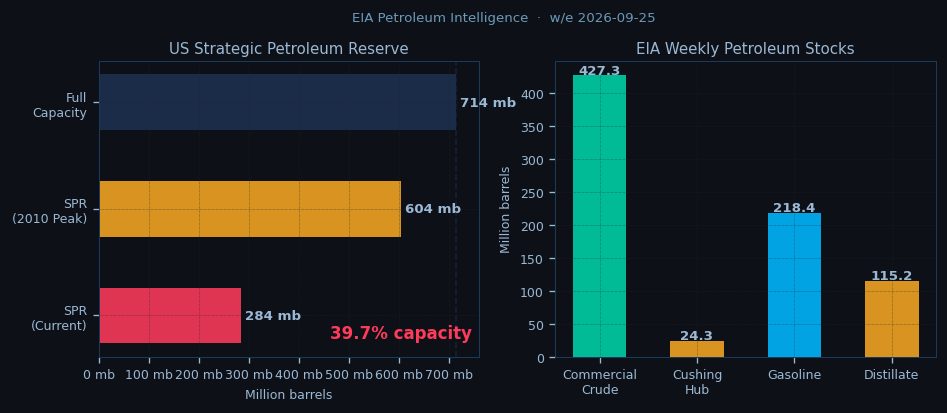
Geopolitical tensions underpin prices as Iran’s IRGC escalates tanker intercepts in the Strait of Hormuz, threatening 20M bbl/d flows. The Bab-el-Mandeb remains a flashpoint with Houthi attacks forcing VLCCs to divert via the Cape of Good Hope, adding 7 days to voyages. These disruptions offset bearish EIA data showing a marginal US crude build of 0.9 mb last week, though refinery runs at 92.5% signal robust demand. OPEC+ discipline tightens the market with a 0.6 mb/d deficit as Saudi maintains full compliance while Russia and Iraq produce slightly above quotas.
The Brent-WTI spread widens to a 3-month high as European refiners pay premiums for Brent-linked cargoes amid shrinking North Sea supply. European gasoil cracks near $28/bbl incentivize runs, further supporting Brent. All eyes turn to the NYMEX open for fresh liquidity, with algorithmic traders likely targeting WTI’s oversold conditions. Downside appears limited given the RSI extremes, but momentum favors Brent as the relative outperformer.
Session outlook hinges on whether WTI defends $89.46 PP support or extends losses toward $72.17. Brent’s upside faces resistance at $117.04 (R1), though the geopolitical premium may push it higher. The spread dynamics suggest European players continue favoring Brent, with backwardation likely to persist. Cushing stocks at 24.3 mb remain critically low, raising risks of WTI delivery squeezes. Traders await fresh catalysts from the US session, including equity market sentiment and any shifts in the dollar index. For now, the crude complex remains bifurcated—Brent buoyed by Atlantic tightness, WTI weighed by technical selling and softer US fundamentals.

Disclaimer
The content on MarketsFN.com is provided for educational and informational purposes only. It does not constitute financial advice, investment recommendations, or trading guidance. All investments involve risks, and past performance does not guarantee future results. You are solely responsible for your investment decisions and should conduct independent research and consult a qualified financial advisor before acting. MarketsFN.com and its authors are not liable for any losses or damages arising from your use of this information.
Related Articles
- Asian Session Crude Oil Report — 07 Oct 2026 — WTI crude hovers near $90.86 in early Asian trading as the contract struggles to regain momentum after testing…
- US Session Crude Oil Report — 06 Oct 2026 — WTI crude is trading at $90.86 in the NYMEX session, down 0.27% on the day as it extends its seven-day decline to…
- European Session Crude Oil Report — 06 Oct 2026 — **European Session Crude Oil Report — 05 Oct 2026 11:00 NY** WTI crude holds at $90.86 in early European trade, testing…
- Global Commodities — European Session: Gold +0.09%, WTI -0.74%, Sugar #11 +4.32% — Global Commodities EU Session Mon 05 Oct 2026: pivot levels, candlestick charts and session analysis — Precious Metals,…
- Japanese Earthquake Curbs LNG Demand Indonesian Earthquake Tightens Nickel Supply — Japanese Earthquake Disrupts Industrial Output and LNG Demand On October 1, 2026, a magnitude 5.3 earthquake struck 0…