Nasdaq 100 Bull & Bear Radar — July 02, 2026
· Stocks · QuoteReporter
Nasdaq 100 Bull & Bear Radar — July 02, 2026
A daily technical sweep of 101 Nasdaq 100 constituents ranked by session performance, enriched with RSI, MA20/MA50/MA200 trend signals, Bloomberg-style charts, and recent news.
Index-Wide Breadth
| Constituents tracked | 101 |
| Advancing | 77 (76.2%) |
| Declining | 23 (22.8%) |
| Average daily change | +0.76% |
| Above MA200 | 12 (11.9%) |
Top 10 Gainers
Today's strongest Nasdaq 100 performers. Sector leadership: Technology (6), Healthcare (3), Utilities (1).
| Ticker | Company | Sector | Price | Day % | 1W % | 1M % | RSI | vs MA200 | Trend |
|---|---|---|---|---|---|---|---|---|---|
| MSTR | Strategy Inc | Technology | $103.58 | +10.91% | +21.18% | -24.01% | 42.3 | -42.9% | Below MA20, MA50, MA200 |
| PLTR | Palantir Technologies Inc | Technology | $131.40 | +4.51% | +22.29% | -13.79% | 53.1 | -16.8% | Above MA20 · Below MA50, MA200 |
| AZN | Astrazeneca plc ADR | Healthcare | $192.14 | +4.50% | +3.48% | +8.28% | 59.8 | +4.7% | Above MA20, MA50, MA200 |
| VRTX | Vertex Pharmaceuticals, Inc | Healthcare | $517.17 | +3.85% | +7.70% | +21.66% | 78.9 | +16.5% | Above MA20, MA50, MA200 |
| ON | ON Semiconductor Corp | Technology | $97.93 | +3.49% | -17.50% | -23.85% | 42.8 | +37.8% | Above MA200 · Below MA20, MA50 |
| ARM | Arm Holdings plc. ADR | Technology | $349.01 | +3.42% | +0.51% | -13.21% | 51.2 | +96.8% | Above MA50, MA200 · Below MA20 |
| AAPL | Apple Inc | Technology | $303.95 | +3.25% | +10.51% | -3.53% | 57.7 | +12.3% | Above MA20, MA50, MA200 |
| CEG | Constellation Energy Corporation | Utilities | $243.50 | +2.96% | -9.55% | -10.86% | 36.9 | -23.2% | Below MA20, MA50, MA200 |
| BIIB | Biogen Inc | Healthcare | $215.93 | +2.95% | +7.10% | +14.54% | 65.1 | +21.6% | Above MA20, MA50, MA200 |
| CRWD | Crowdstrike Holdings Inc | Technology | $198.49 | +2.75% | +16.86% | +3.14% | 73.9 | +58.0% | Above MA20, MA50, MA200 |
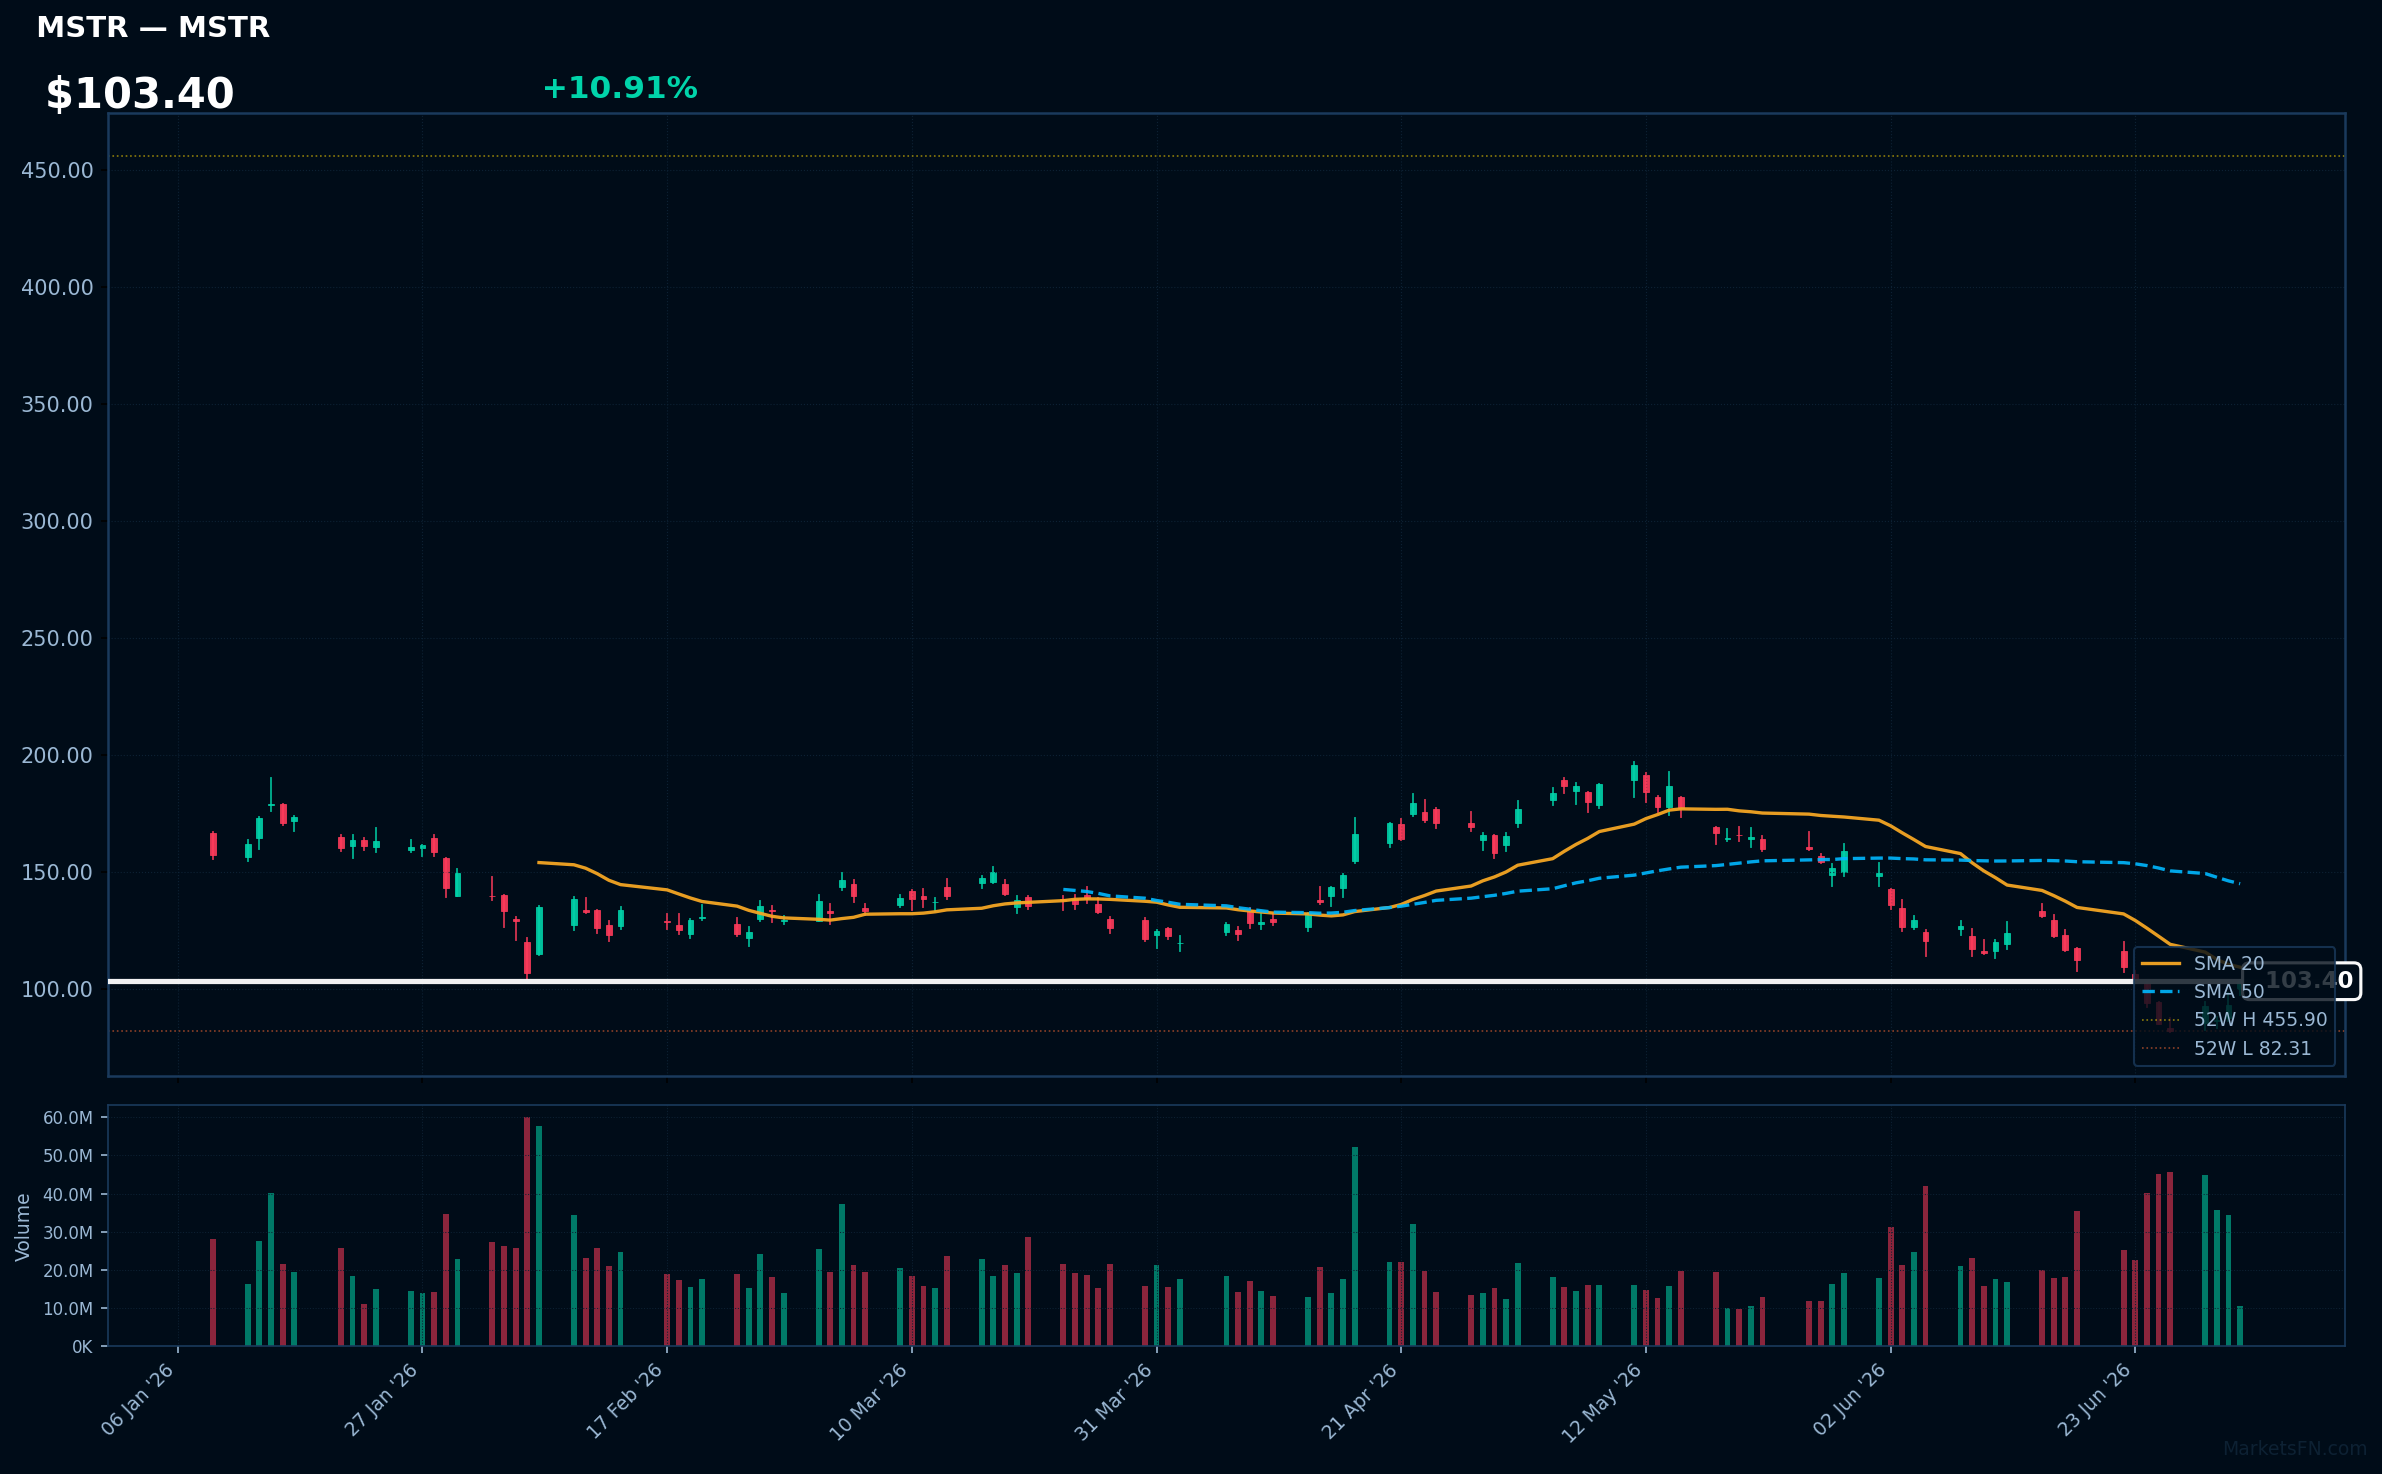
MSTR | Strategy Inc | Technology | Price: $103.58 | Day: +10.91% | 1W: +21.18% | 1M: -24.01% | RSI: 42.3 | vs MA200: -42.9% | Trend: Below MA20, MA50, MA200
Recent headlines (last 12h)
- Cantor Fitzgerald Says Crypto Winter Is Near An End
- Buying Time, or Why Strategy Stock Is Gaining After Unveiling a New Bitcoin Playbook
- Strategy Stock Is Bouncing Back on a Big Bitcoin Pivot, but a Hurdle Remains
- Metaplanet Hits 43,000 BTC Milestone, Now the Worlds 3rd Largest Corporate Holder
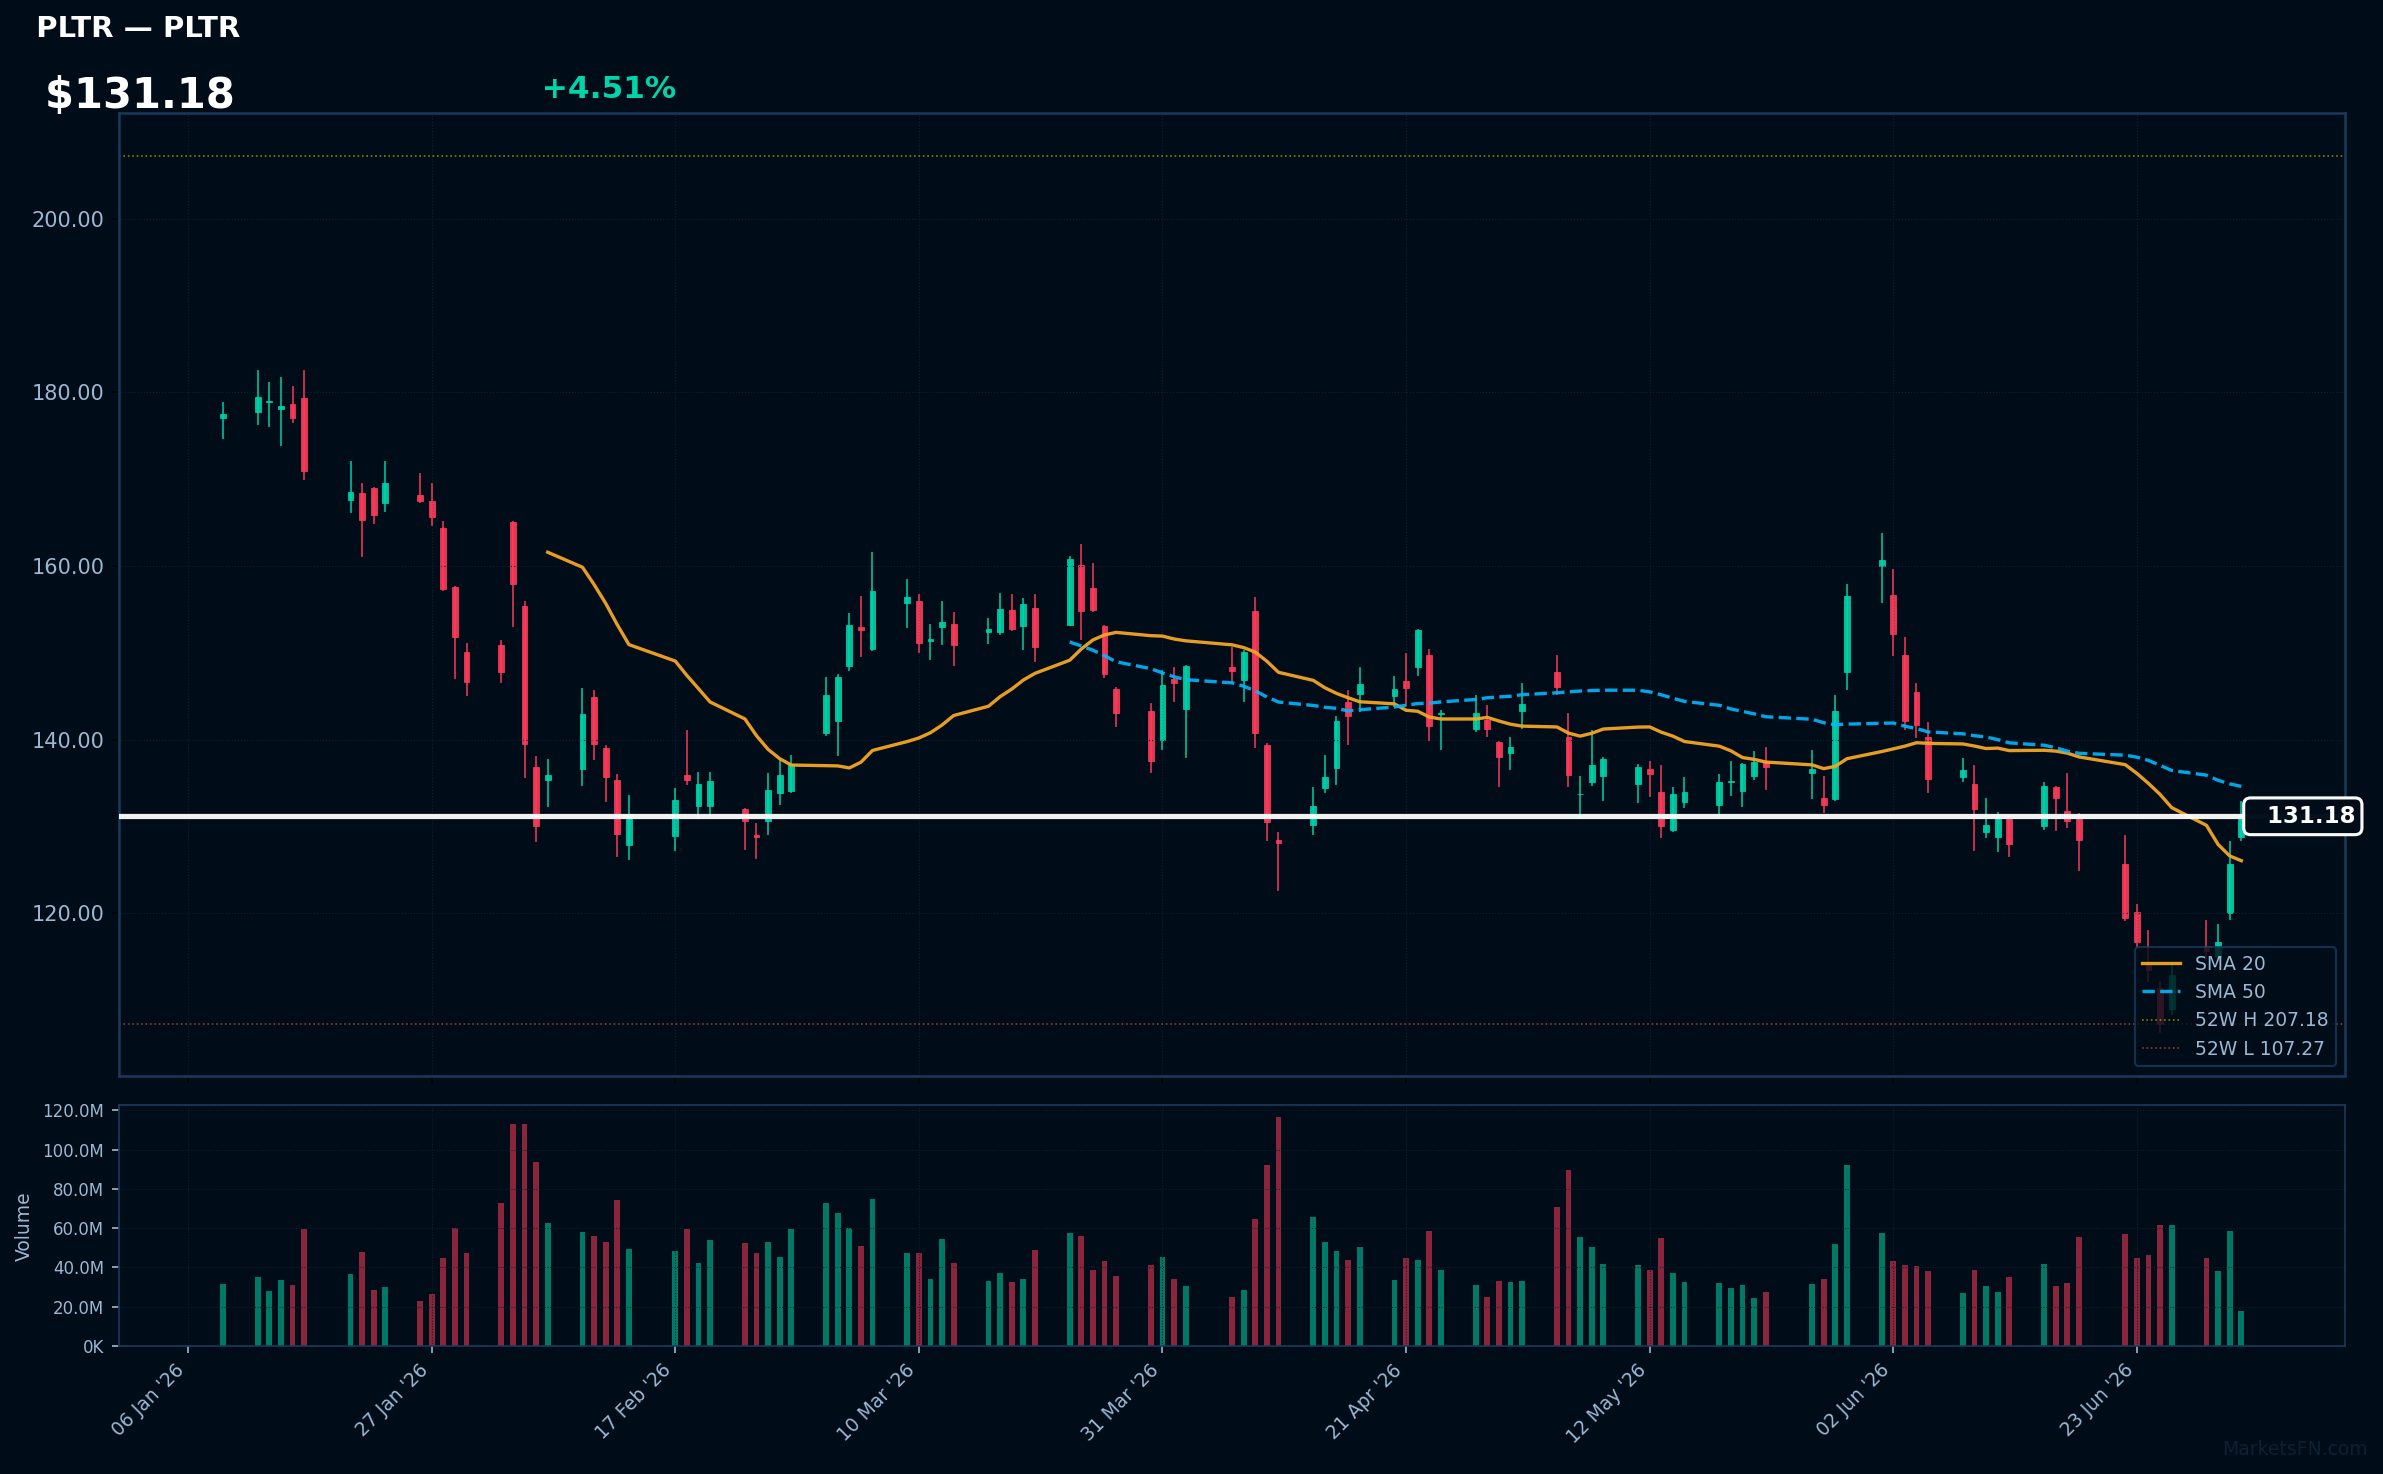
PLTR | Palantir Technologies Inc | Technology | Price: $131.40 | Day: +4.51% | 1W: +22.29% | 1M: -13.79% | RSI: 53.1 | vs MA200: -16.8% | Trend: Above MA20 · Below MA50, MA200
Recent headlines (last 12h)
- Palantir Stock Is Surging Again. A Bullish Upgrade Adds to the Nvidia Momentum.
- Palantir, Chevron upgraded: Wall Street's top analyst calls
- Palantir Stock Upgraded to Buy. Other Software Companies Can't Compete in This AI Era, Say Analysts.
- Three Years of War Changed What Governments Buy. One Player is Already Winning Contracts (NASDAQ: MDWD)
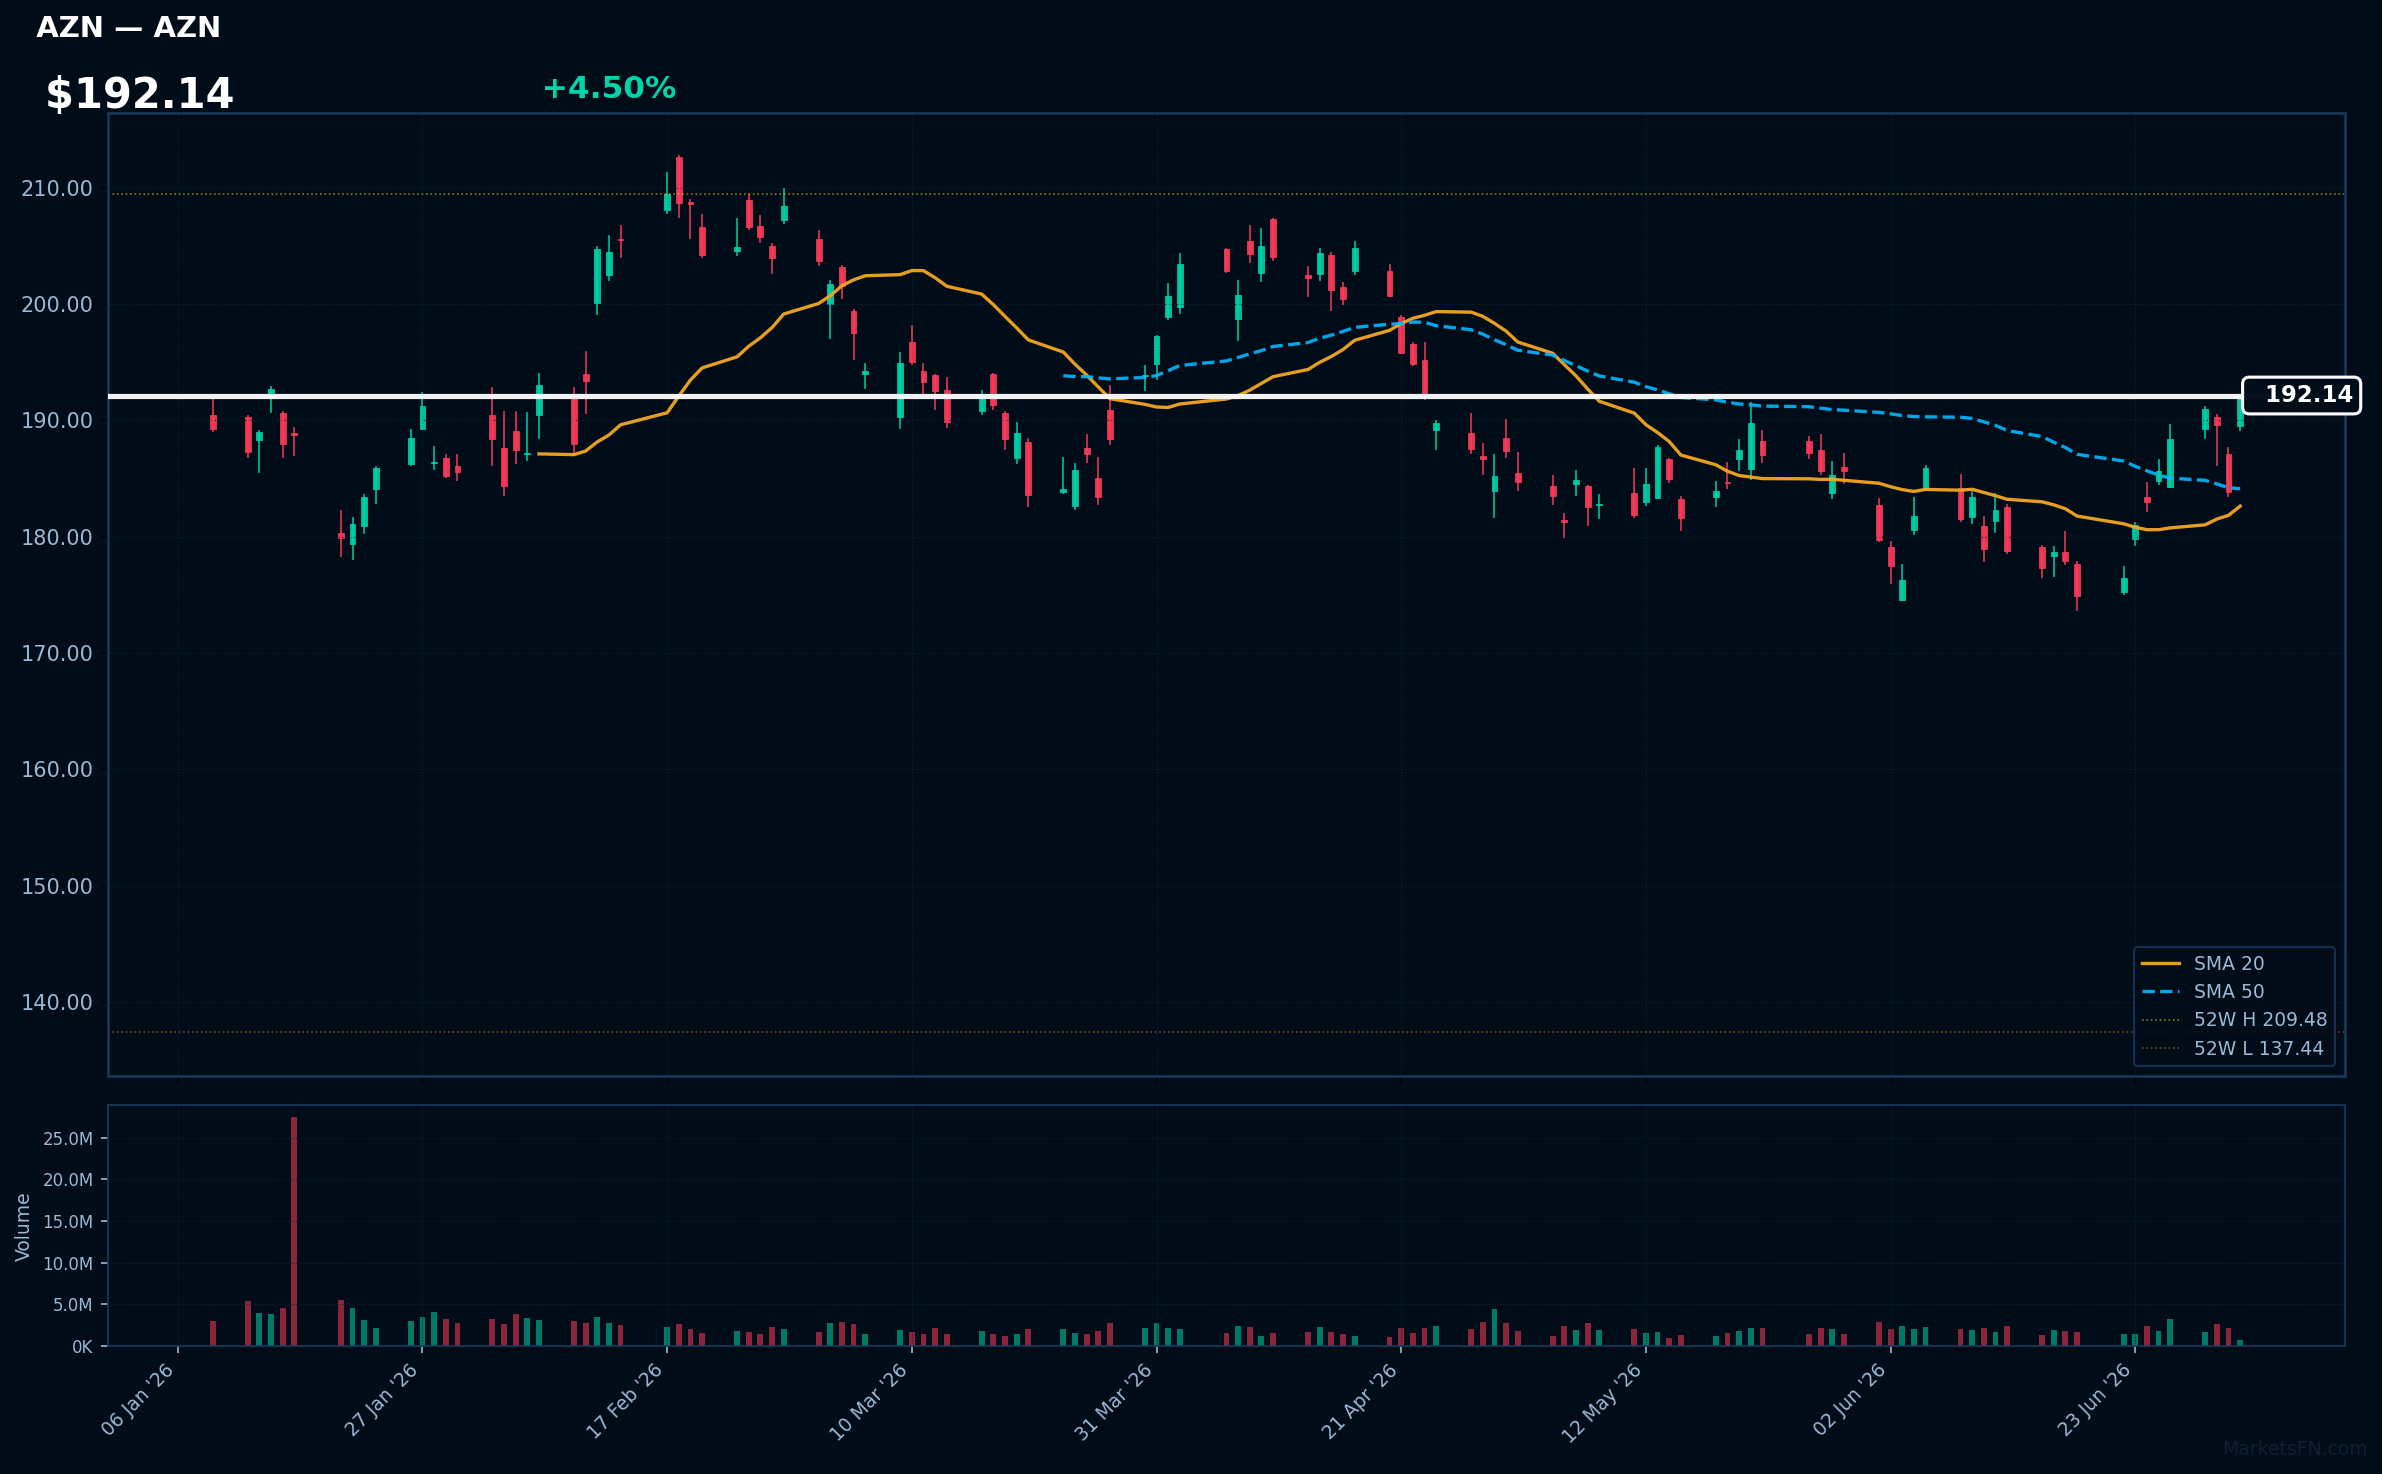
AZN | Astrazeneca plc ADR | Healthcare | Price: $192.14 | Day: +4.50% | 1W: +3.48% | 1M: +8.28% | RSI: 59.8 | vs MA200: +4.7% | Trend: Above MA20, MA50, MA200
Recent headlines (last 12h)
- FTSE 100 Live: Stocks start to rise across Europe, Currys stumbles
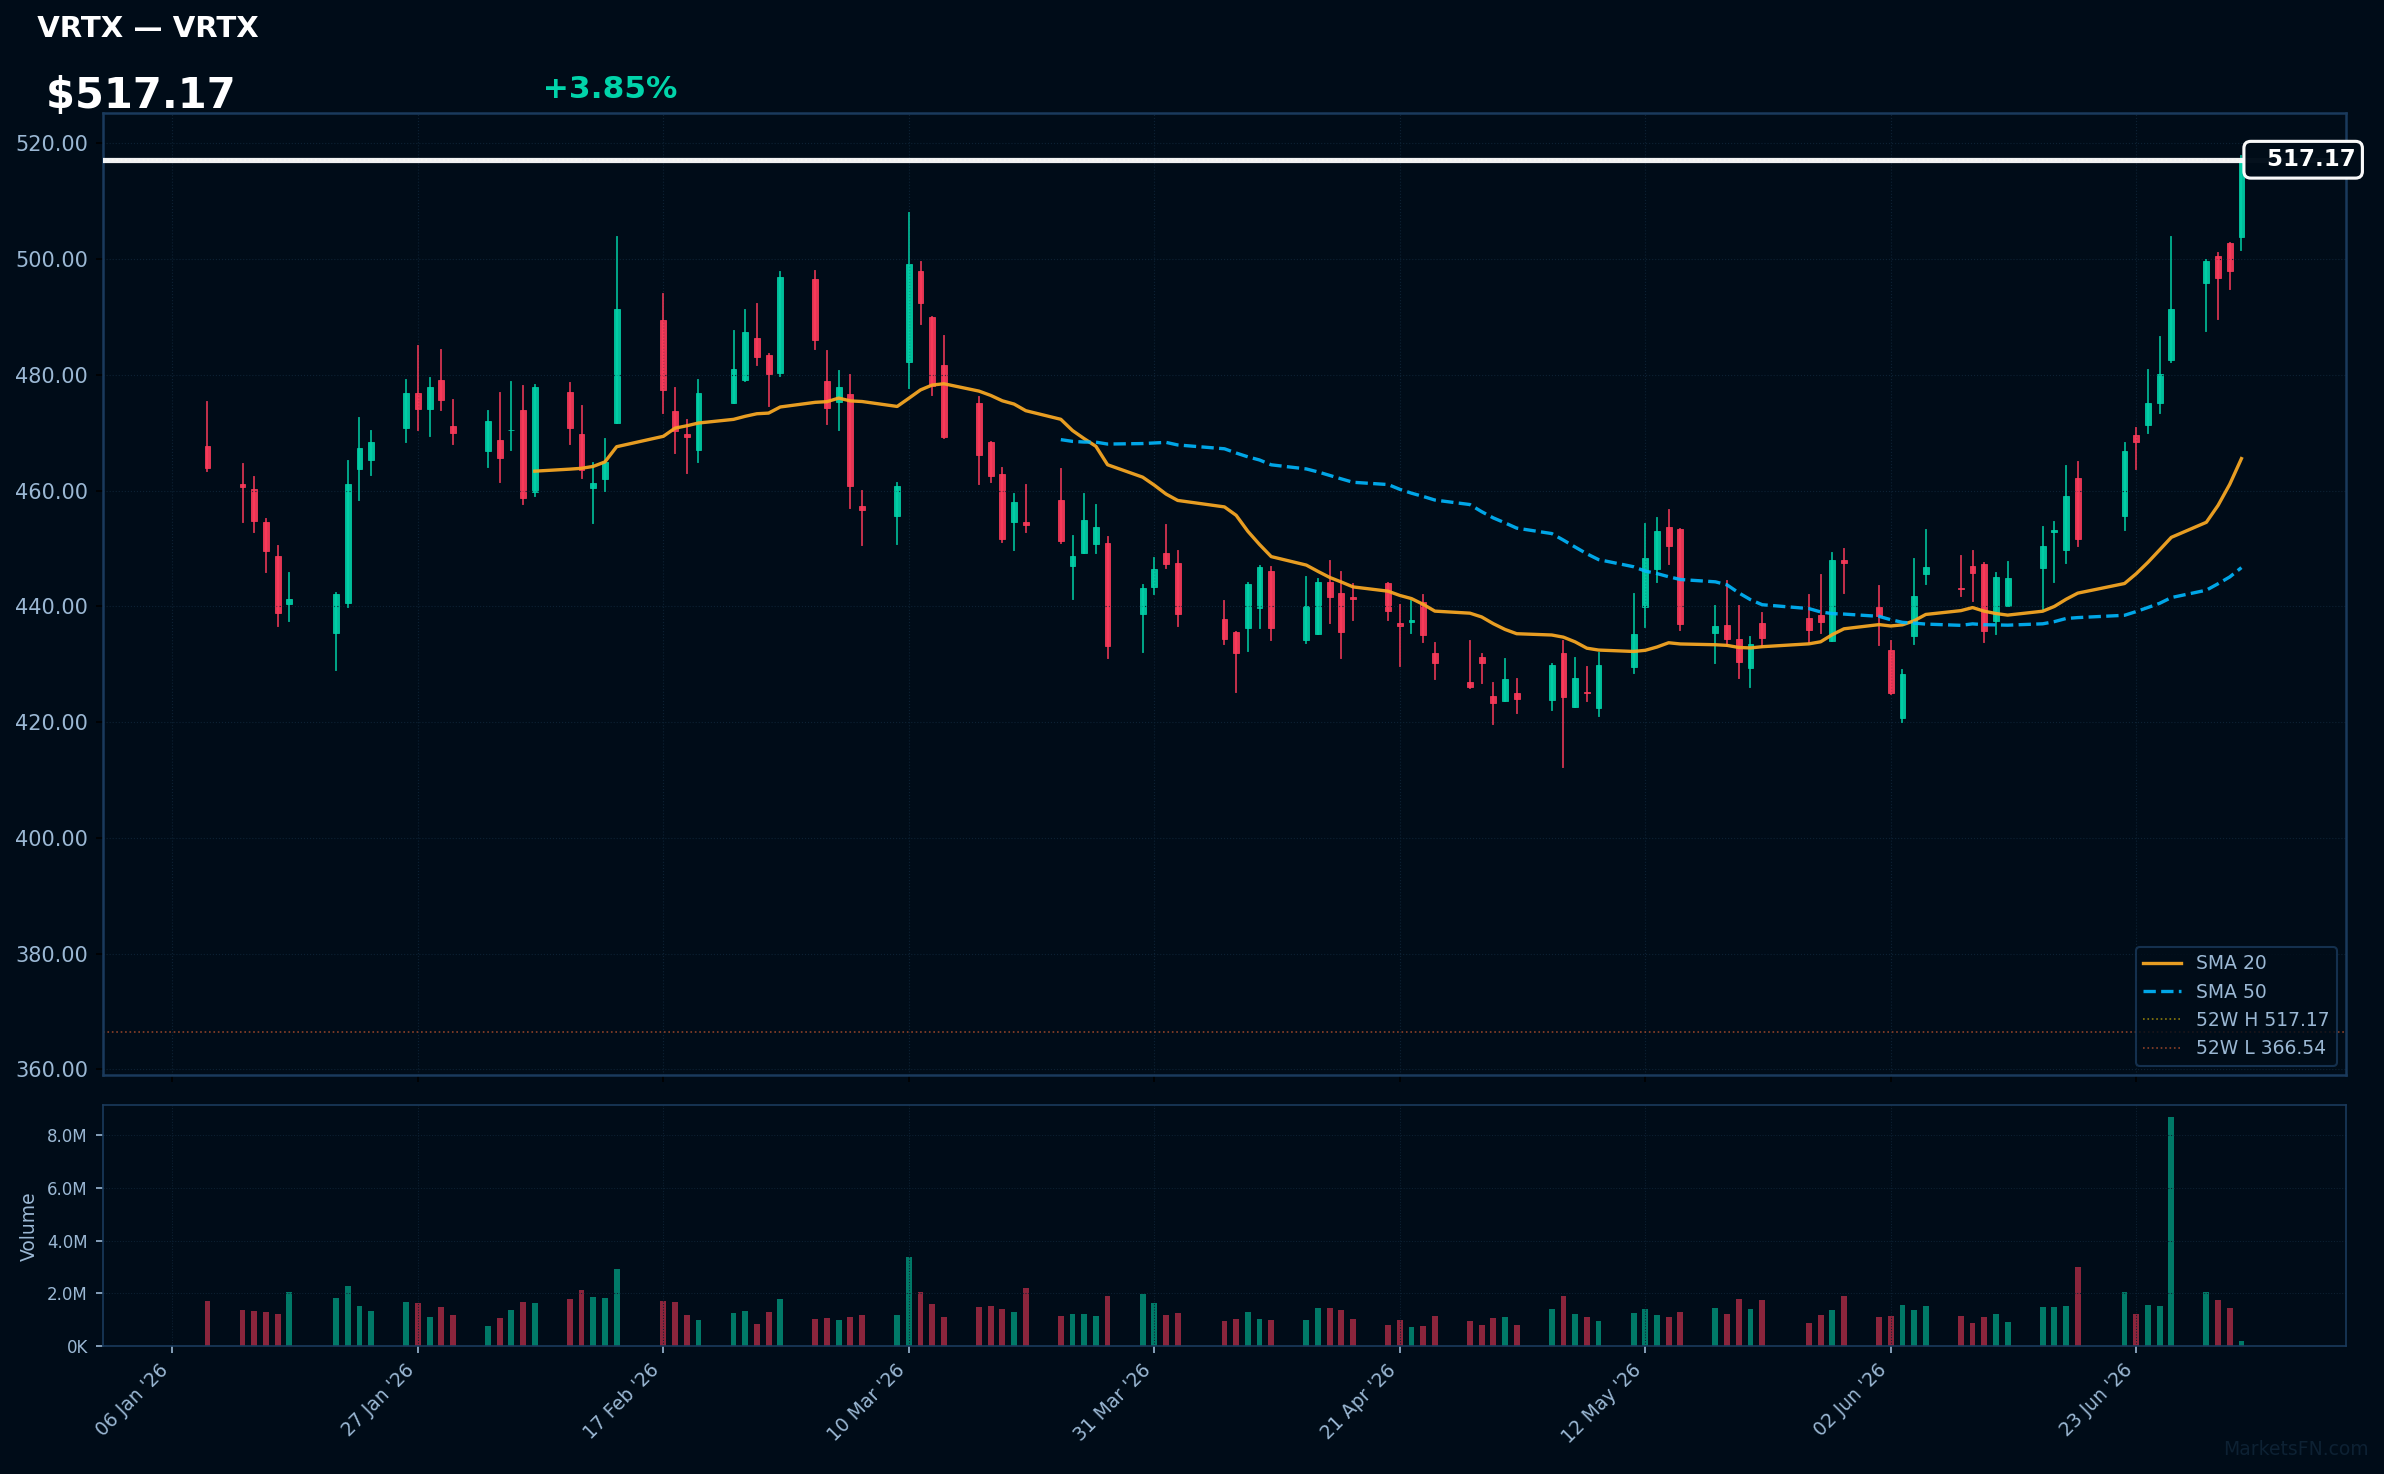
VRTX | Vertex Pharmaceuticals, Inc | Healthcare | Price: $517.17 | Day: +3.85% | 1W: +7.70% | 1M: +21.66% | RSI: 78.9 | vs MA200: +16.5% | Trend: Above MA20, MA50, MA200
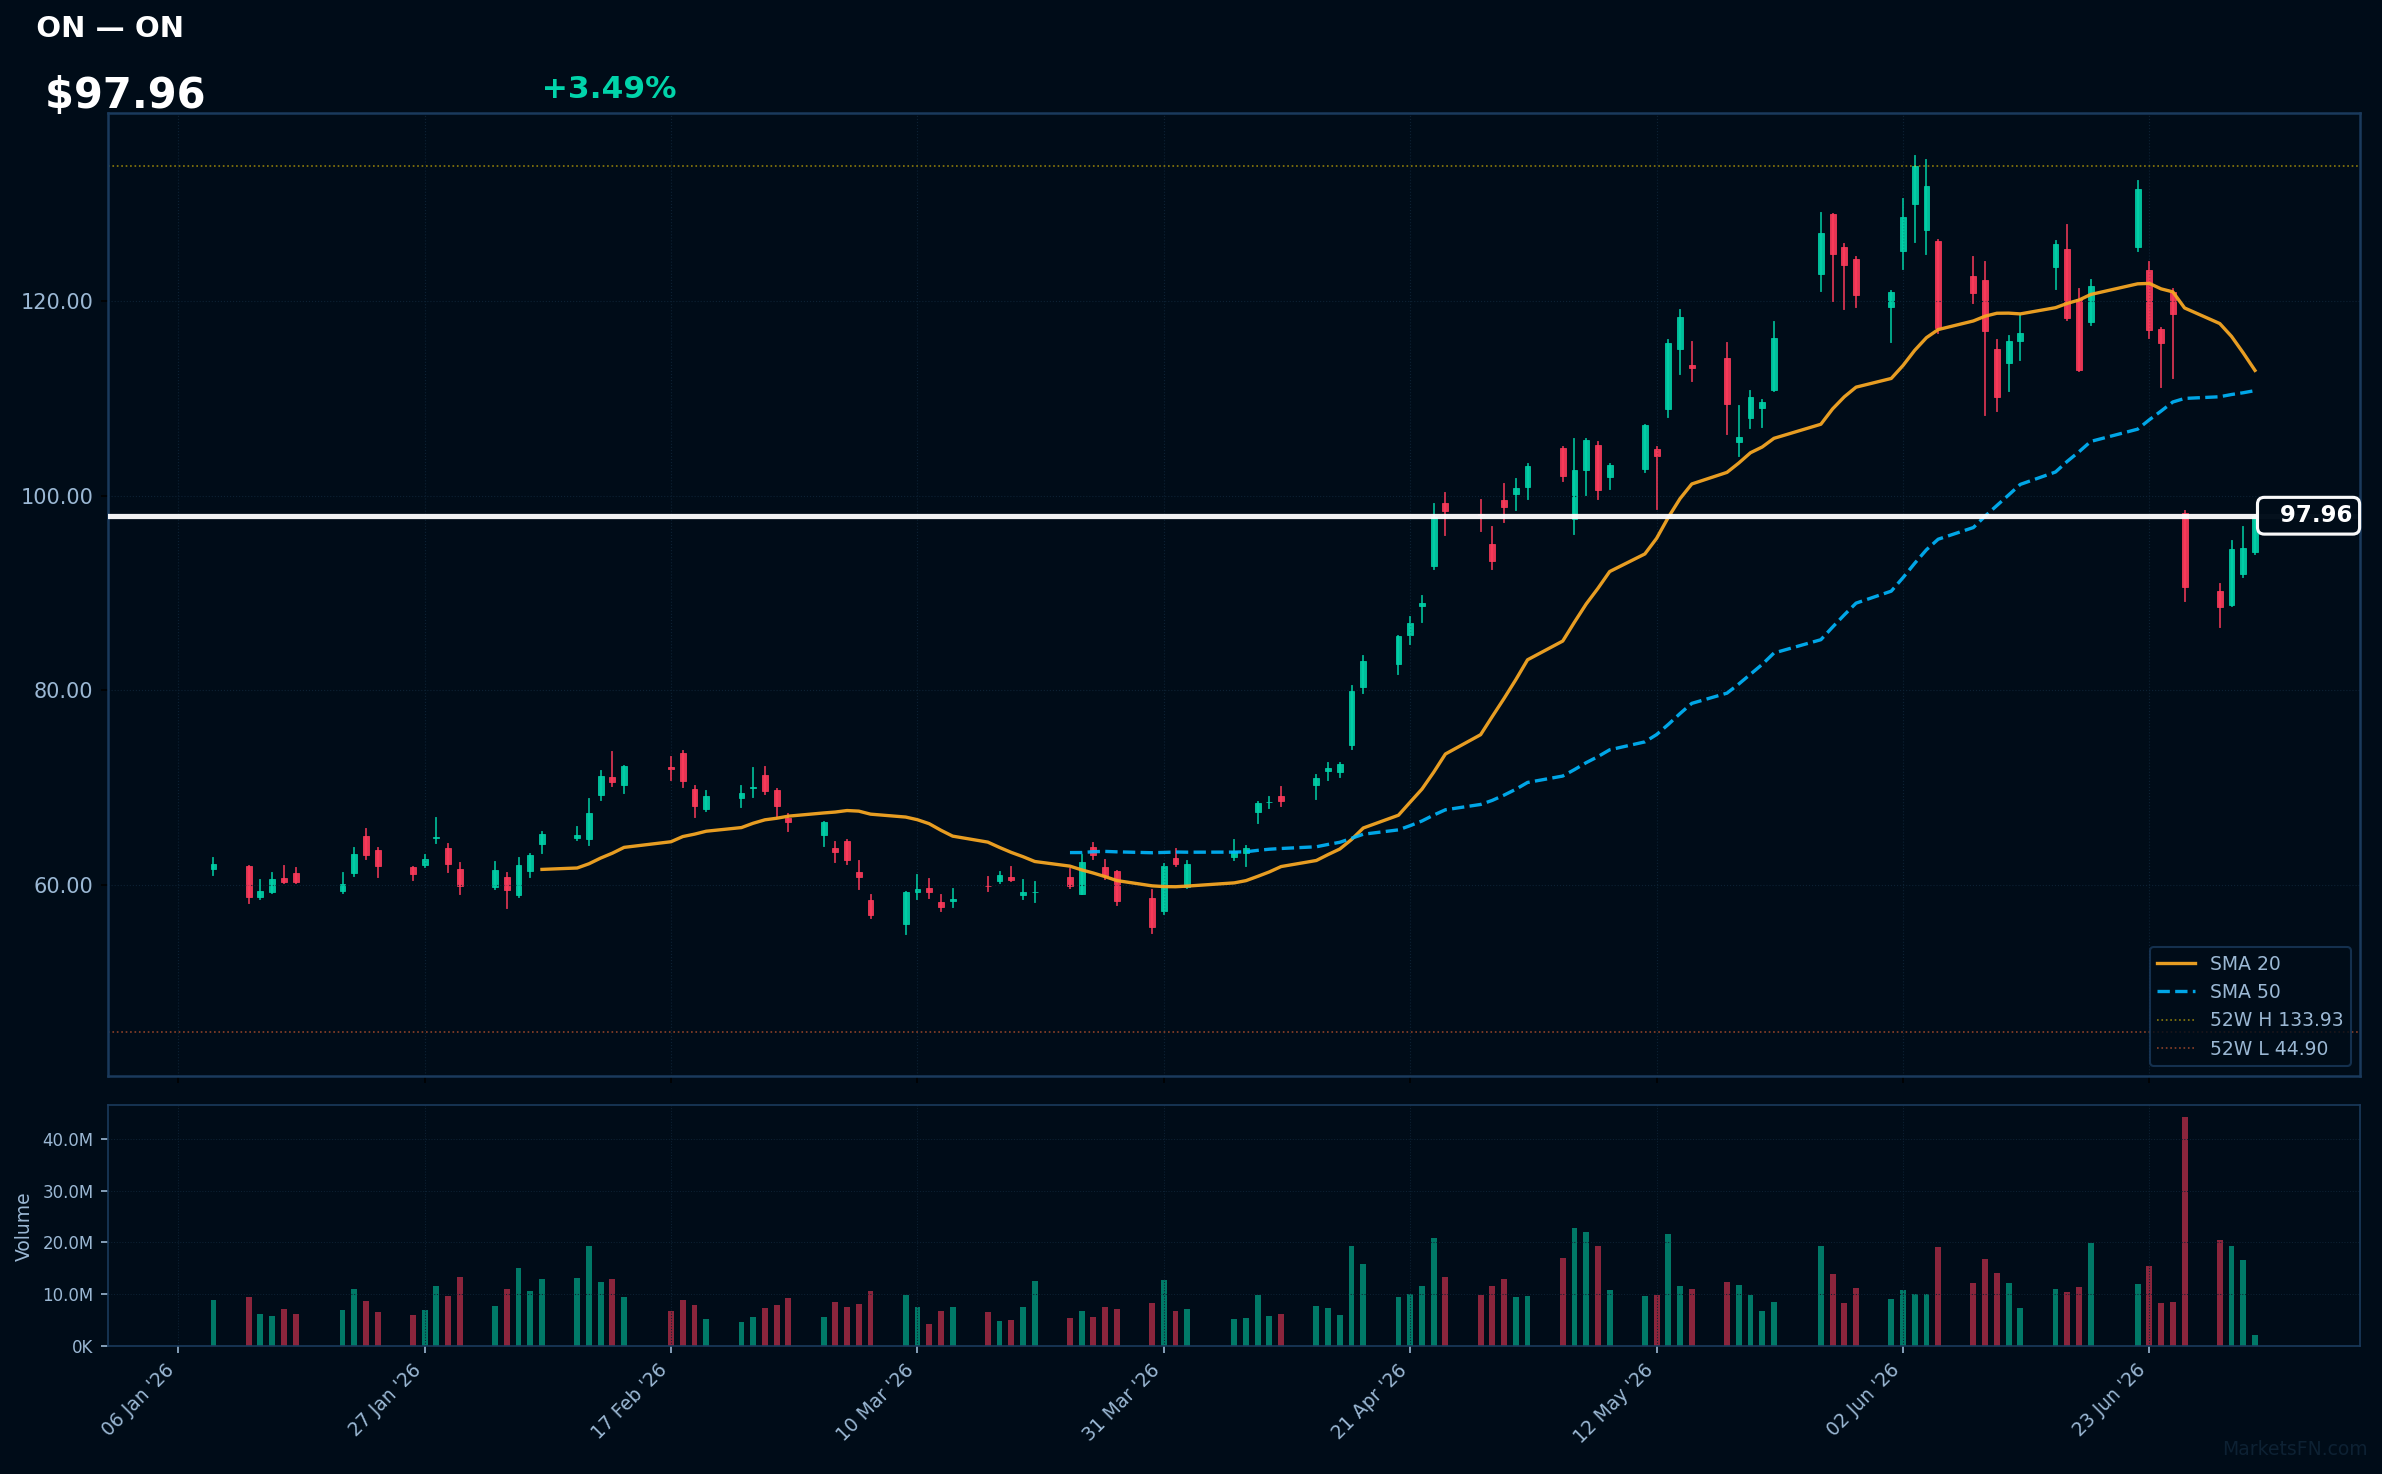
ON | ON Semiconductor Corp | Technology | Price: $97.93 | Day: +3.49% | 1W: -17.50% | 1M: -23.85% | RSI: 42.8 | vs MA200: +37.8% | Trend: Above MA200 · Below MA20, MA50
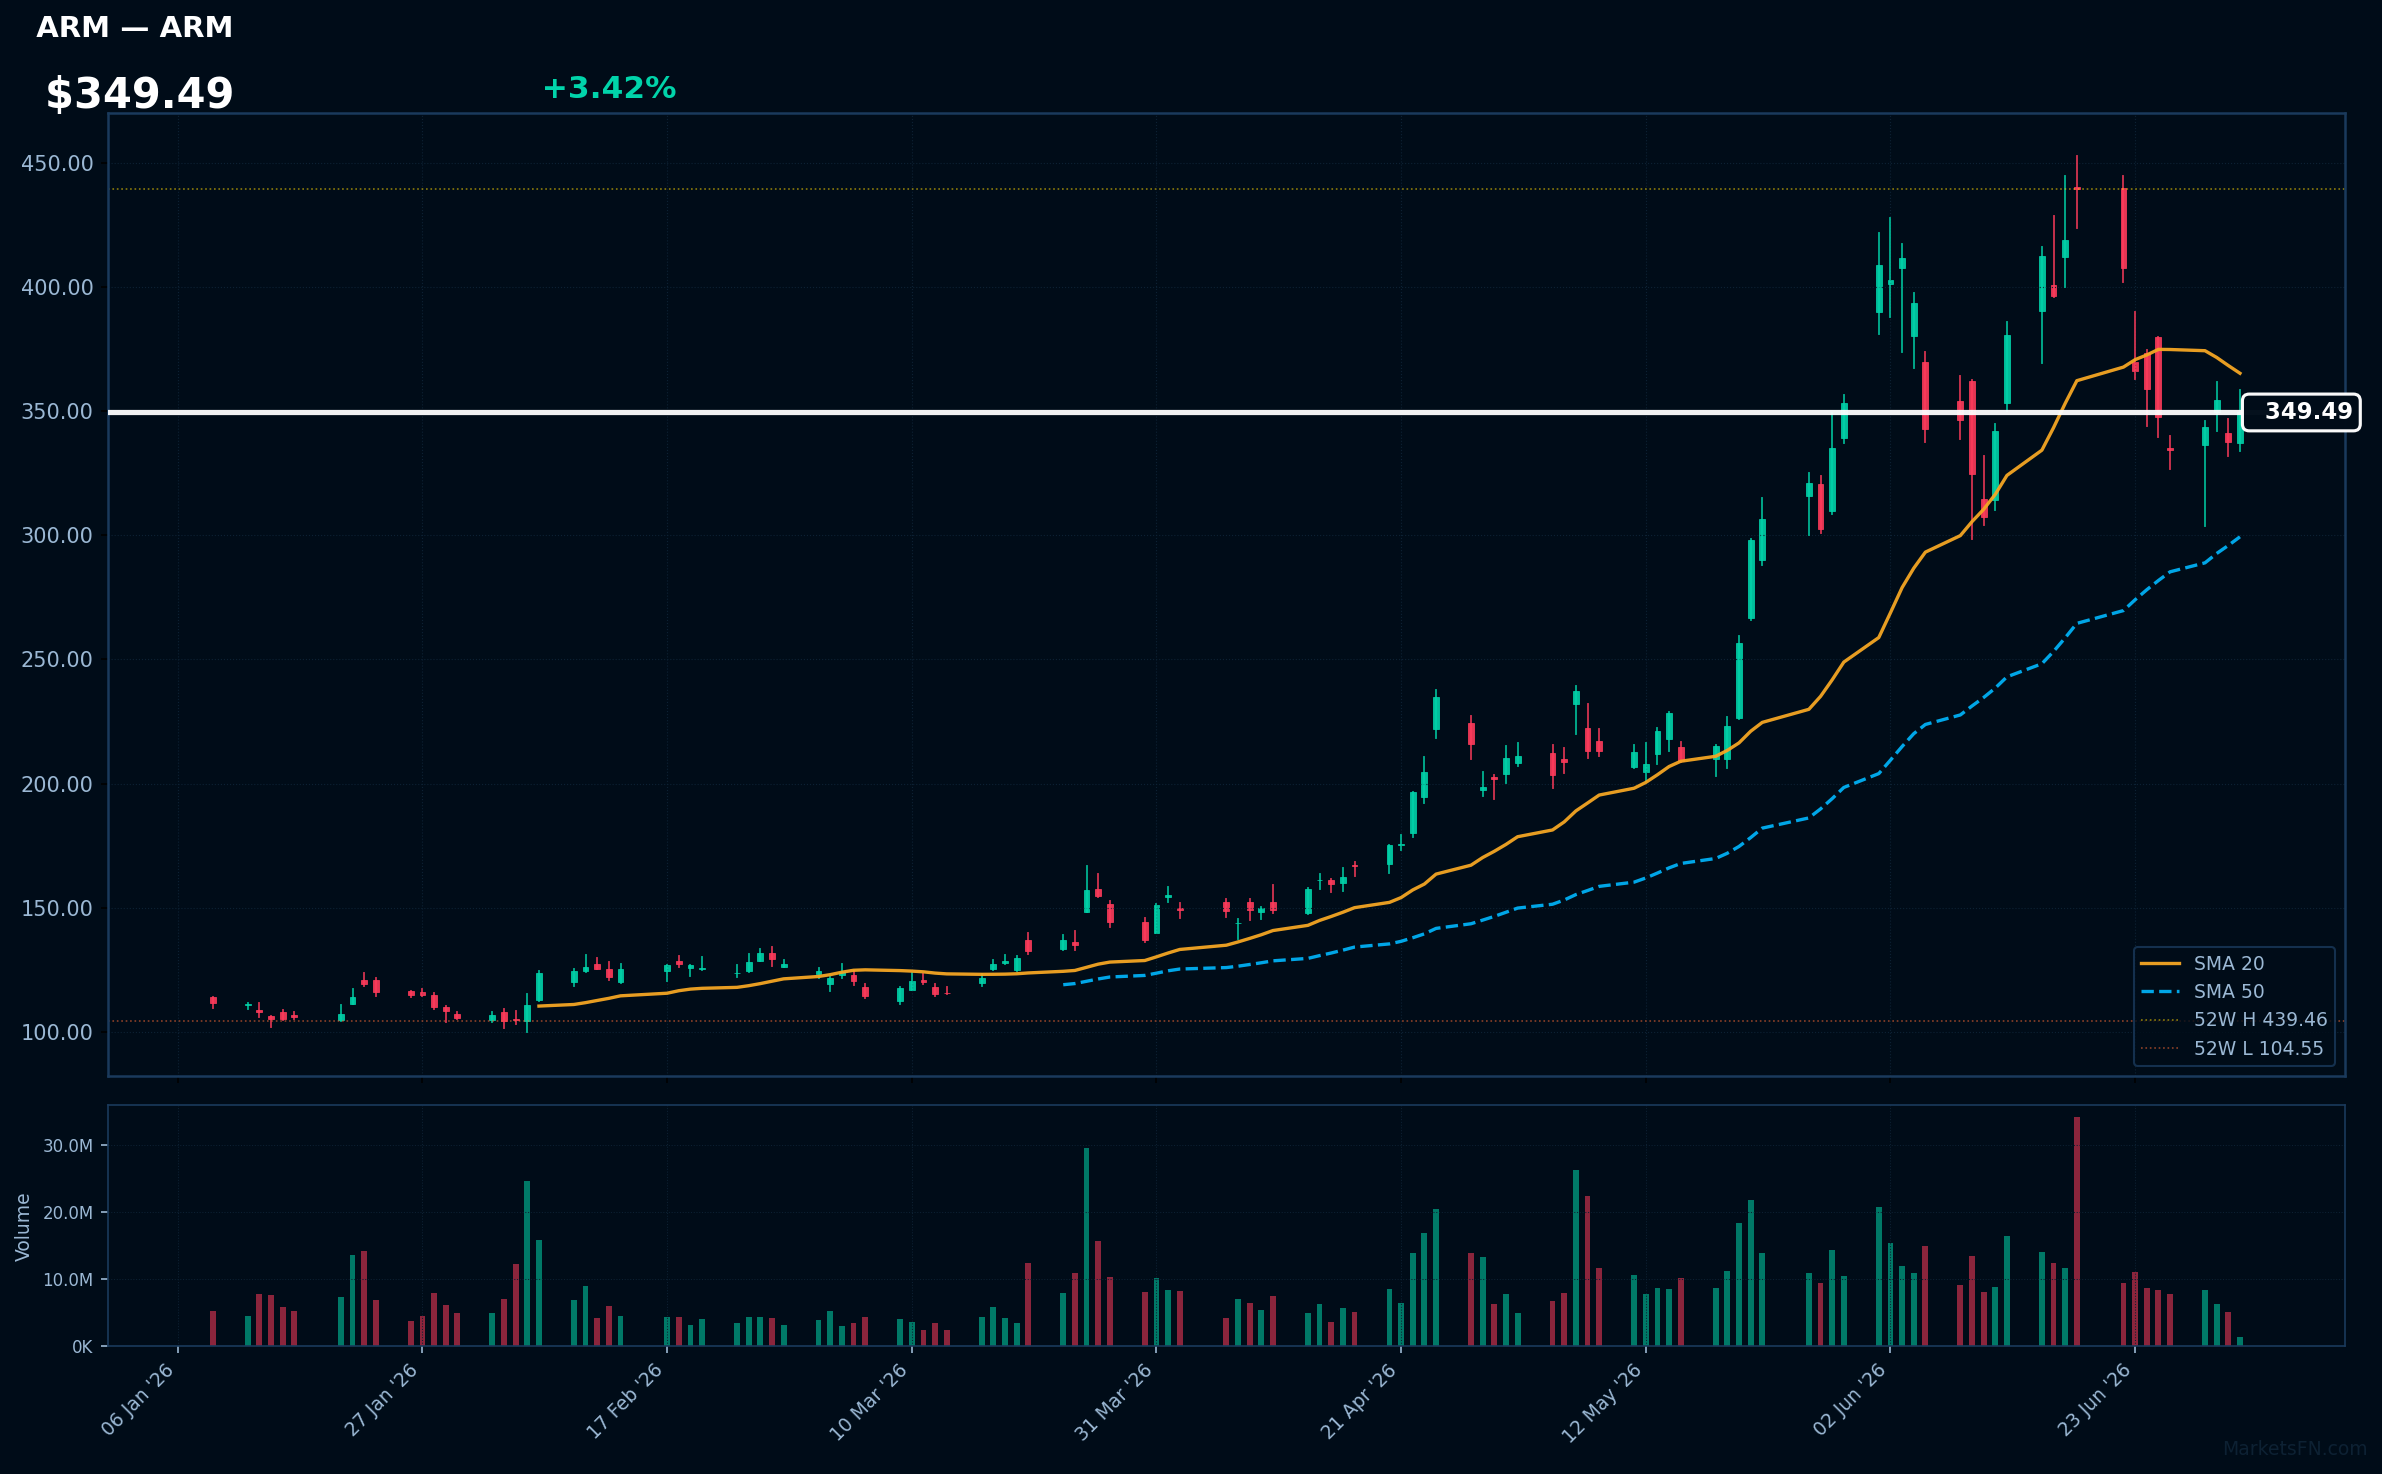
ARM | Arm Holdings plc. ADR | Technology | Price: $349.01 | Day: +3.42% | 1W: +0.51% | 1M: -13.21% | RSI: 51.2 | vs MA200: +96.8% | Trend: Above MA50, MA200 · Below MA20
Recent headlines (last 12h)
- Why Electricity Has Become the World's Most Strategic Asset
- Semiconductor stocks retreat, and other early market movers
- Stock Market Today: Dow, S&P 500 and Nasdaq set to fall as investors await jobs report amid chip selloff
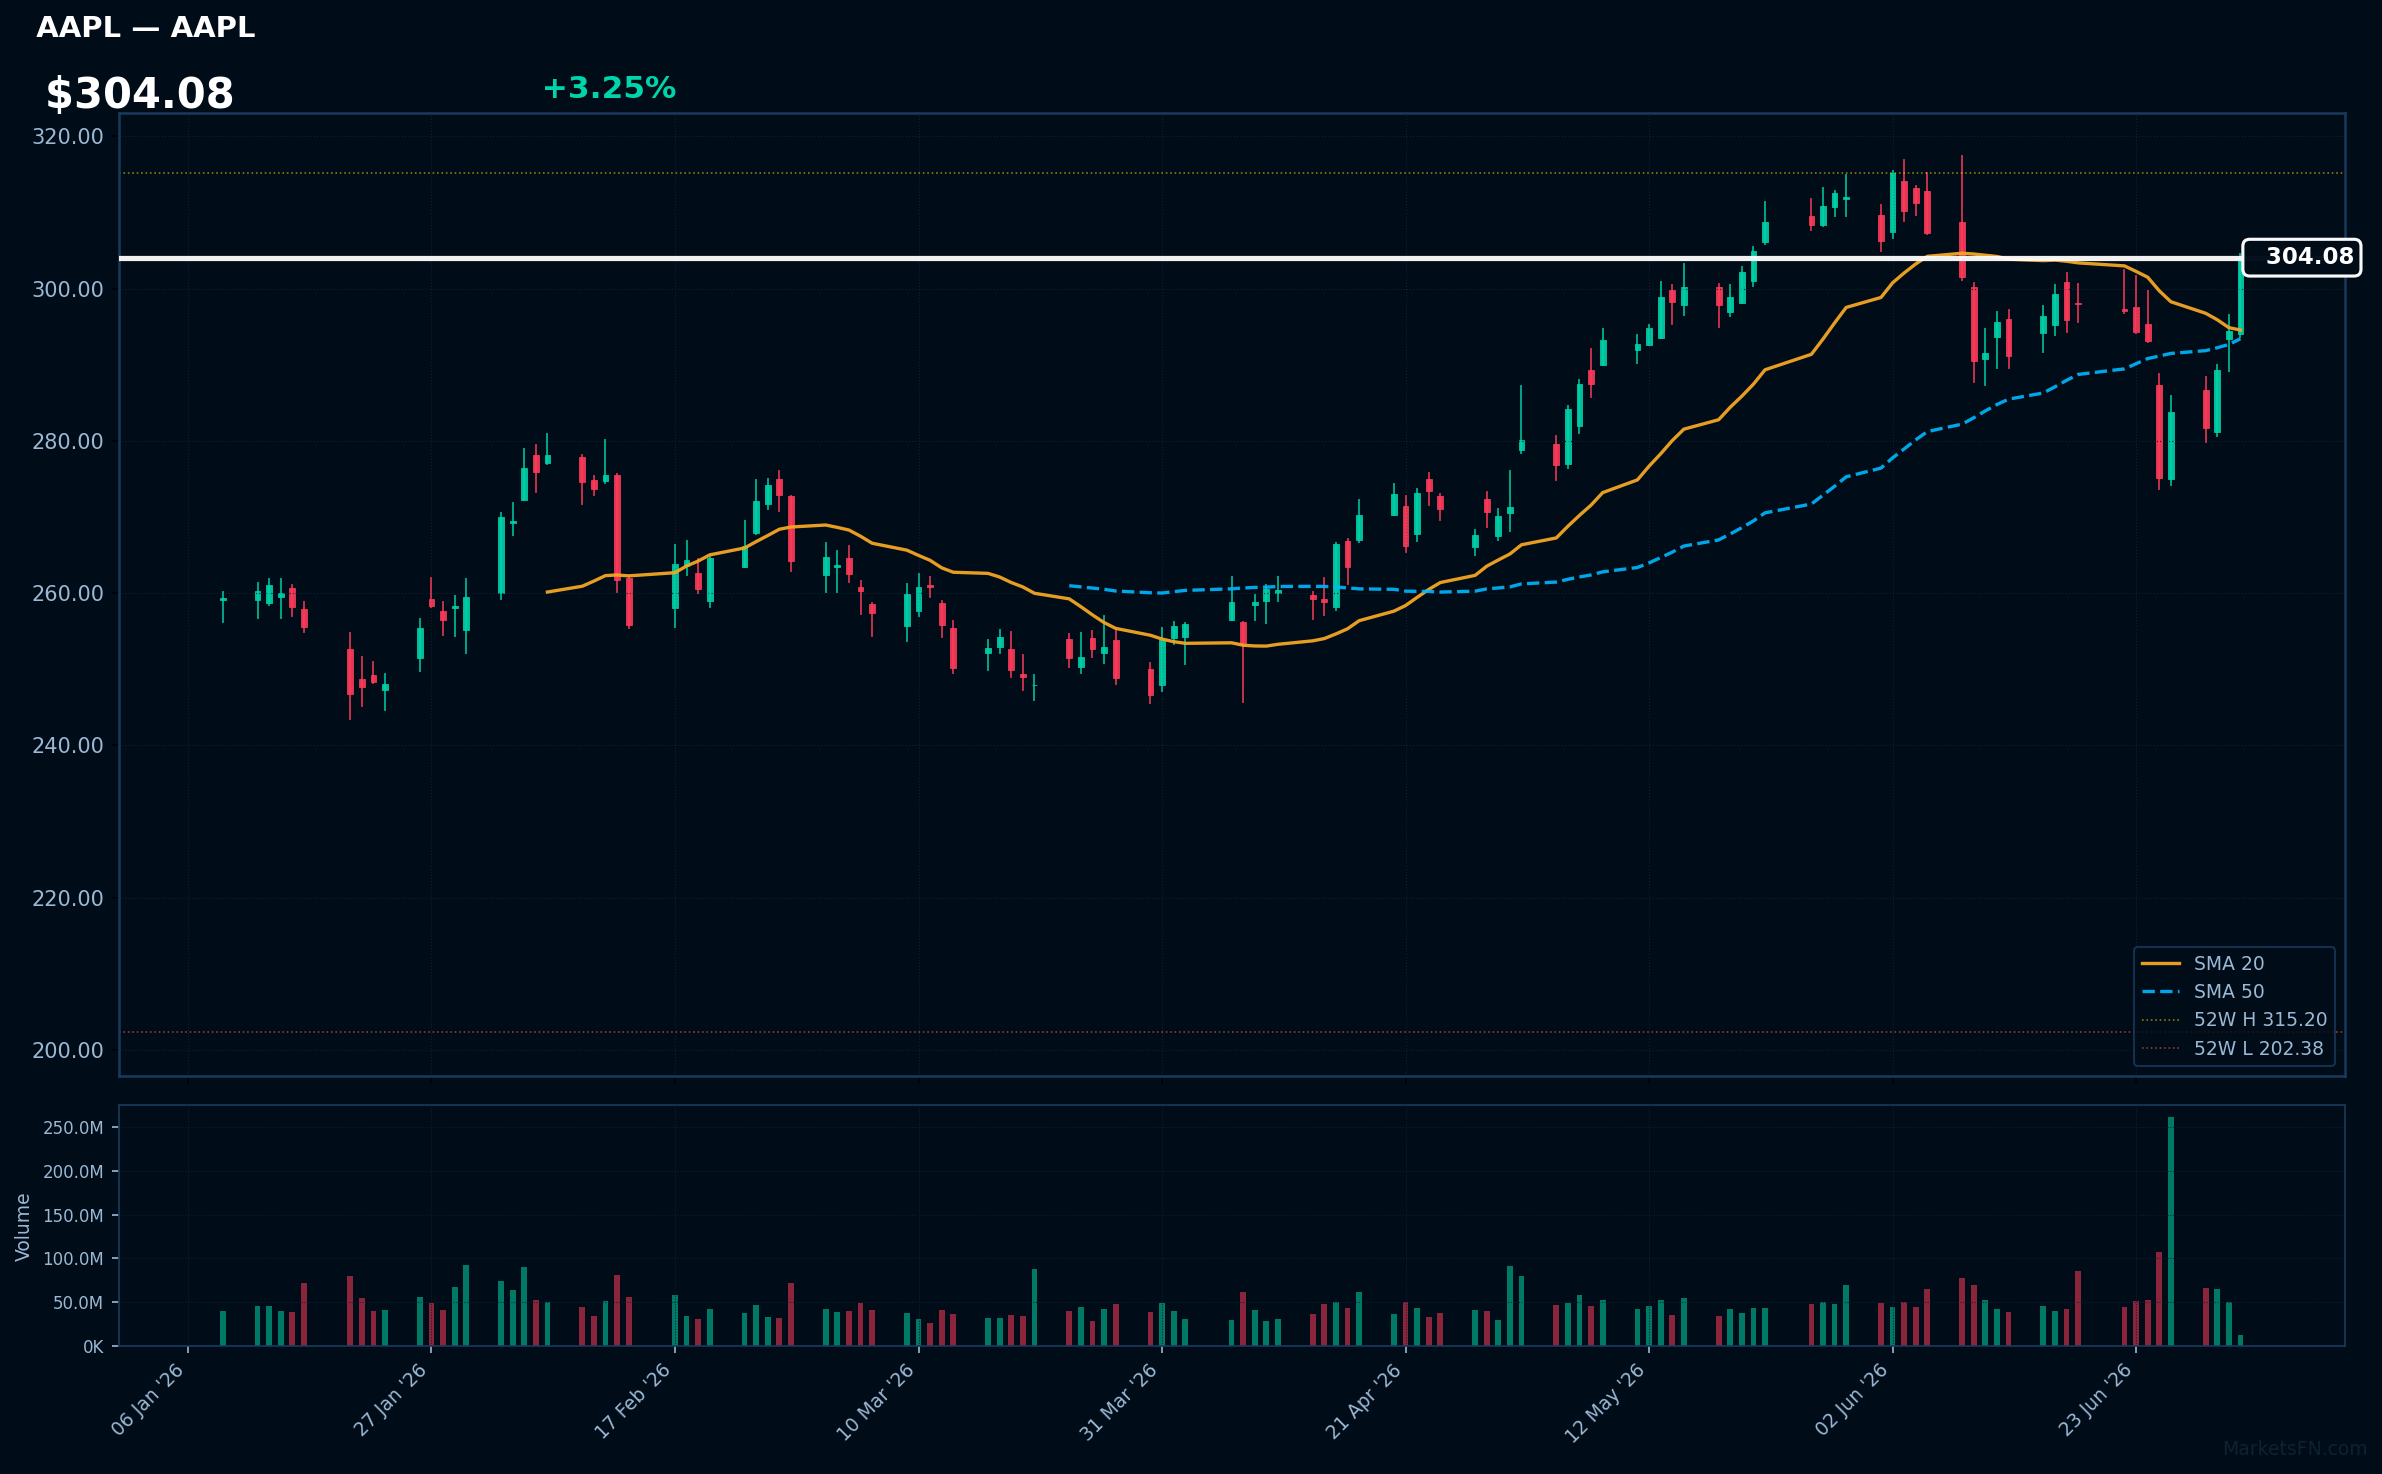
AAPL | Apple Inc | Technology | Price: $303.95 | Day: +3.25% | 1W: +10.51% | 1M: -3.53% | RSI: 57.7 | vs MA200: +12.3% | Trend: Above MA20, MA50, MA200
Recent headlines (last 12h)
- Apple Eyes 10 Million Foldable iPhones in Major Expansion Move
- Apple Intelligence is not driving iPhone upgrade activity: UBS
- iPhone demand splits as US and Europe pick up but China slips, survey finds
- Top EU court dismisses Google appeal of $4.5 billion antitrust fine
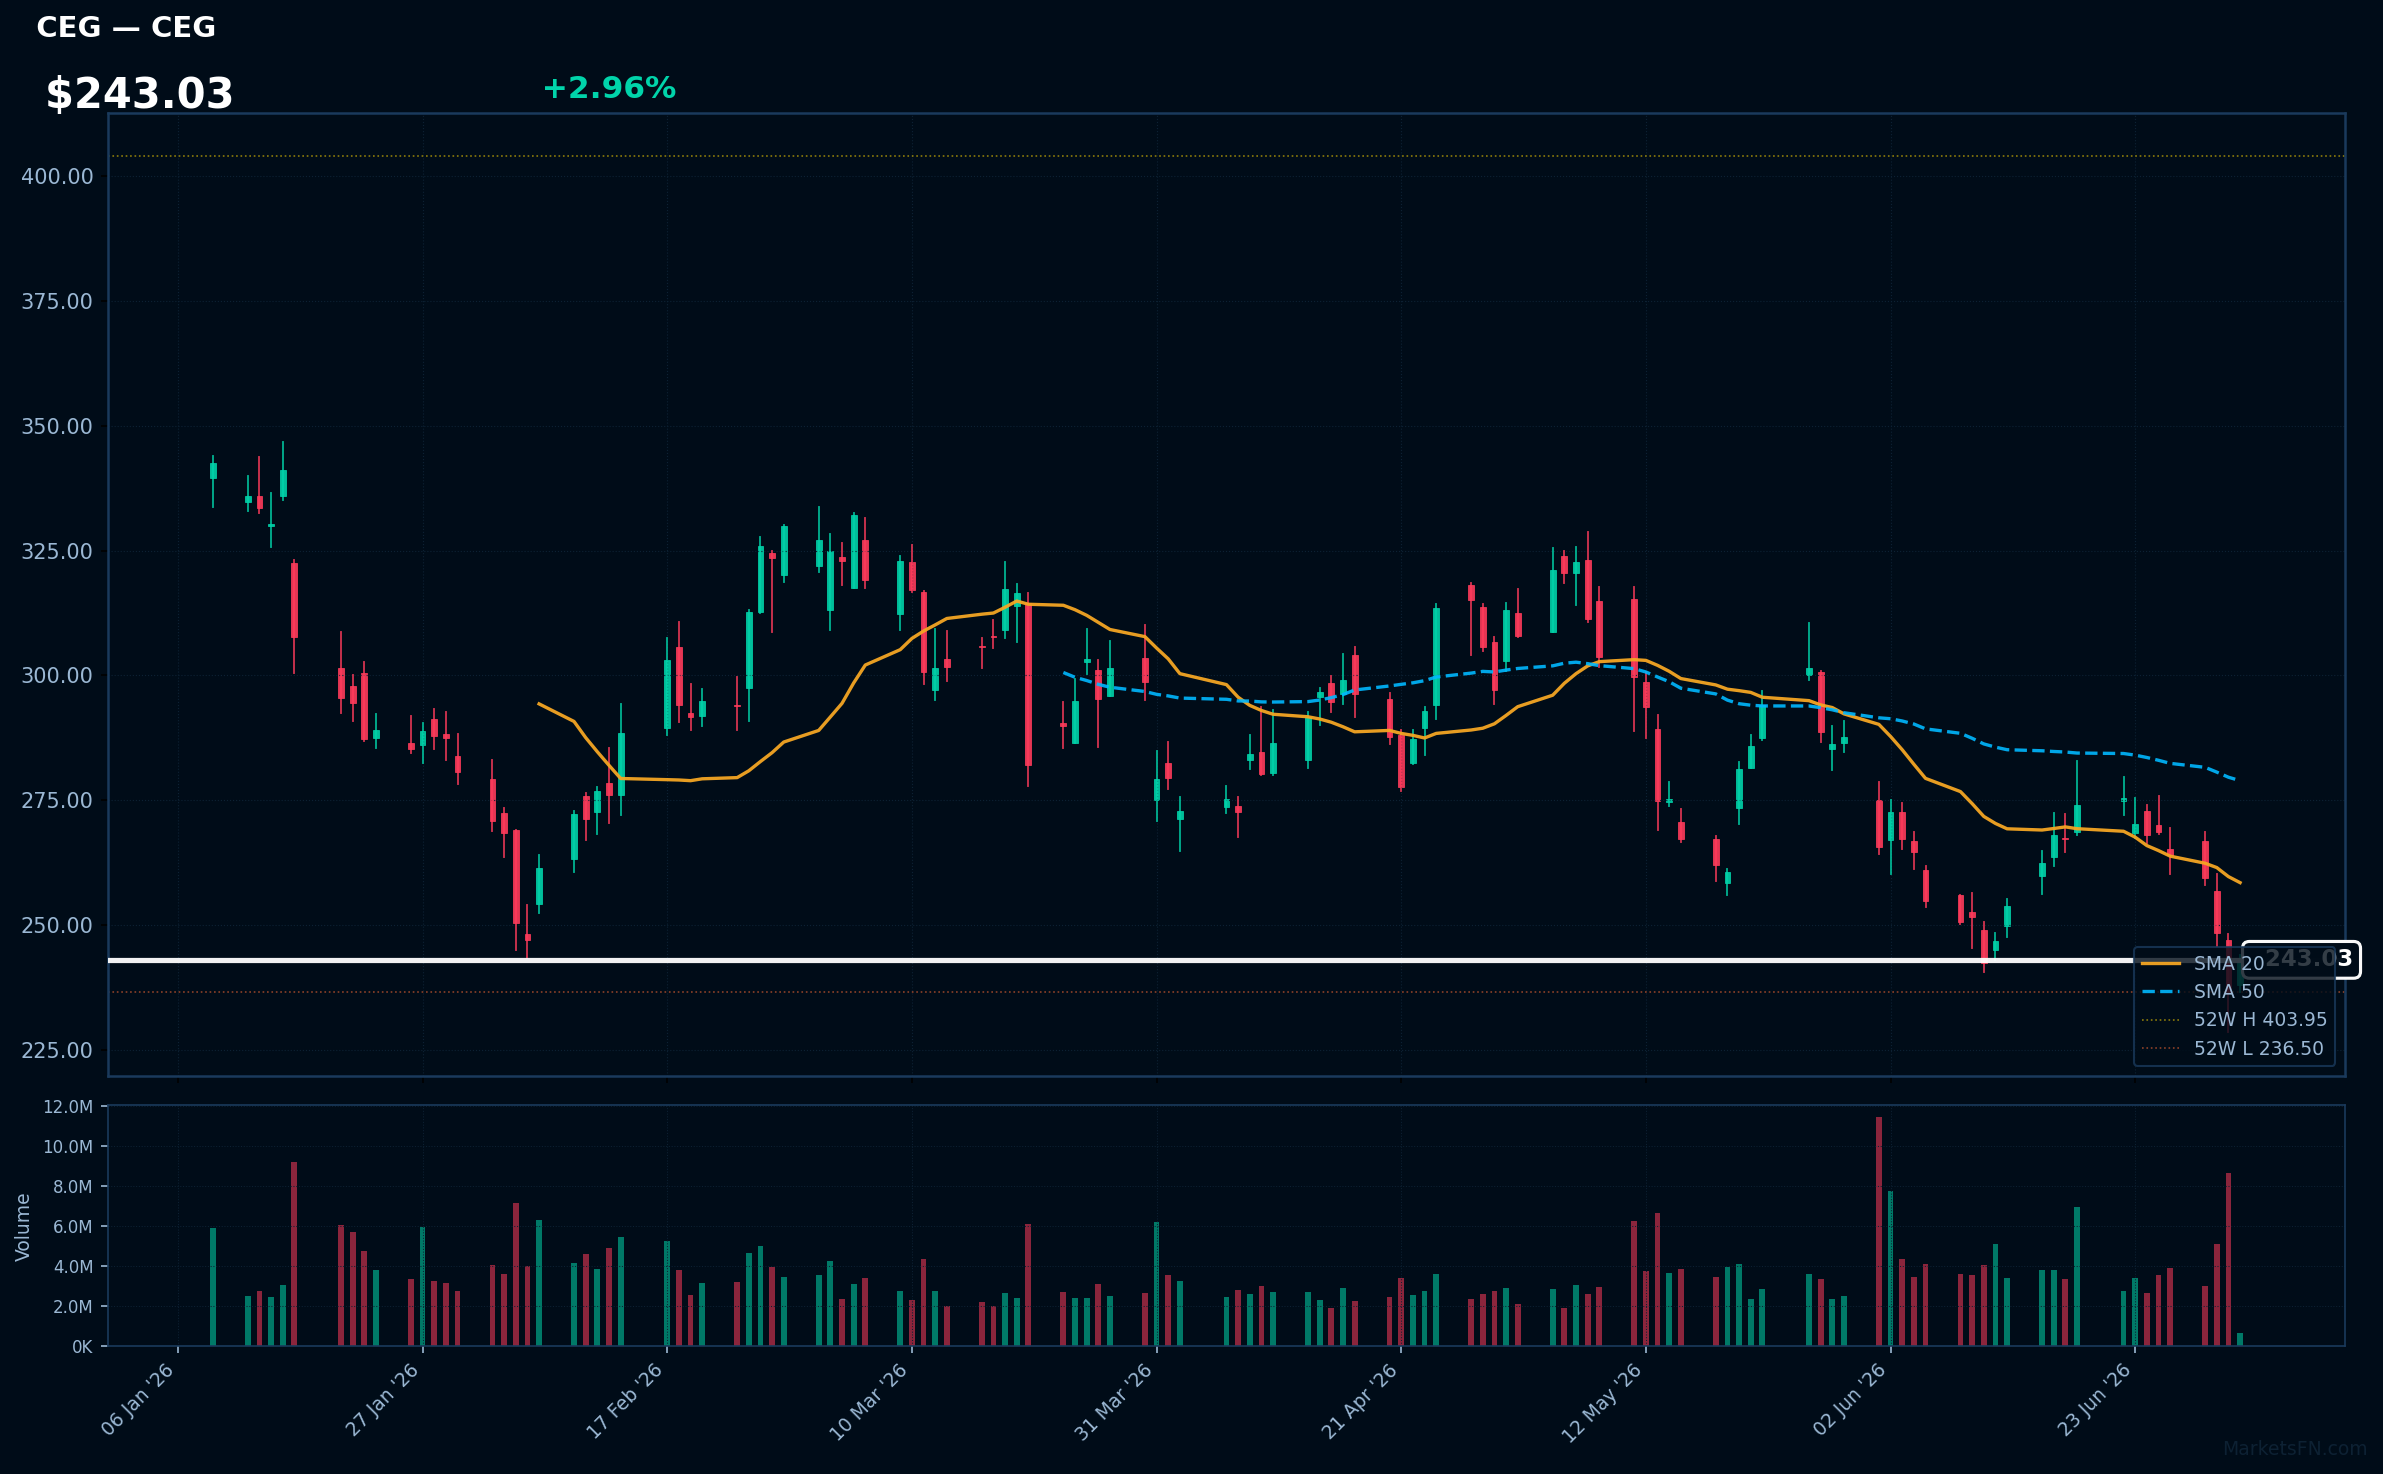
CEG | Constellation Energy Corporation | Utilities | Price: $243.50 | Day: +2.96% | 1W: -9.55% | 1M: -10.86% | RSI: 36.9 | vs MA200: -23.2% | Trend: Below MA20, MA50, MA200
Recent headlines (last 12h)
- CEG Stock Takes A Hit After Citi's Price-Target Cut But Retail Is Already Diving In To Buy The Dip
- Why Did KR, CEG, SSTK Stocks Tumble To 52-Week Lows Today?
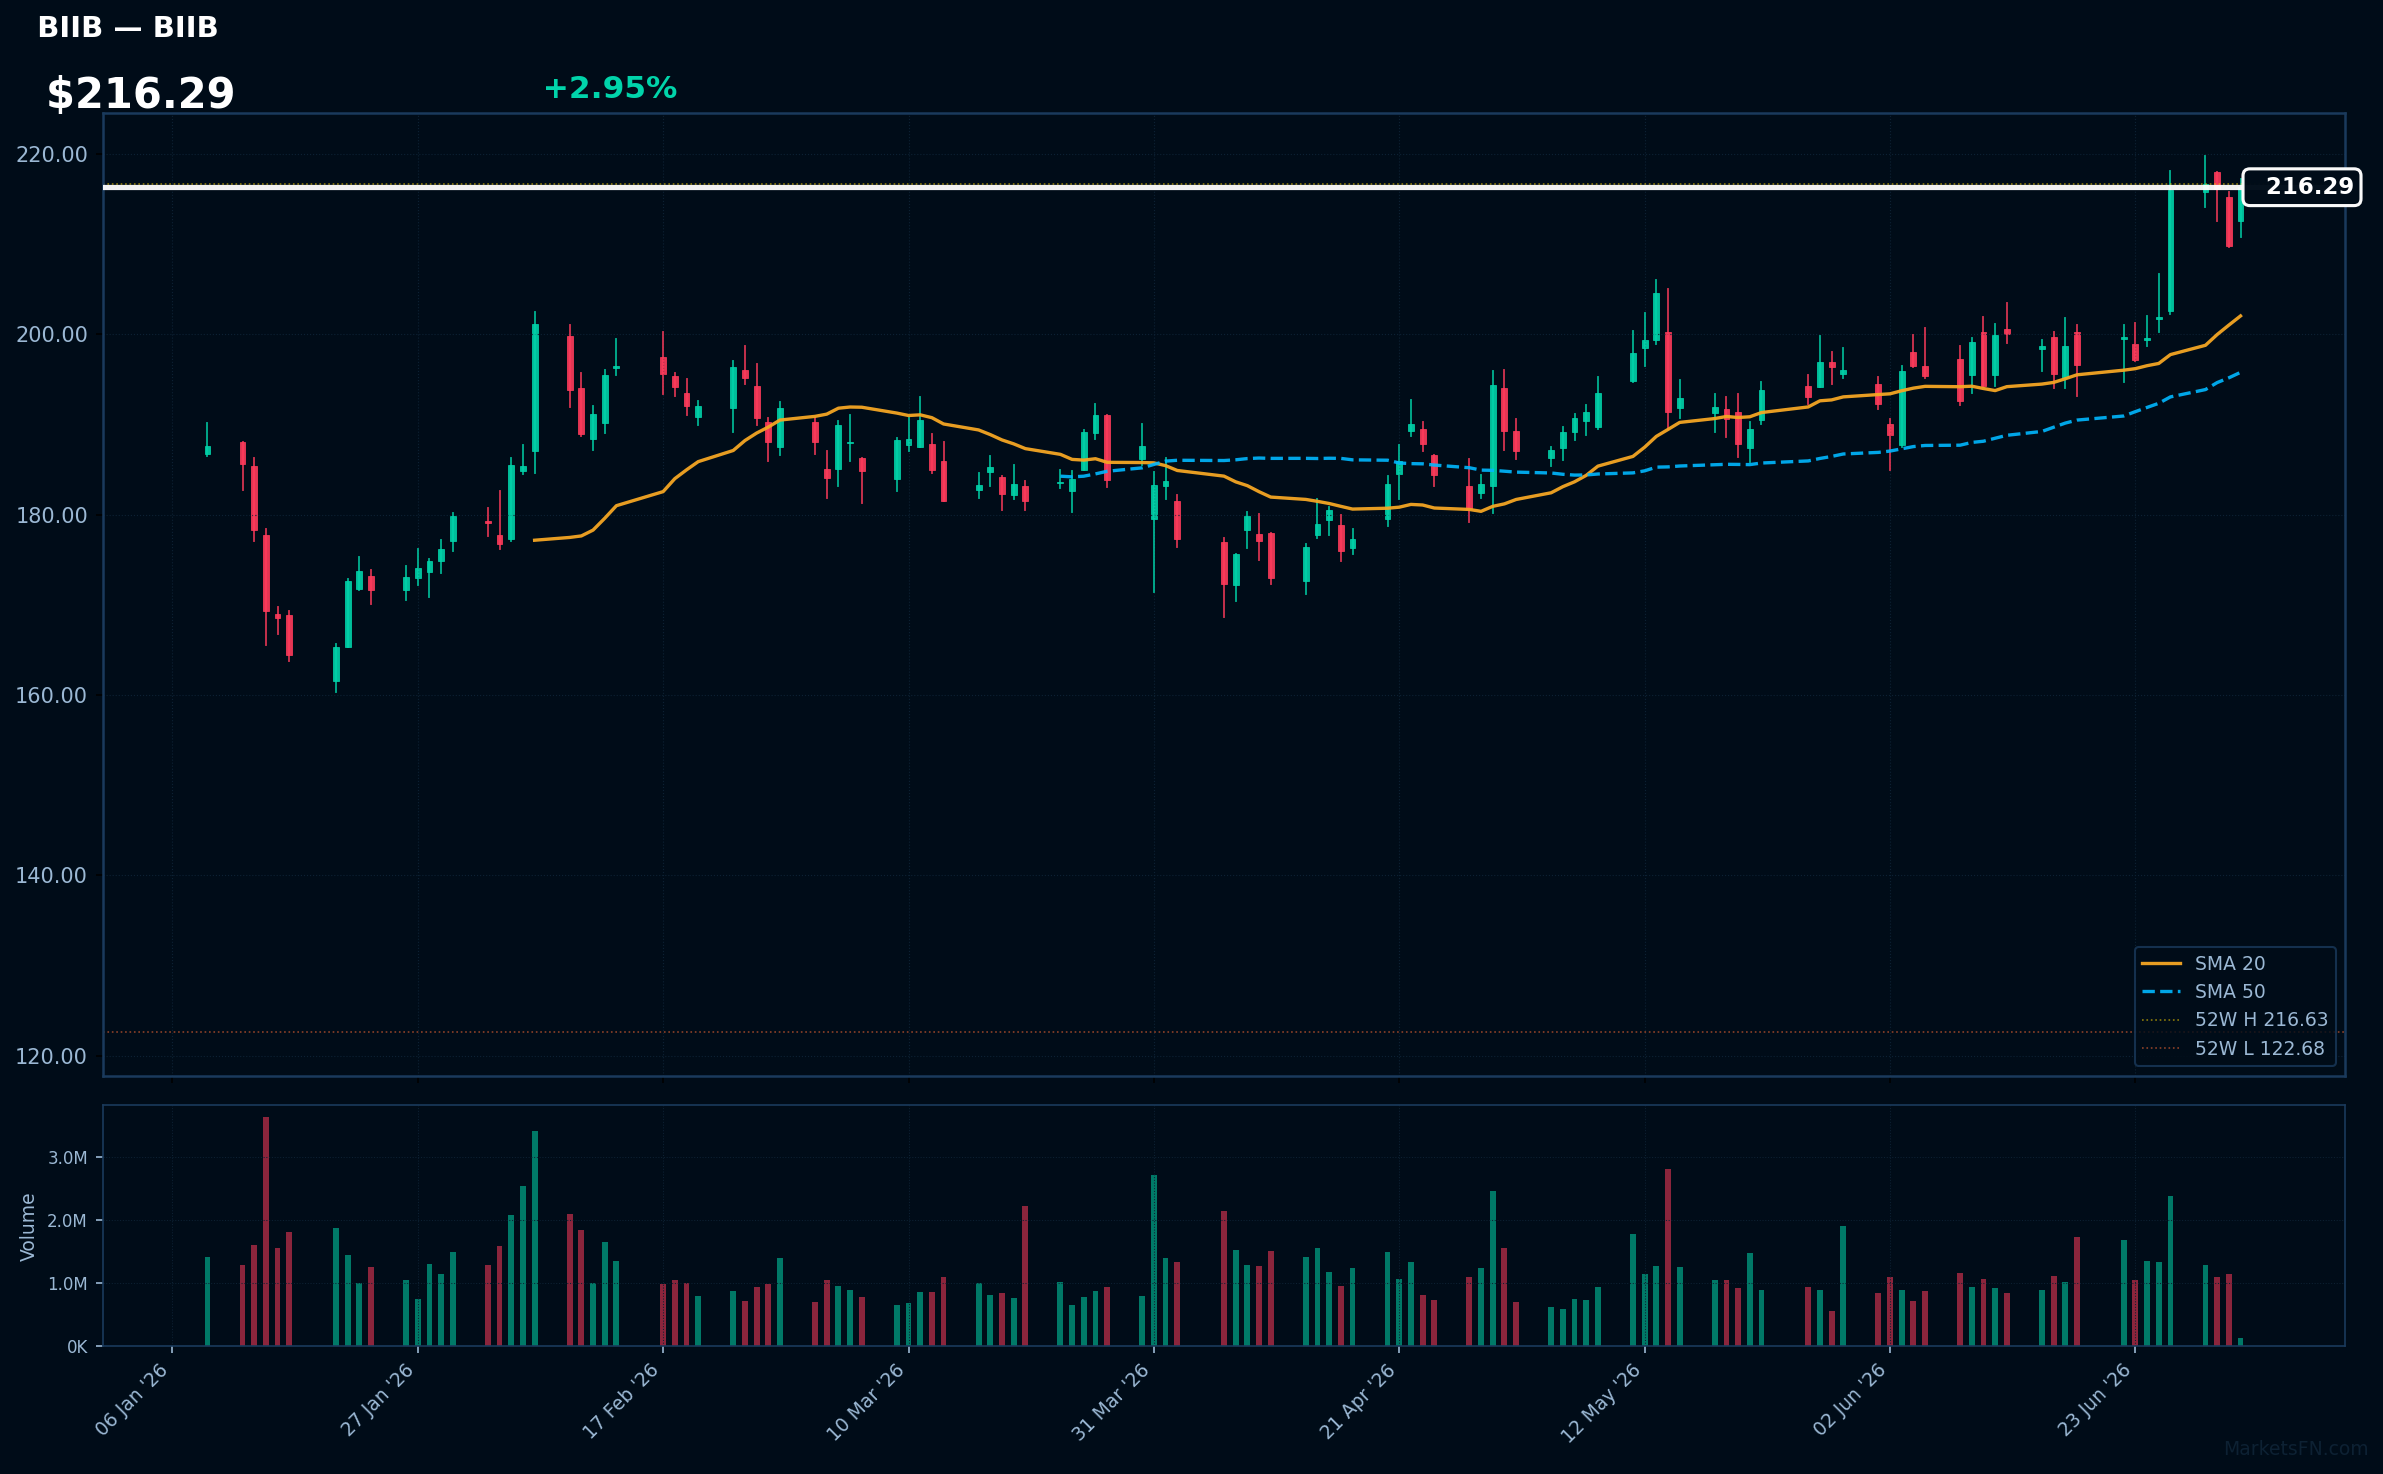
BIIB | Biogen Inc | Healthcare | Price: $215.93 | Day: +2.95% | 1W: +7.10% | 1M: +14.54% | RSI: 65.1 | vs MA200: +21.6% | Trend: Above MA20, MA50, MA200
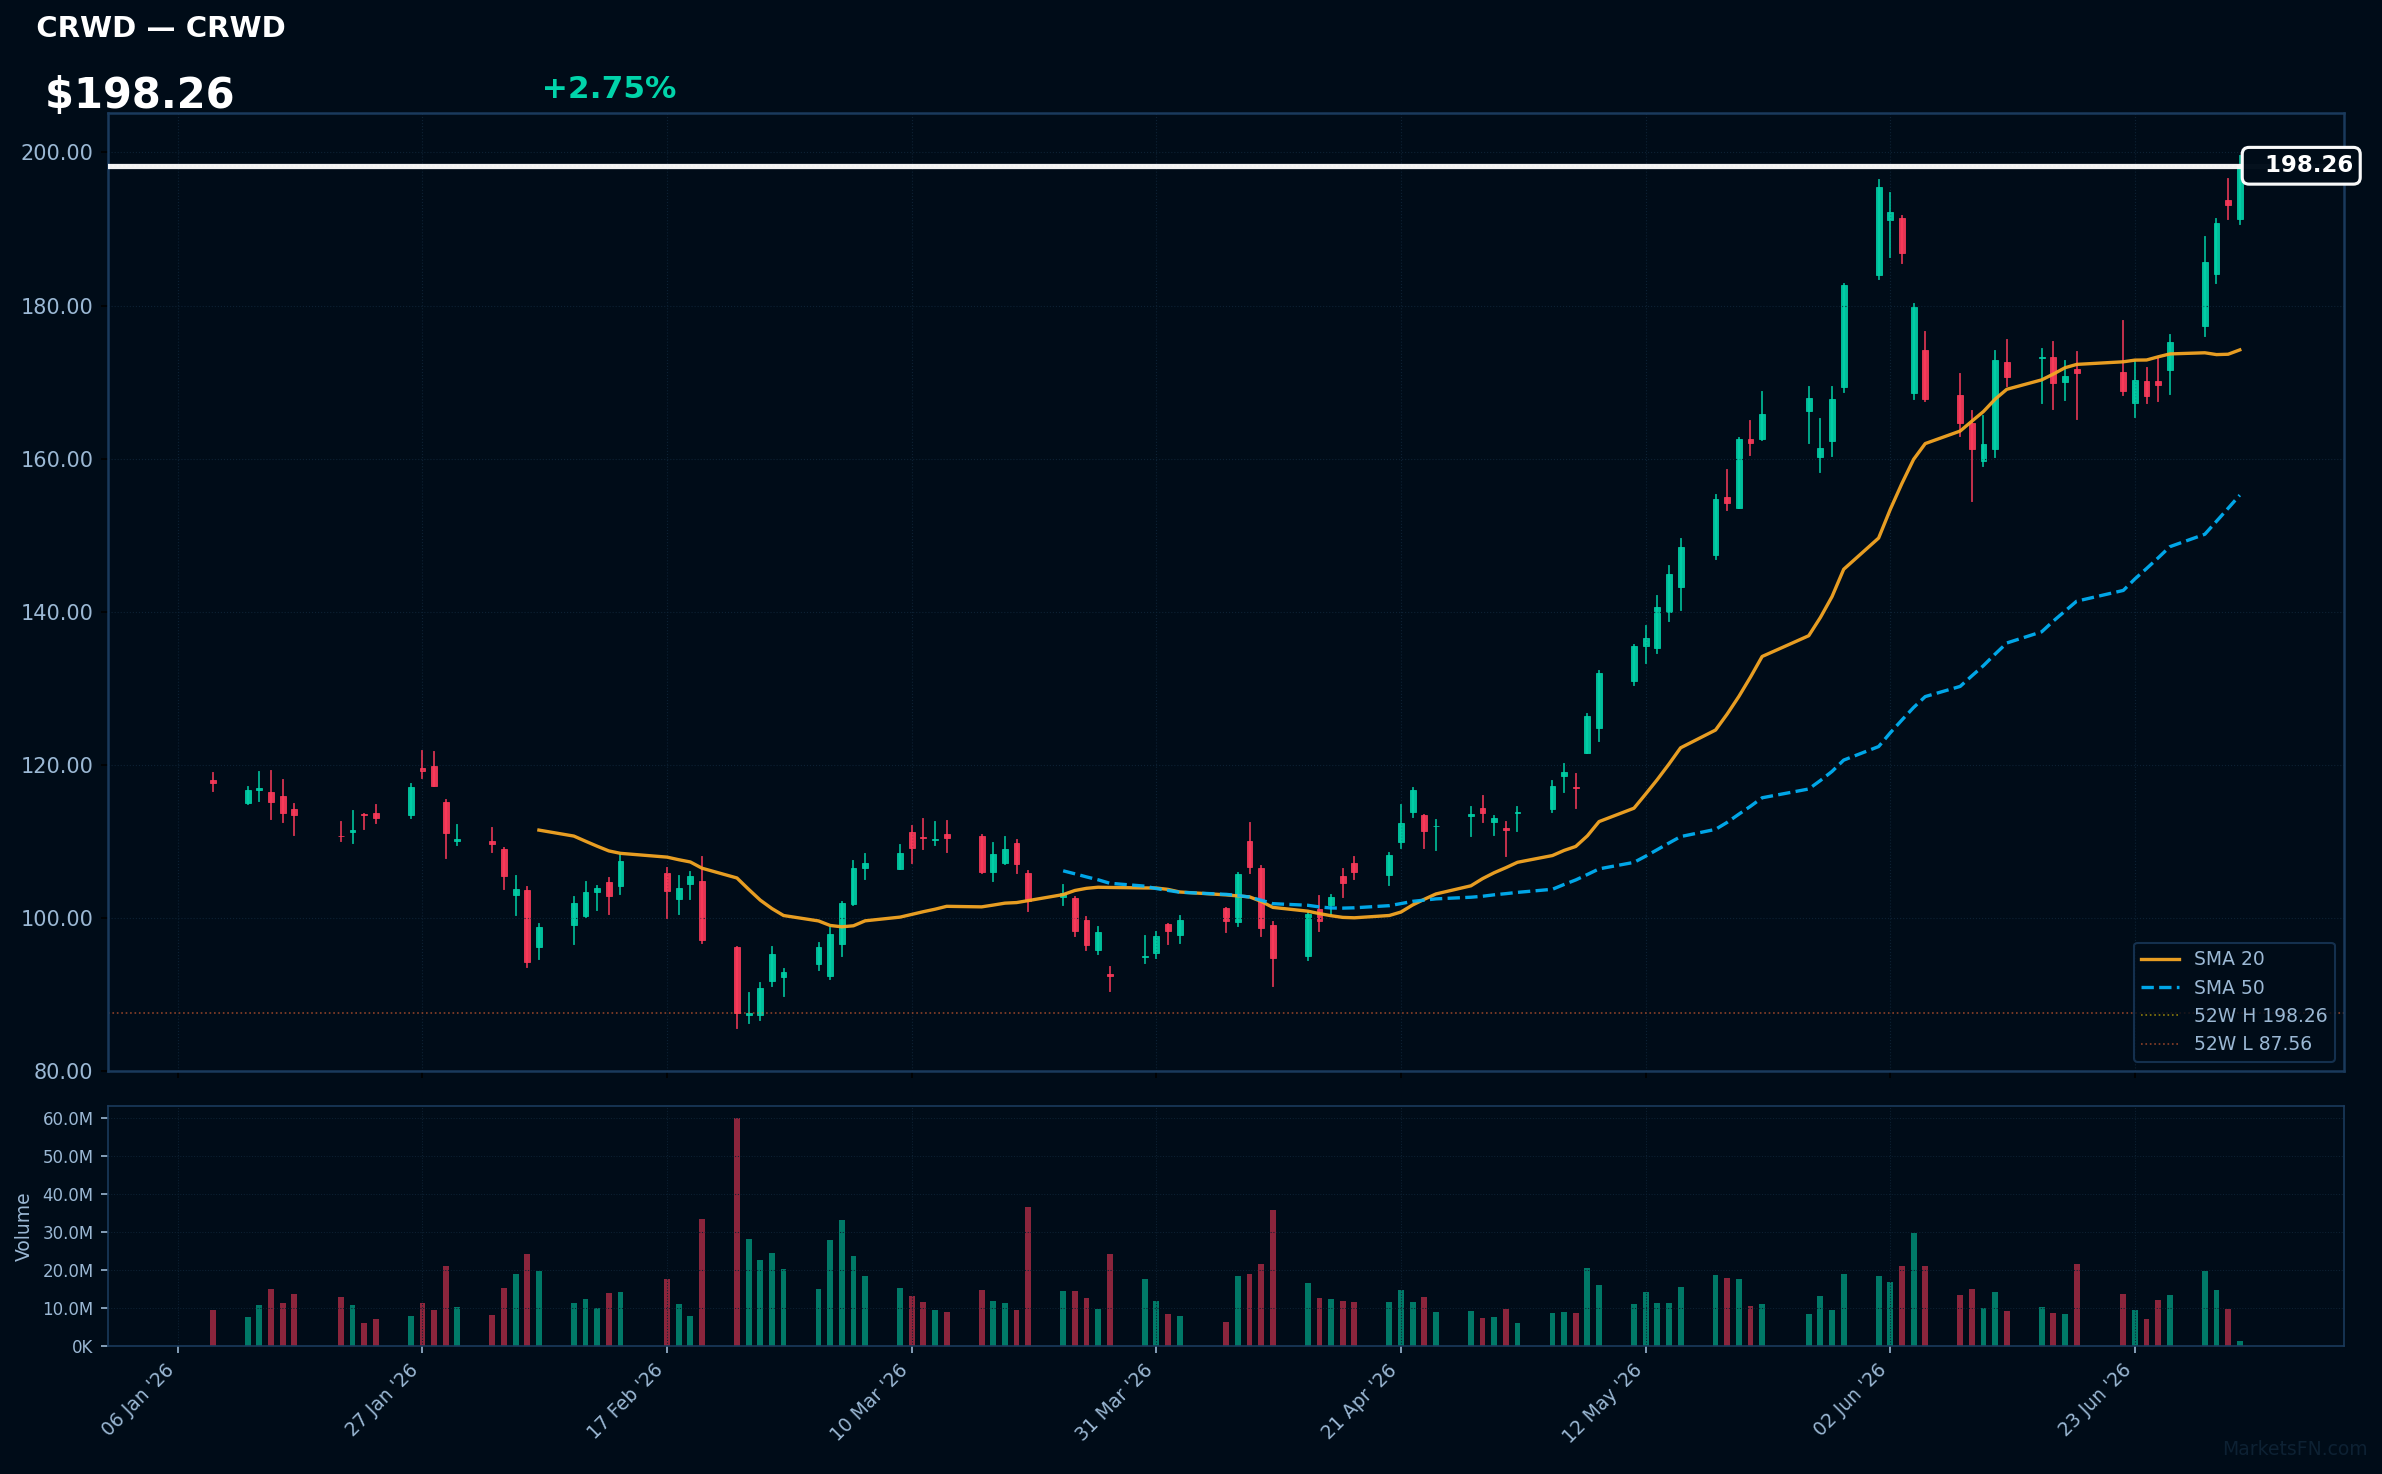
CRWD | Crowdstrike Holdings Inc | Technology | Price: $198.49 | Day: +2.75% | 1W: +16.86% | 1M: +3.14% | RSI: 73.9 | vs MA200: +58.0% | Trend: Above MA20, MA50, MA200
Top 10 Losers
Today's weakest Nasdaq 100 performers. Sector drag: Technology (6), Communication Services (3), Consumer Cyclical (1).
| Ticker | Company | Sector | Price | Day % | 1W % | 1M % | RSI | vs MA200 | Trend |
|---|---|---|---|---|---|---|---|---|---|
| SHOP | Shopify Inc | Technology | $120.08 | -1.27% | +7.45% | +2.50% | 58.5 | -11.9% | Above MA20, MA50 · Below MA200 |
| CMCSA | Comcast Corp | Communication Services | $23.42 | -1.29% | +3.24% | -5.73% | 44.8 | -15.0% | Below MA20, MA50, MA200 |
| CSCO | Cisco Systems, Inc | Technology | $115.40 | -1.38% | -2.98% | -9.82% | 47.4 | +35.9% | Above MA50, MA200 · Below MA20 |
| CDW | CDW Corp | Technology | $136.18 | -1.61% | +6.37% | -2.53% | 57.5 | +0.9% | Above MA20, MA50, MA200 |
| CHTR | Charter Communications Inc | Communication Services | $137.00 | -2.03% | +5.67% | -2.33% | 46.4 | -33.5% | Above MA20 · Below MA50, MA200 |
| AMAT | Applied Materials Inc | Technology | $633.62 | -2.66% | -5.15% | +29.30% | 57.9 | +86.6% | Above MA20, MA50, MA200 |
| LRCX | Lam Research Corp | Technology | $380.60 | -2.72% | -5.35% | +13.73% | 53.9 | +70.7% | Above MA20, MA50, MA200 |
| TSLA | Tesla Inc | Consumer Cyclical | $412.14 | -3.09% | +9.78% | -2.81% | 52.8 | -1.6% | Above MA20, MA50 · Below MA200 |
| META | Meta Platforms Inc | Communication Services | $590.72 | -3.62% | +8.73% | -1.23% | 51.5 | -8.6% | Above MA20 · Below MA50, MA200 |
| KLAC | KLA Corp | Technology | $255.35 | -4.07% | -1.34% | +24.84% | 54.8 | +67.9% | Above MA20, MA50, MA200 |
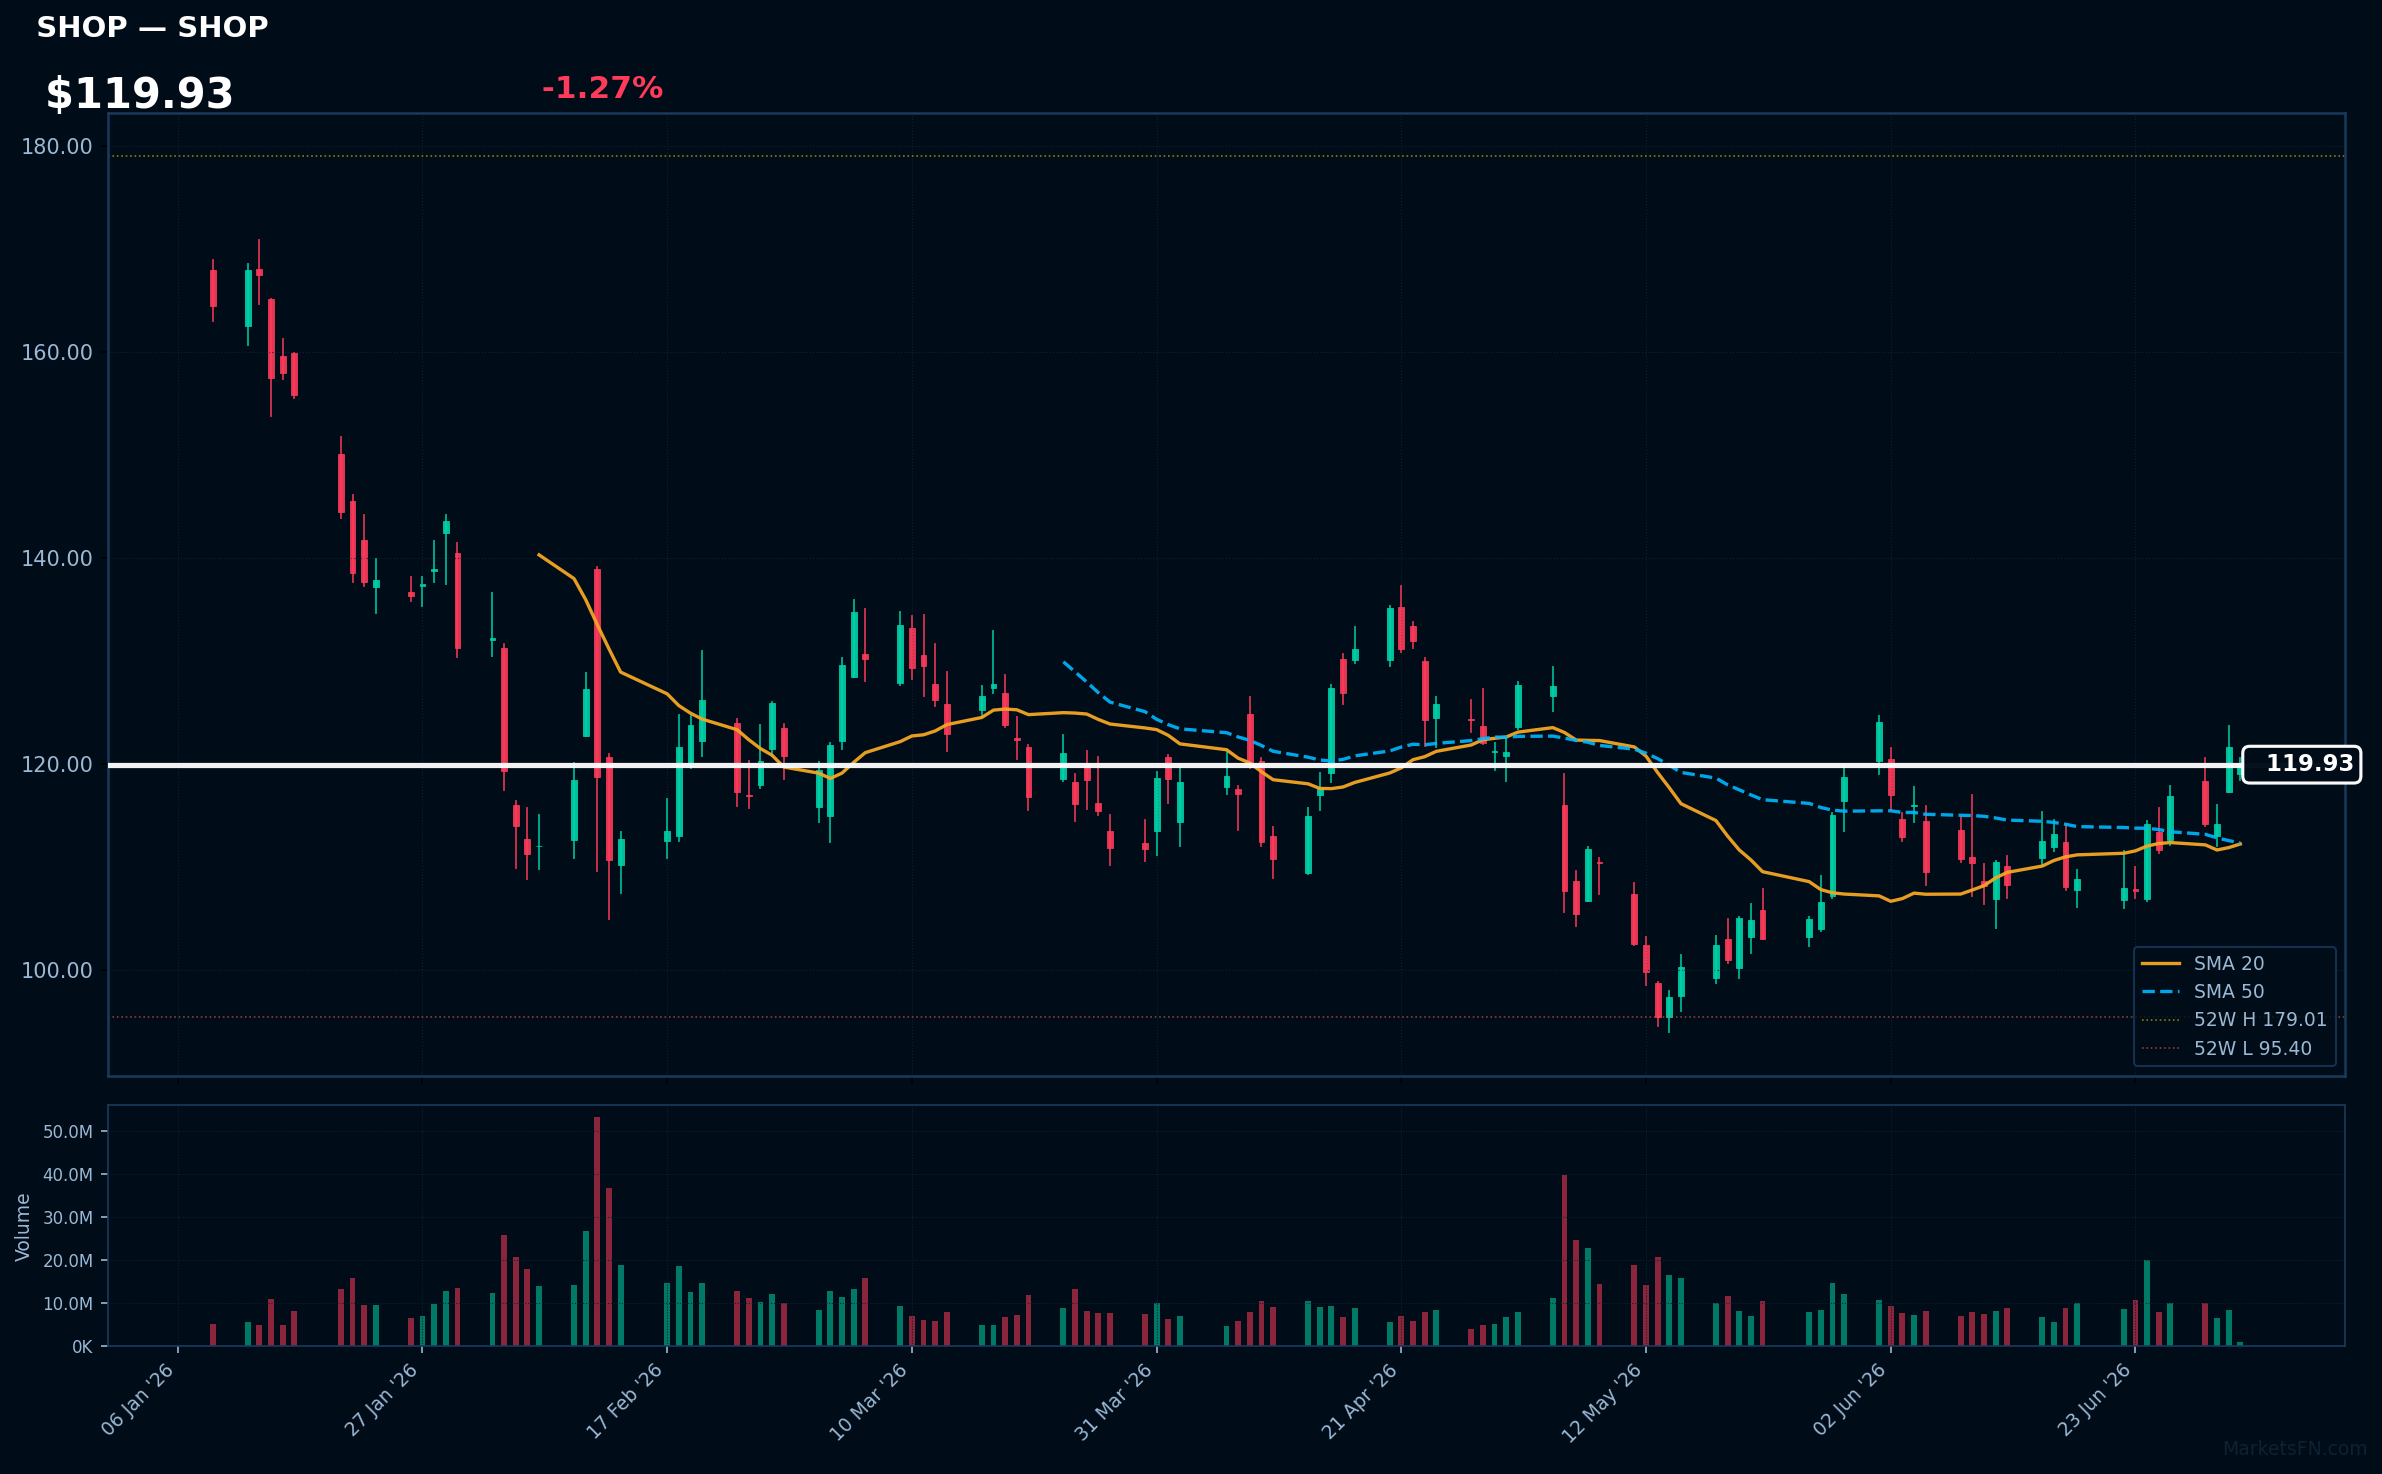
SHOP | Shopify Inc | Technology | Price: $120.08 | Day: -1.27% | 1W: +7.45% | 1M: +2.50% | RSI: 58.5 | vs MA200: -11.9% | Trend: Above MA20, MA50 · Below MA200
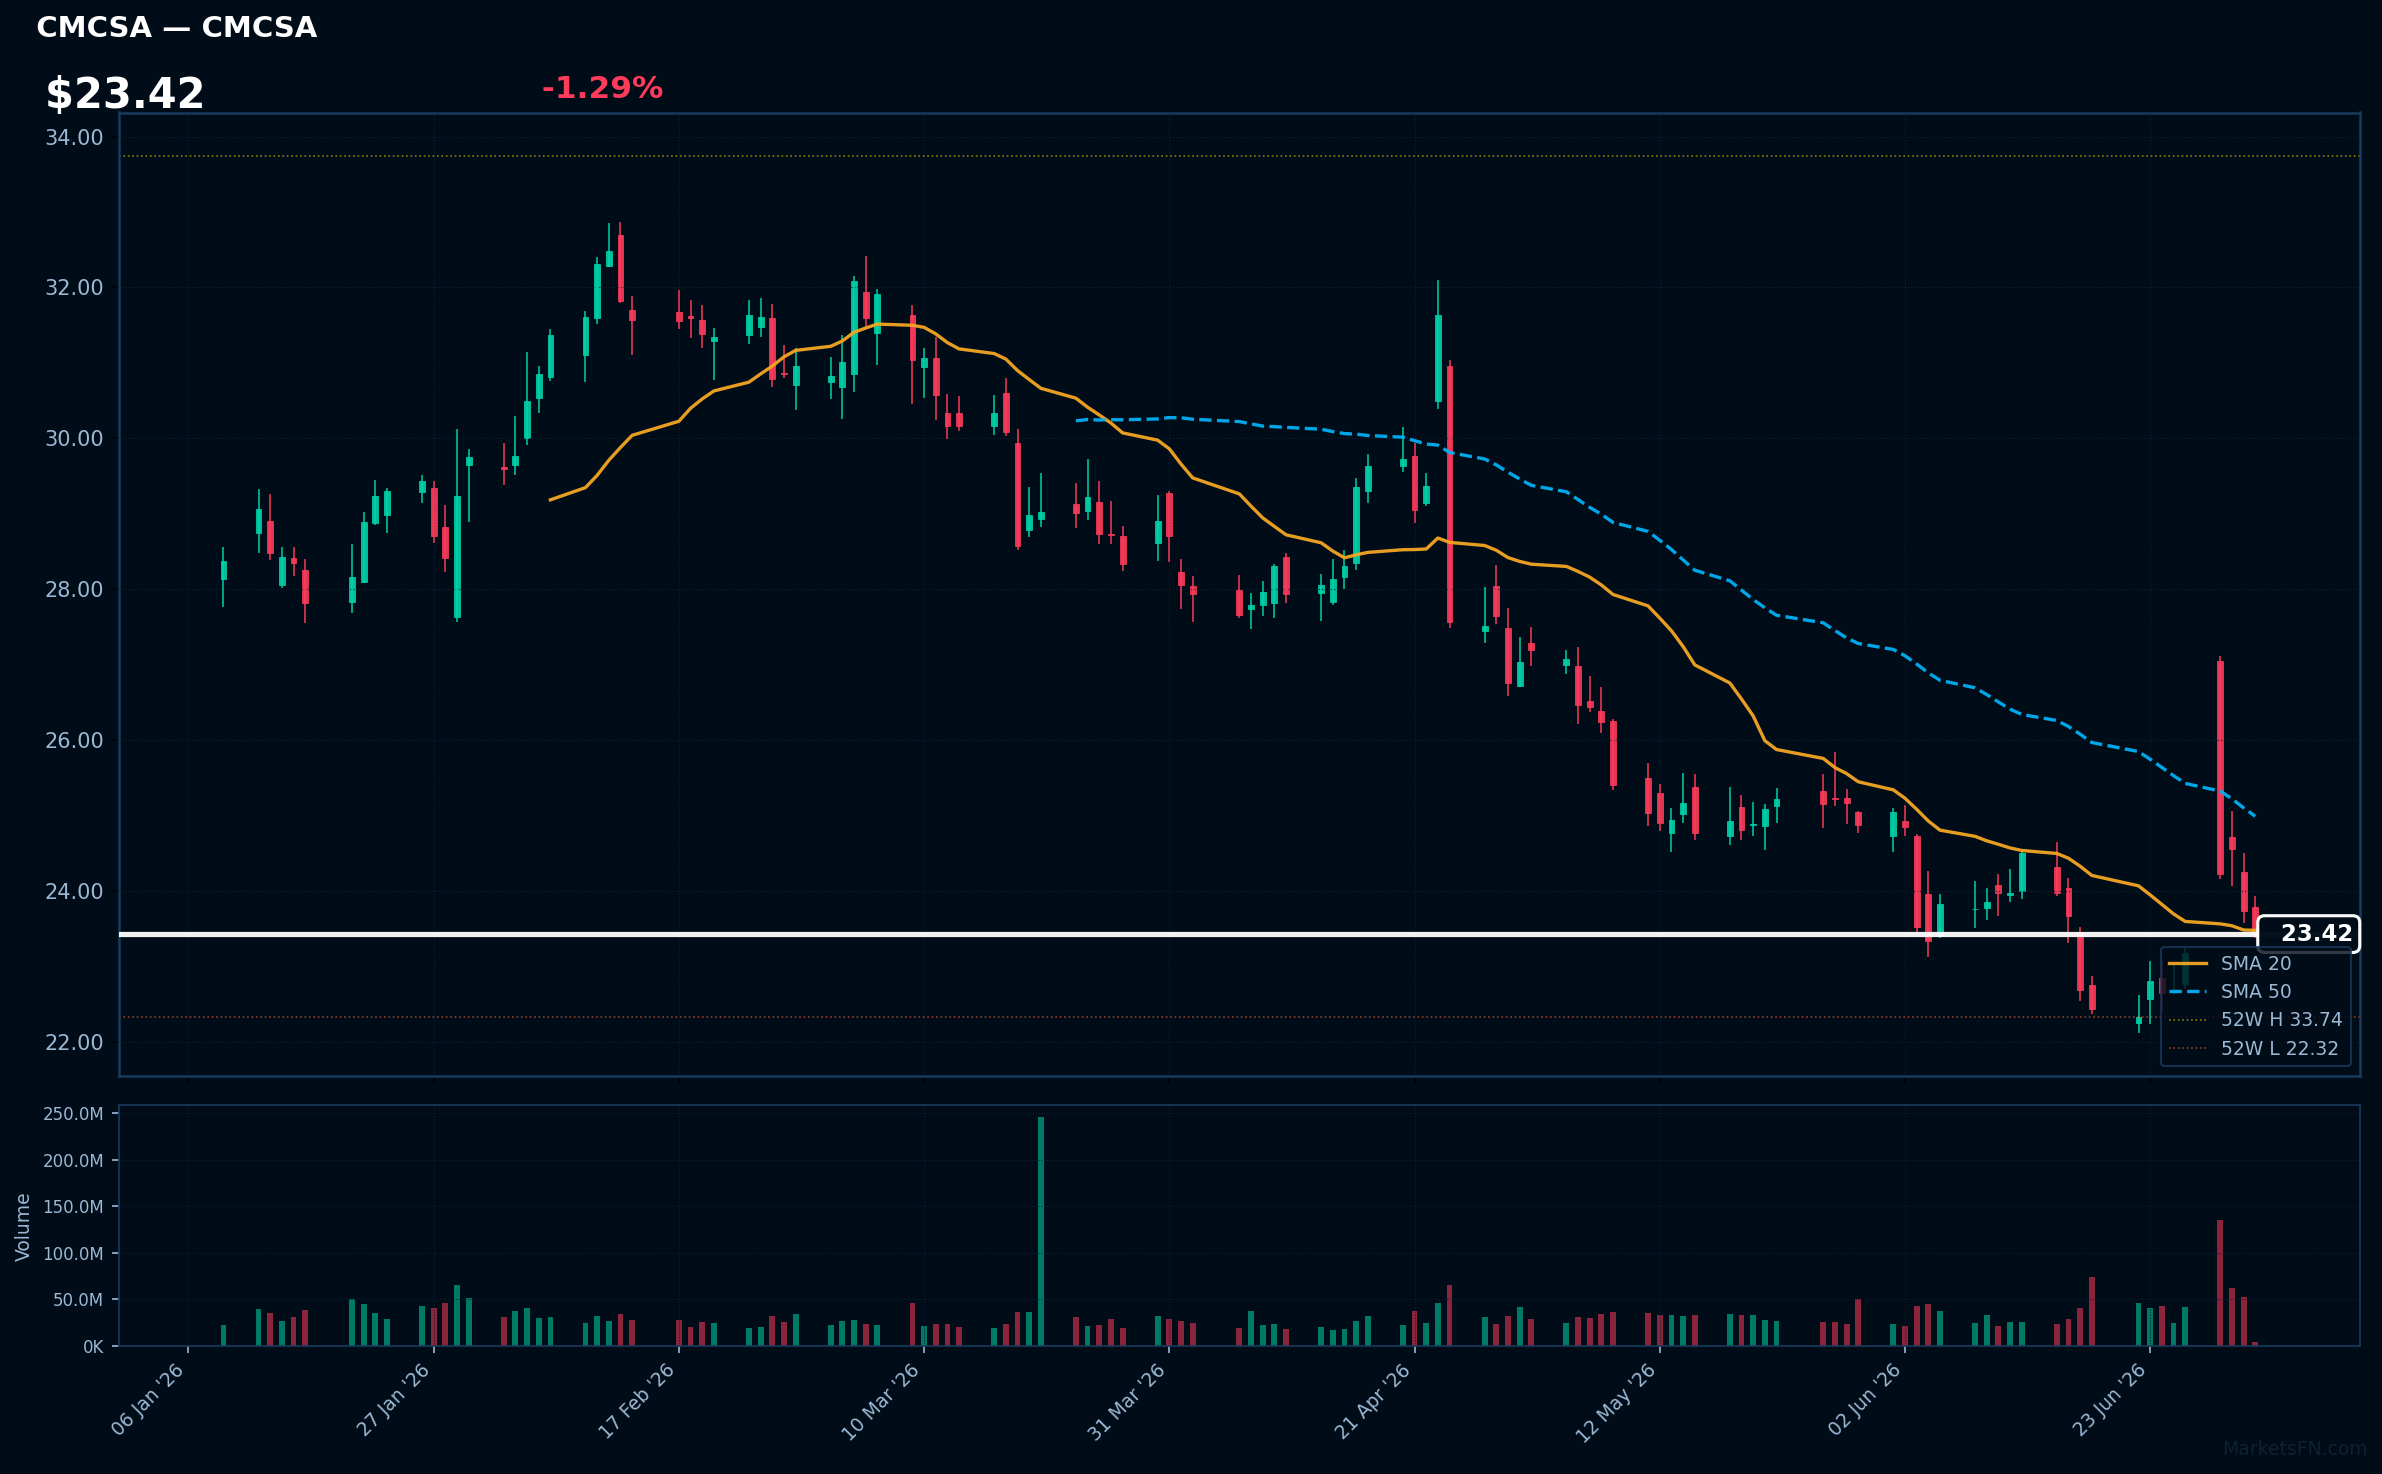
CMCSA | Comcast Corp | Communication Services | Price: $23.42 | Day: -1.29% | 1W: +3.24% | 1M: -5.73% | RSI: 44.8 | vs MA200: -15.0% | Trend: Below MA20, MA50, MA200
Recent headlines (last 12h)
- A Cable Scion's Hardest Deal Yet: Breaking Up His Family's Company
- NBCUniversal spin marks new era of Hollywood moguls
- CFOs On the Move: Week ending July 2
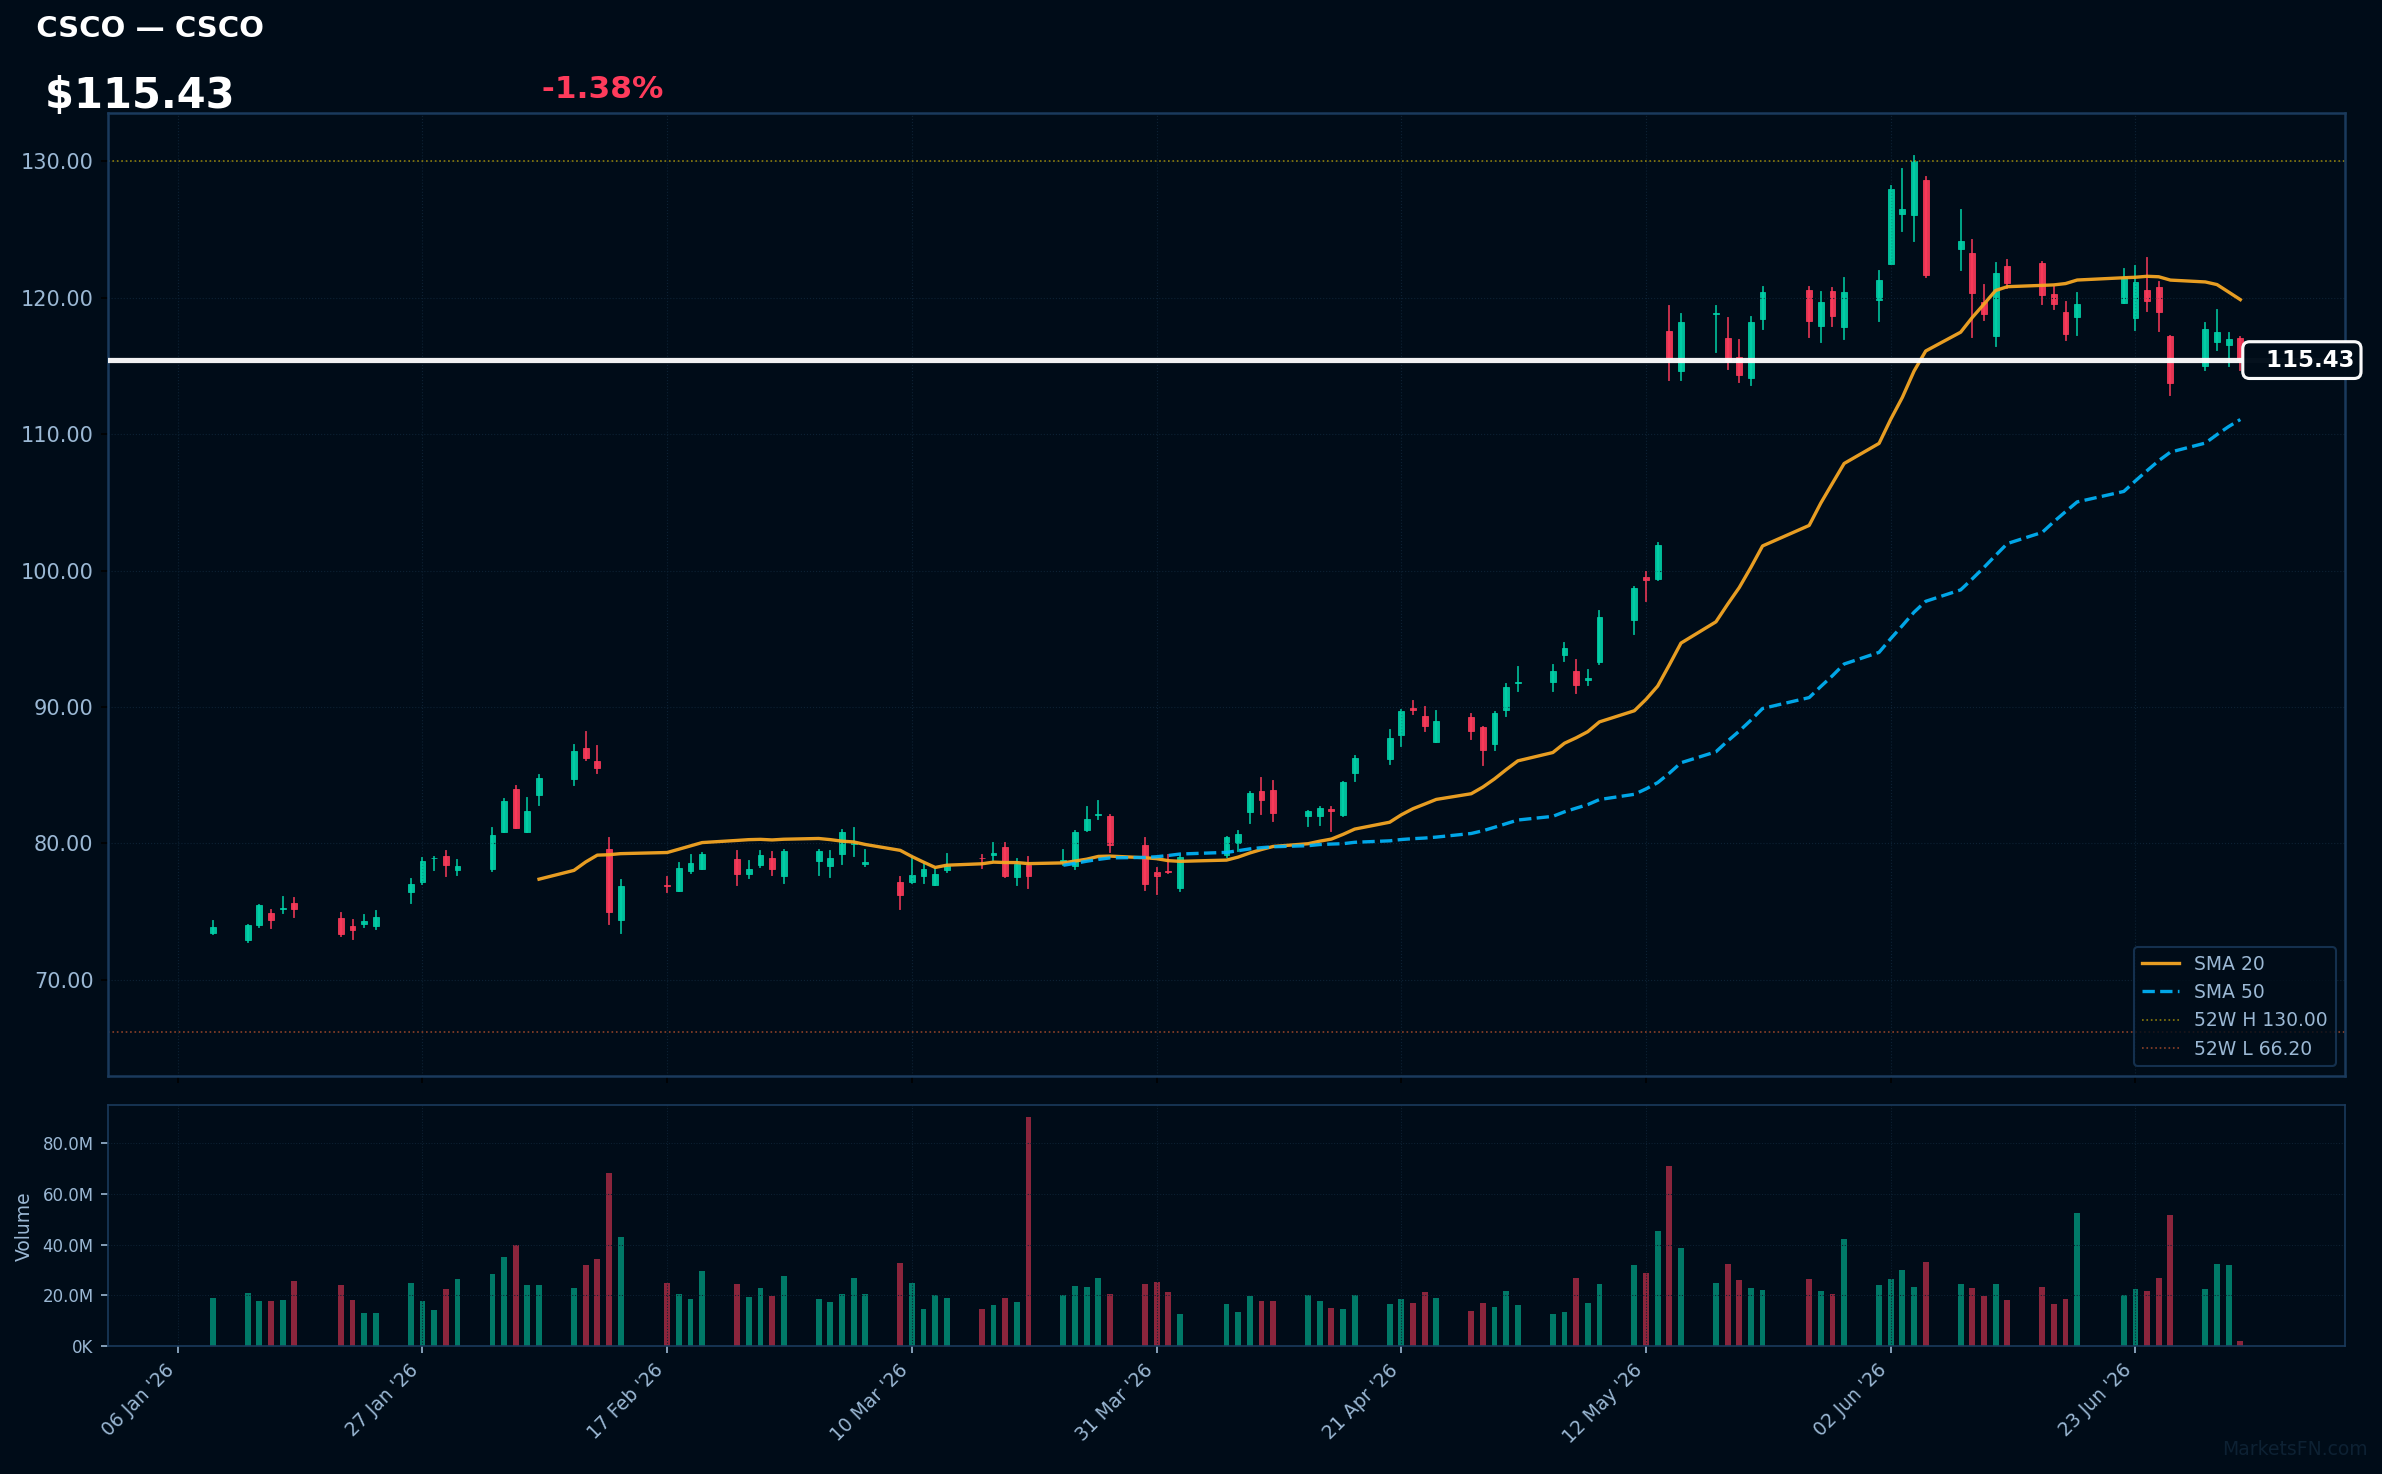
CSCO | Cisco Systems, Inc | Technology | Price: $115.40 | Day: -1.38% | 1W: -2.98% | 1M: -9.82% | RSI: 47.4 | vs MA200: +35.9% | Trend: Above MA50, MA200 · Below MA20
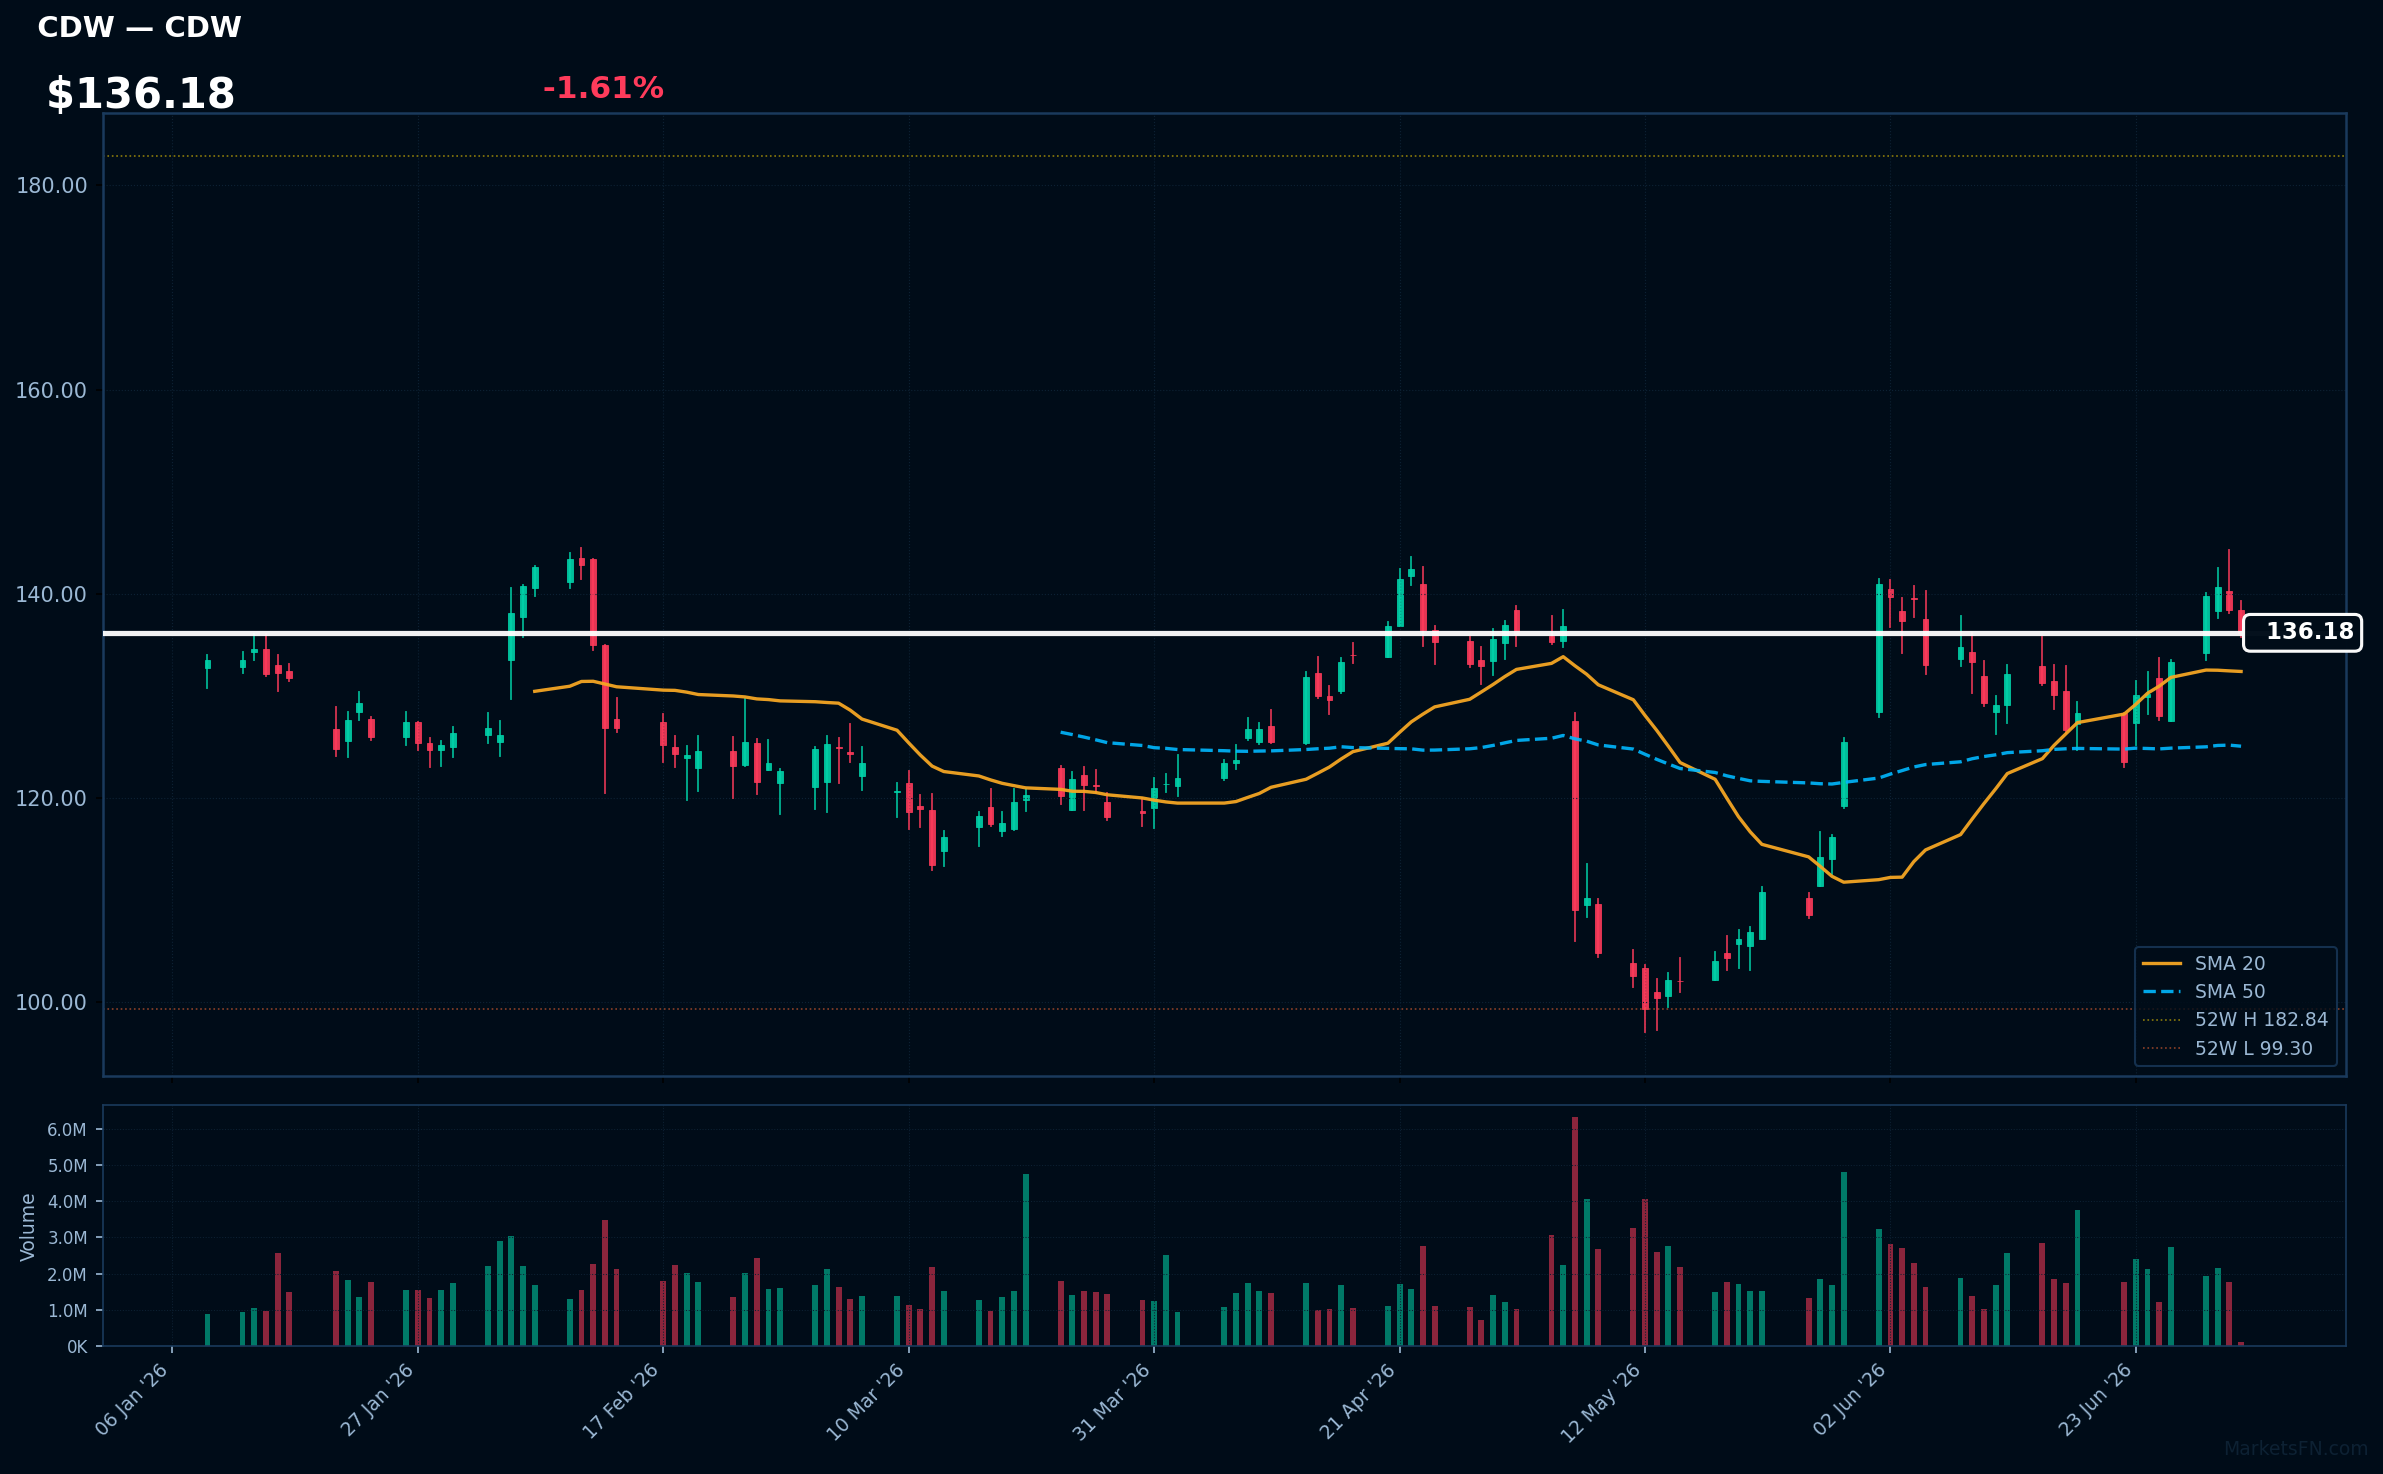
CDW | CDW Corp | Technology | Price: $136.18 | Day: -1.61% | 1W: +6.37% | 1M: -2.53% | RSI: 57.5 | vs MA200: +0.9% | Trend: Above MA20, MA50, MA200
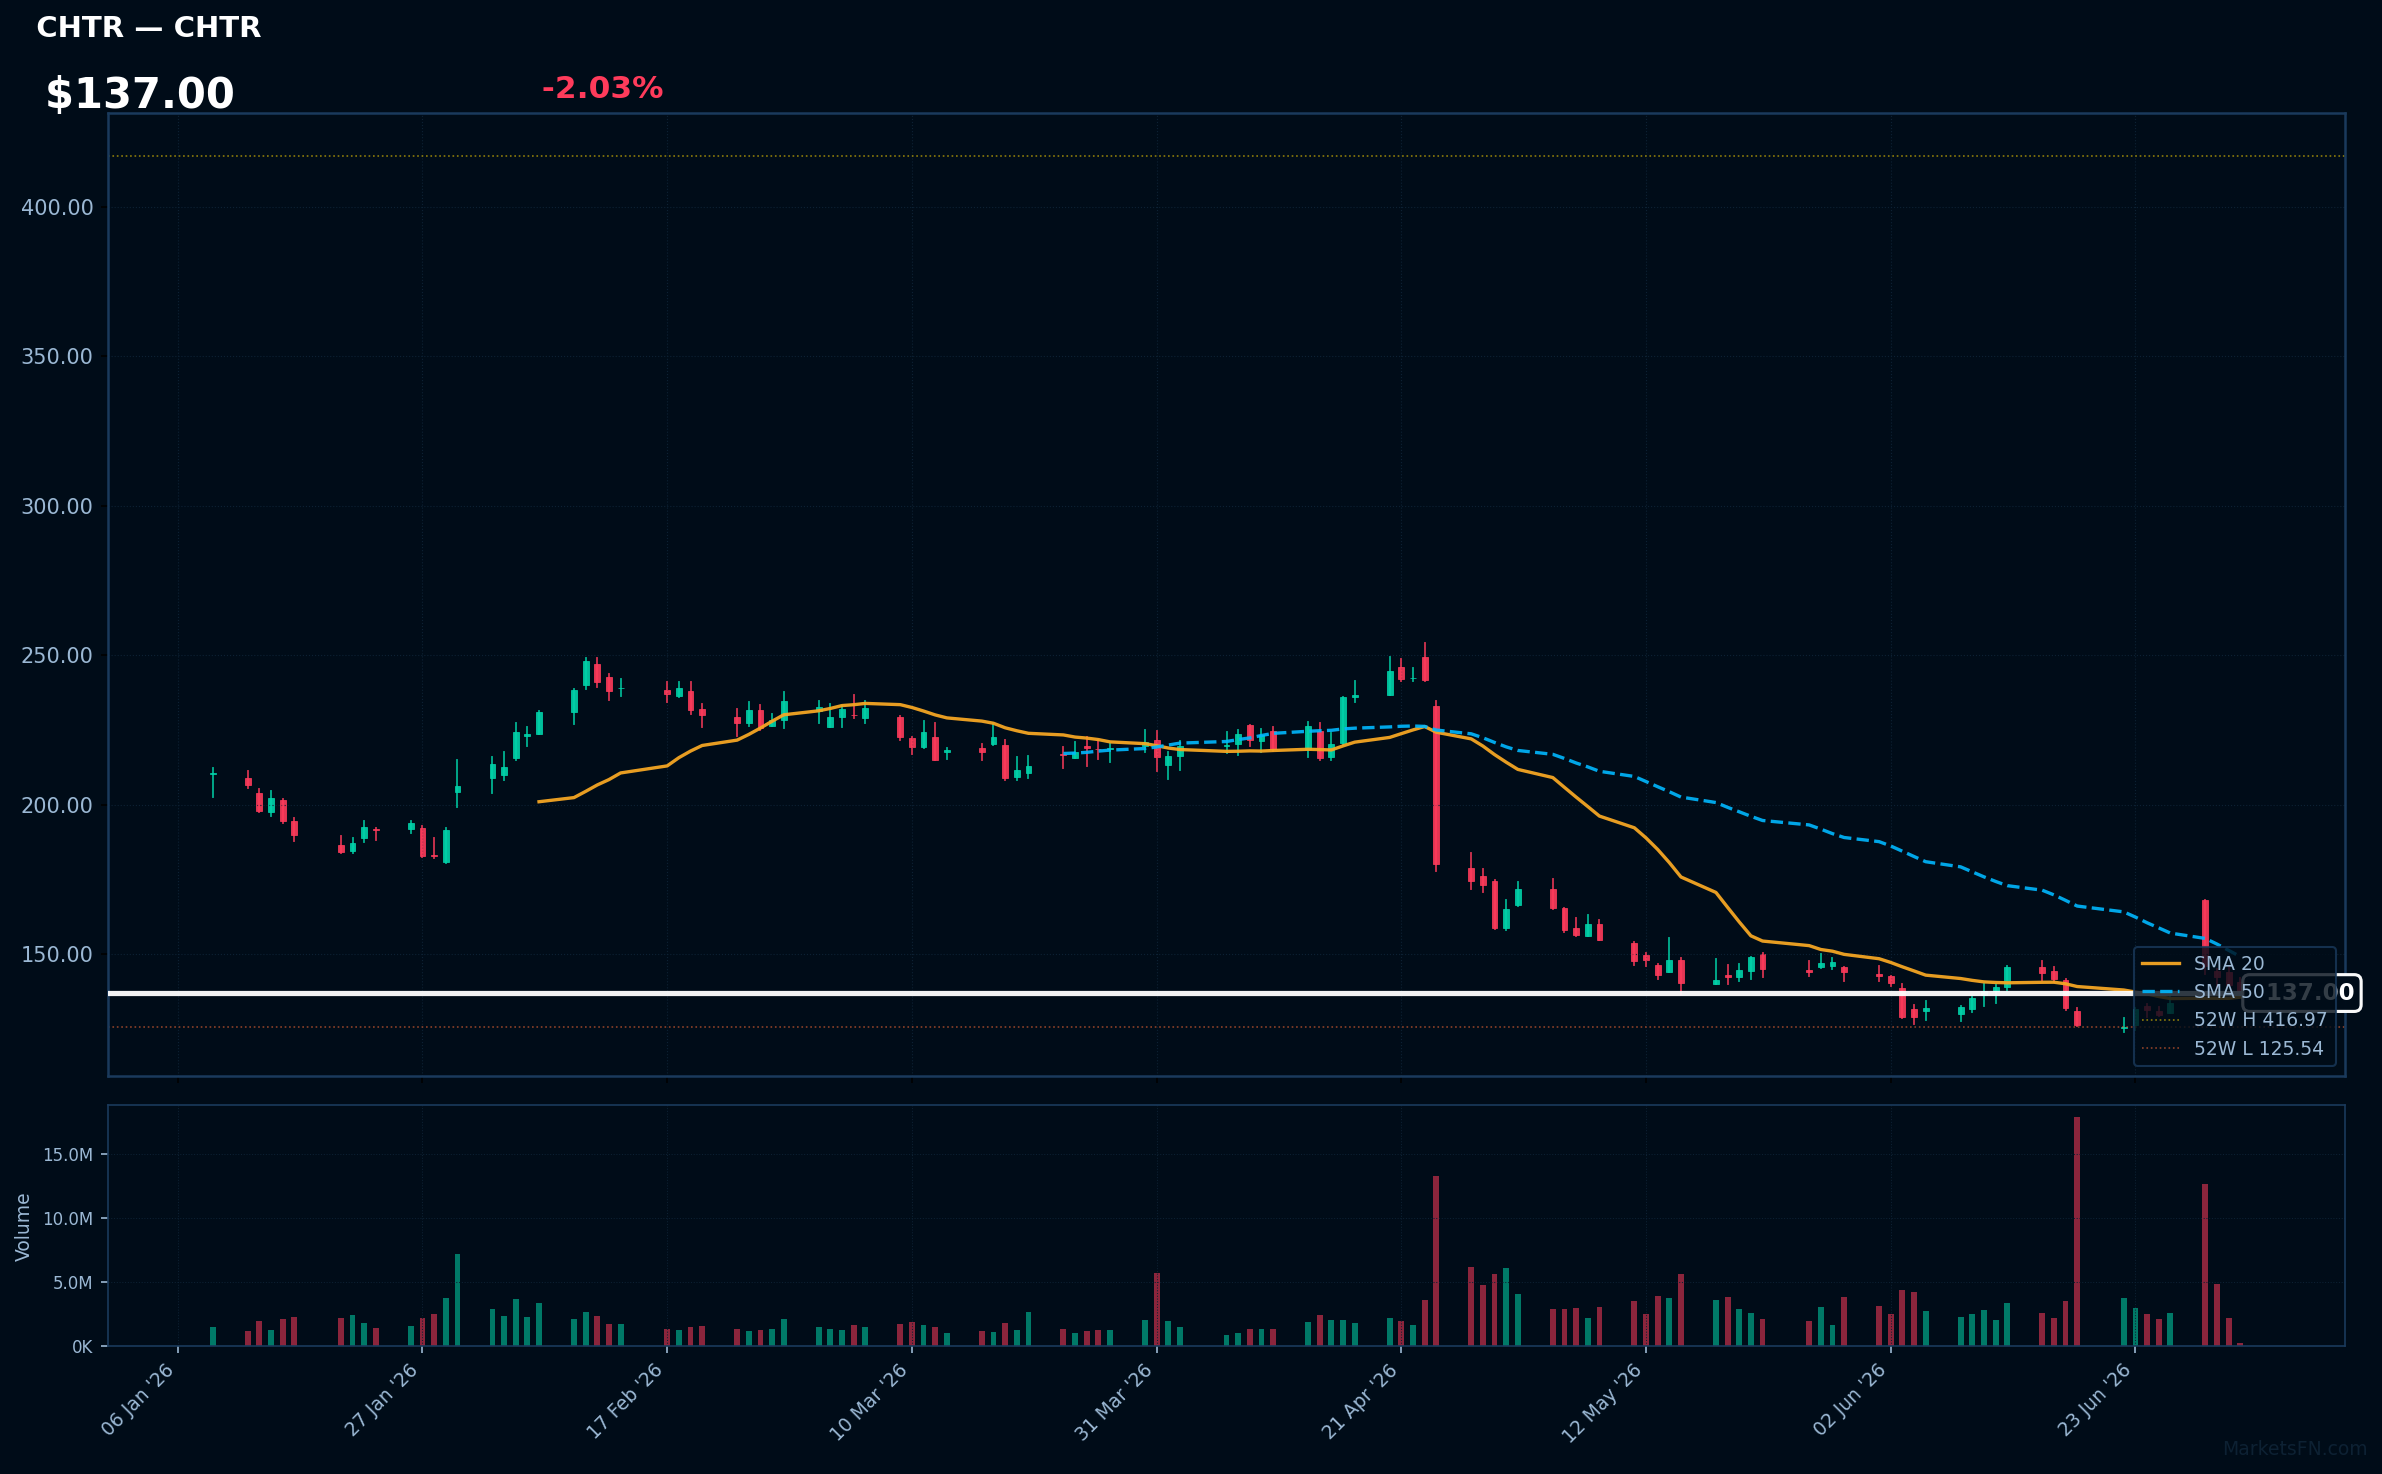
CHTR | Charter Communications Inc | Communication Services | Price: $137.00 | Day: -2.03% | 1W: +5.67% | 1M: -2.33% | RSI: 46.4 | vs MA200: -33.5% | Trend: Above MA20 · Below MA50, MA200

AMAT | Applied Materials Inc | Technology | Price: $633.62 | Day: -2.66% | 1W: -5.15% | 1M: +29.30% | RSI: 57.9 | vs MA200: +86.6% | Trend: Above MA20, MA50, MA200
Recent headlines (last 12h)
- Caterpillar Slides Nearly 7% After Burry Opens First Short
- Chip stocks selloff extends on valuation, Metas pivot fears
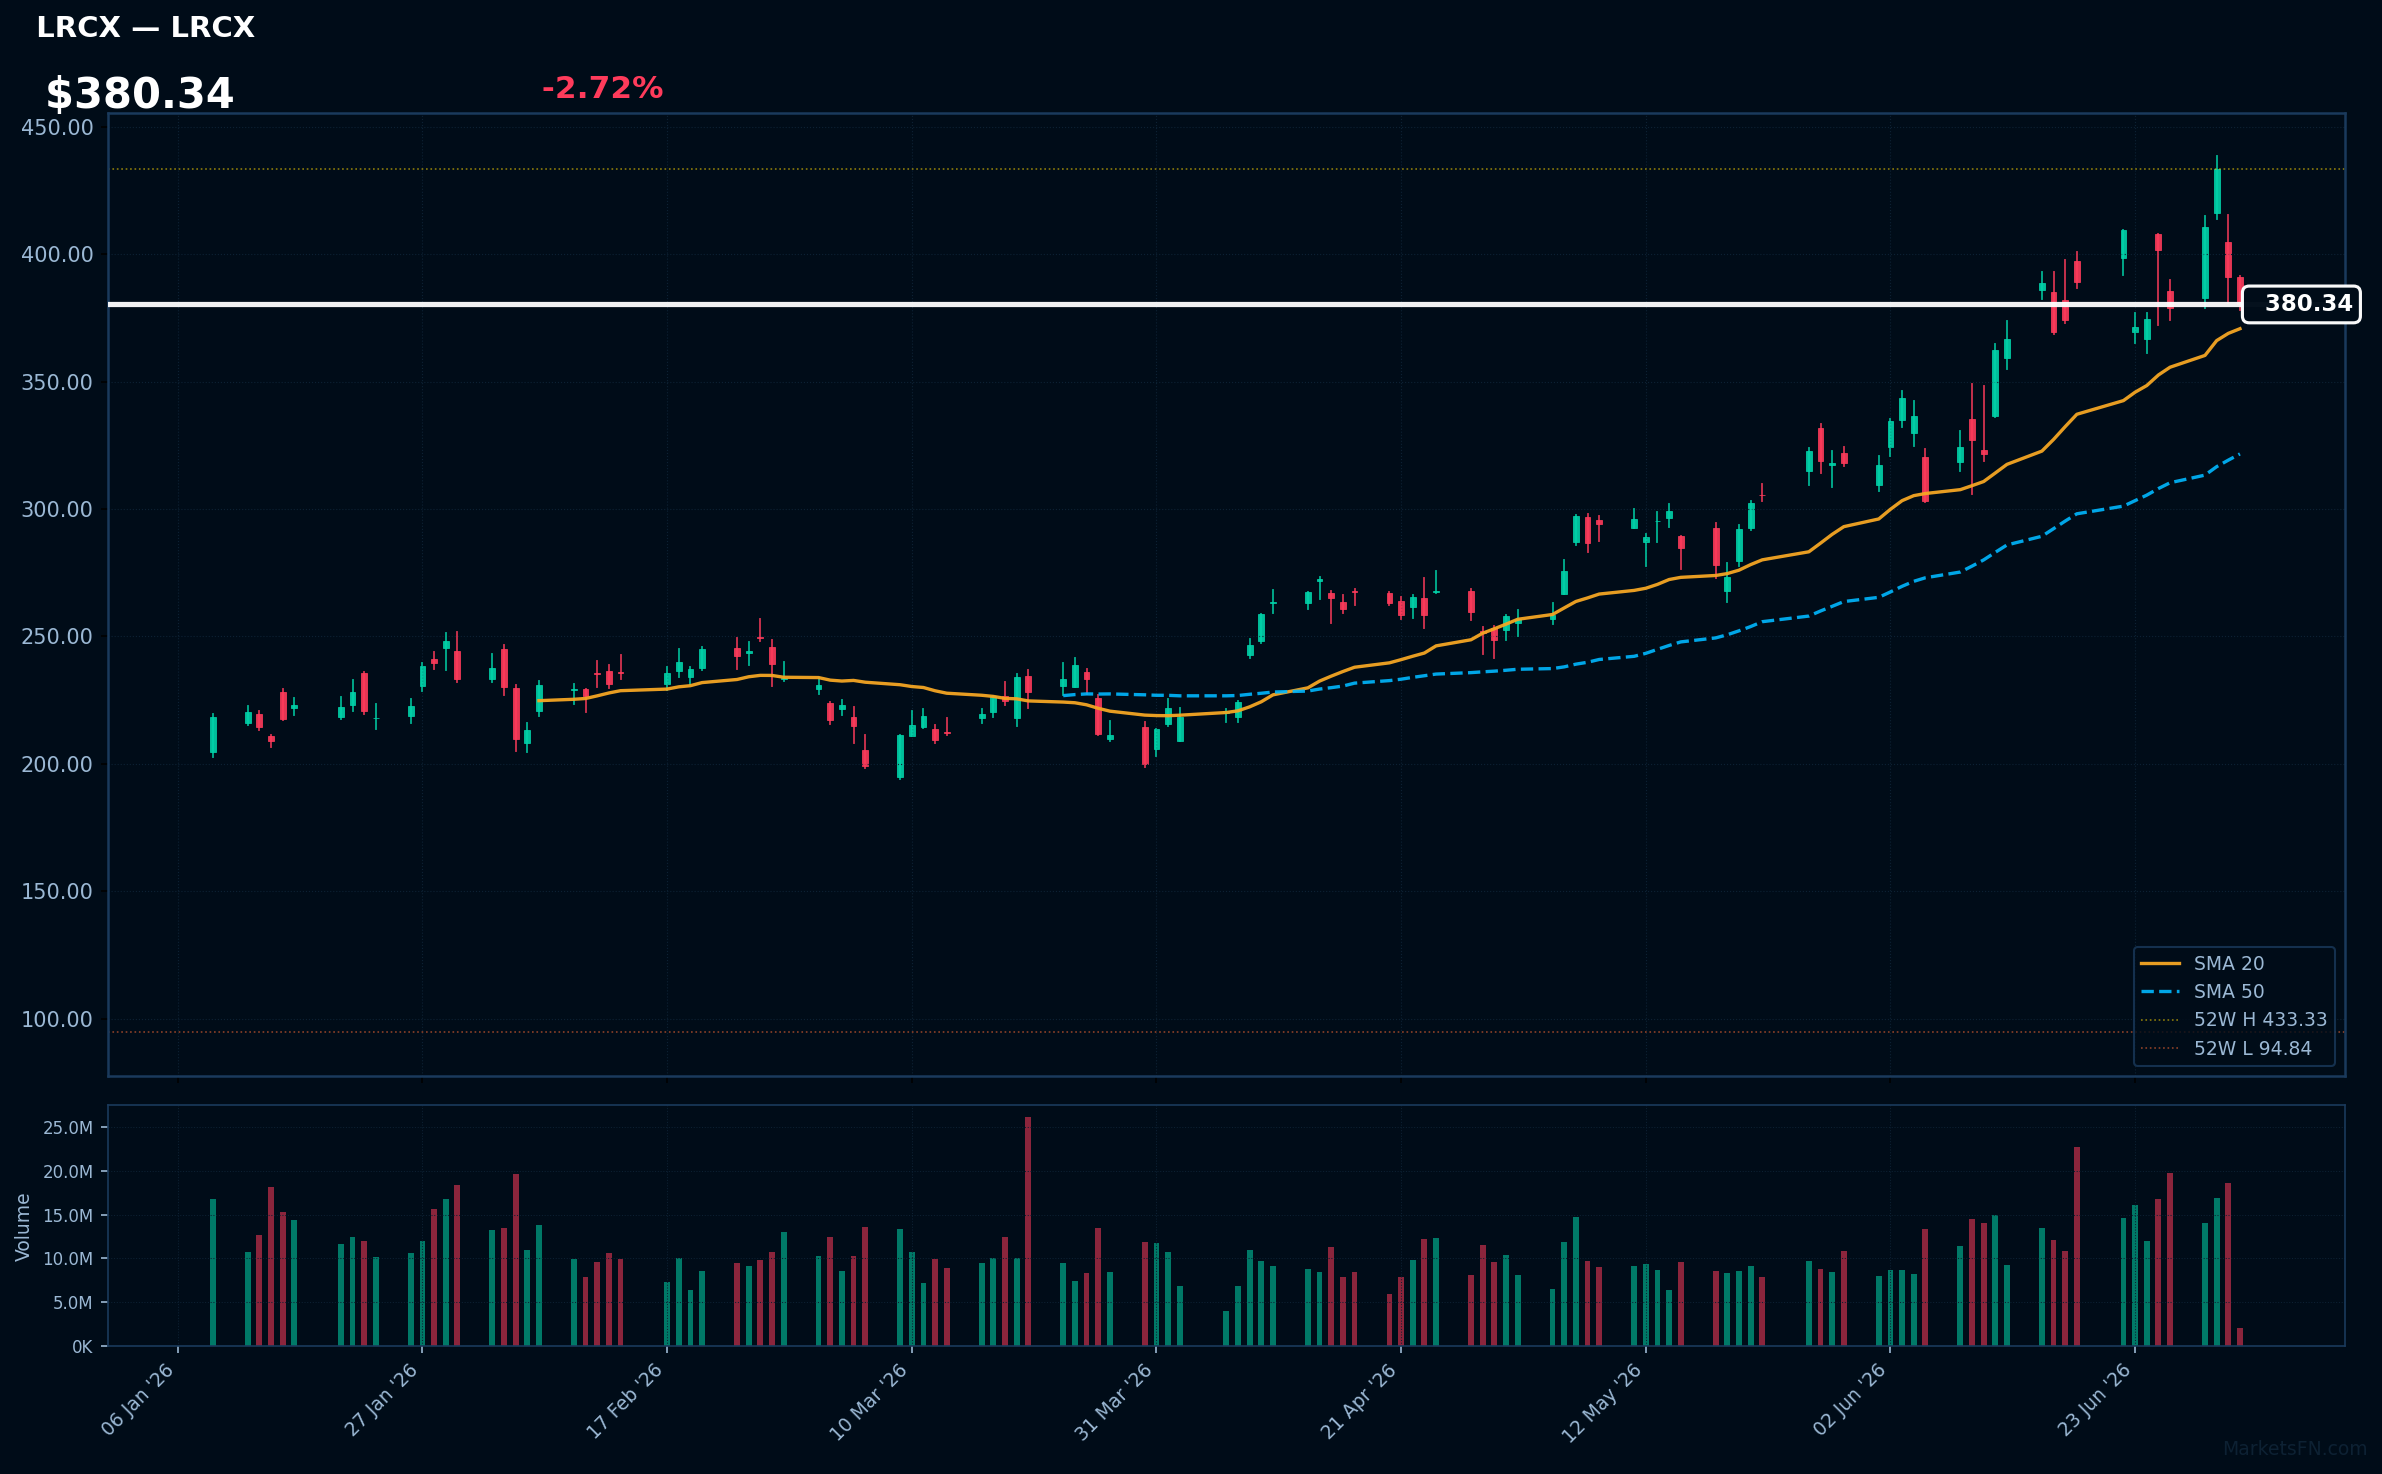
LRCX | Lam Research Corp | Technology | Price: $380.60 | Day: -2.72% | 1W: -5.35% | 1M: +13.73% | RSI: 53.9 | vs MA200: +70.7% | Trend: Above MA20, MA50, MA200
Recent headlines (last 12h)
- Chip stocks selloff extends on valuation, Metas pivot fears
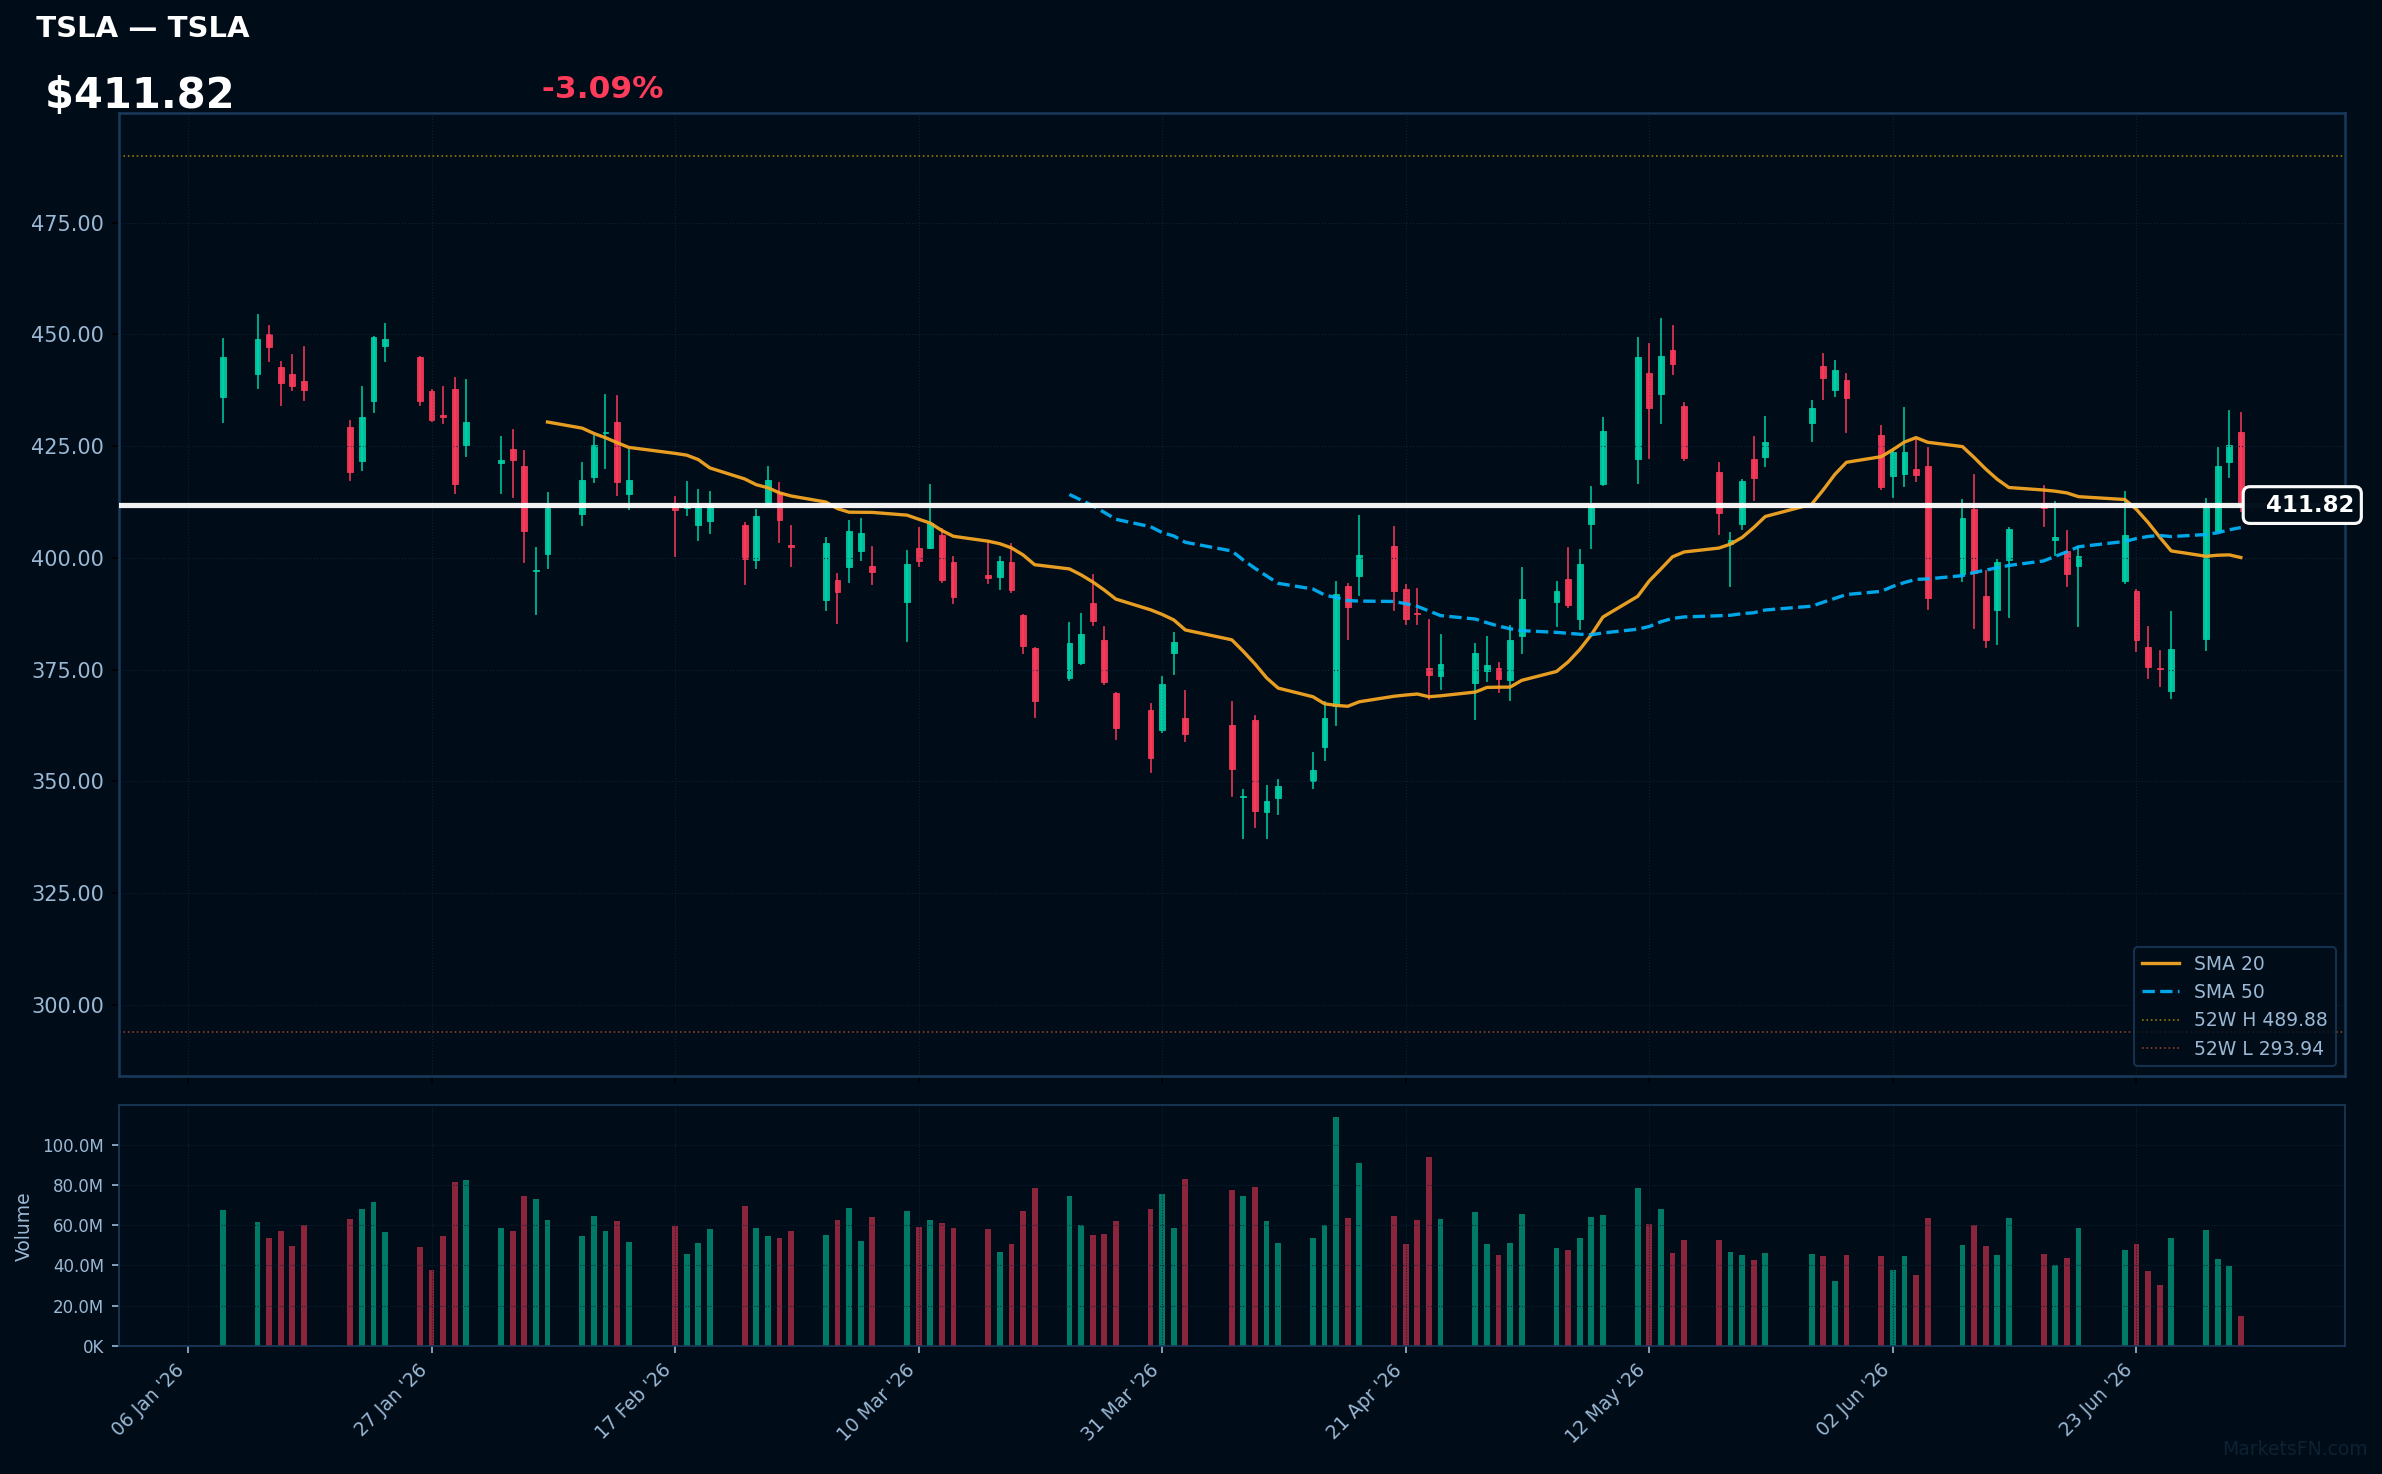
TSLA | Tesla Inc | Consumer Cyclical | Price: $412.14 | Day: -3.09% | 1W: +9.78% | 1M: -2.81% | RSI: 52.8 | vs MA200: -1.6% | Trend: Above MA20, MA50 · Below MA200
Recent headlines (last 12h)
- Tesla Eyes 3% Delivery Growth as Europe Sales Jump 57%
- Ethereum leads way as large cryptocurrencies post increases
- Rivian Stock Rises as EV Demand Rebounds on Higher Gas Prices
- Tesla beats forecasts with 480,126 Q2 deliveries
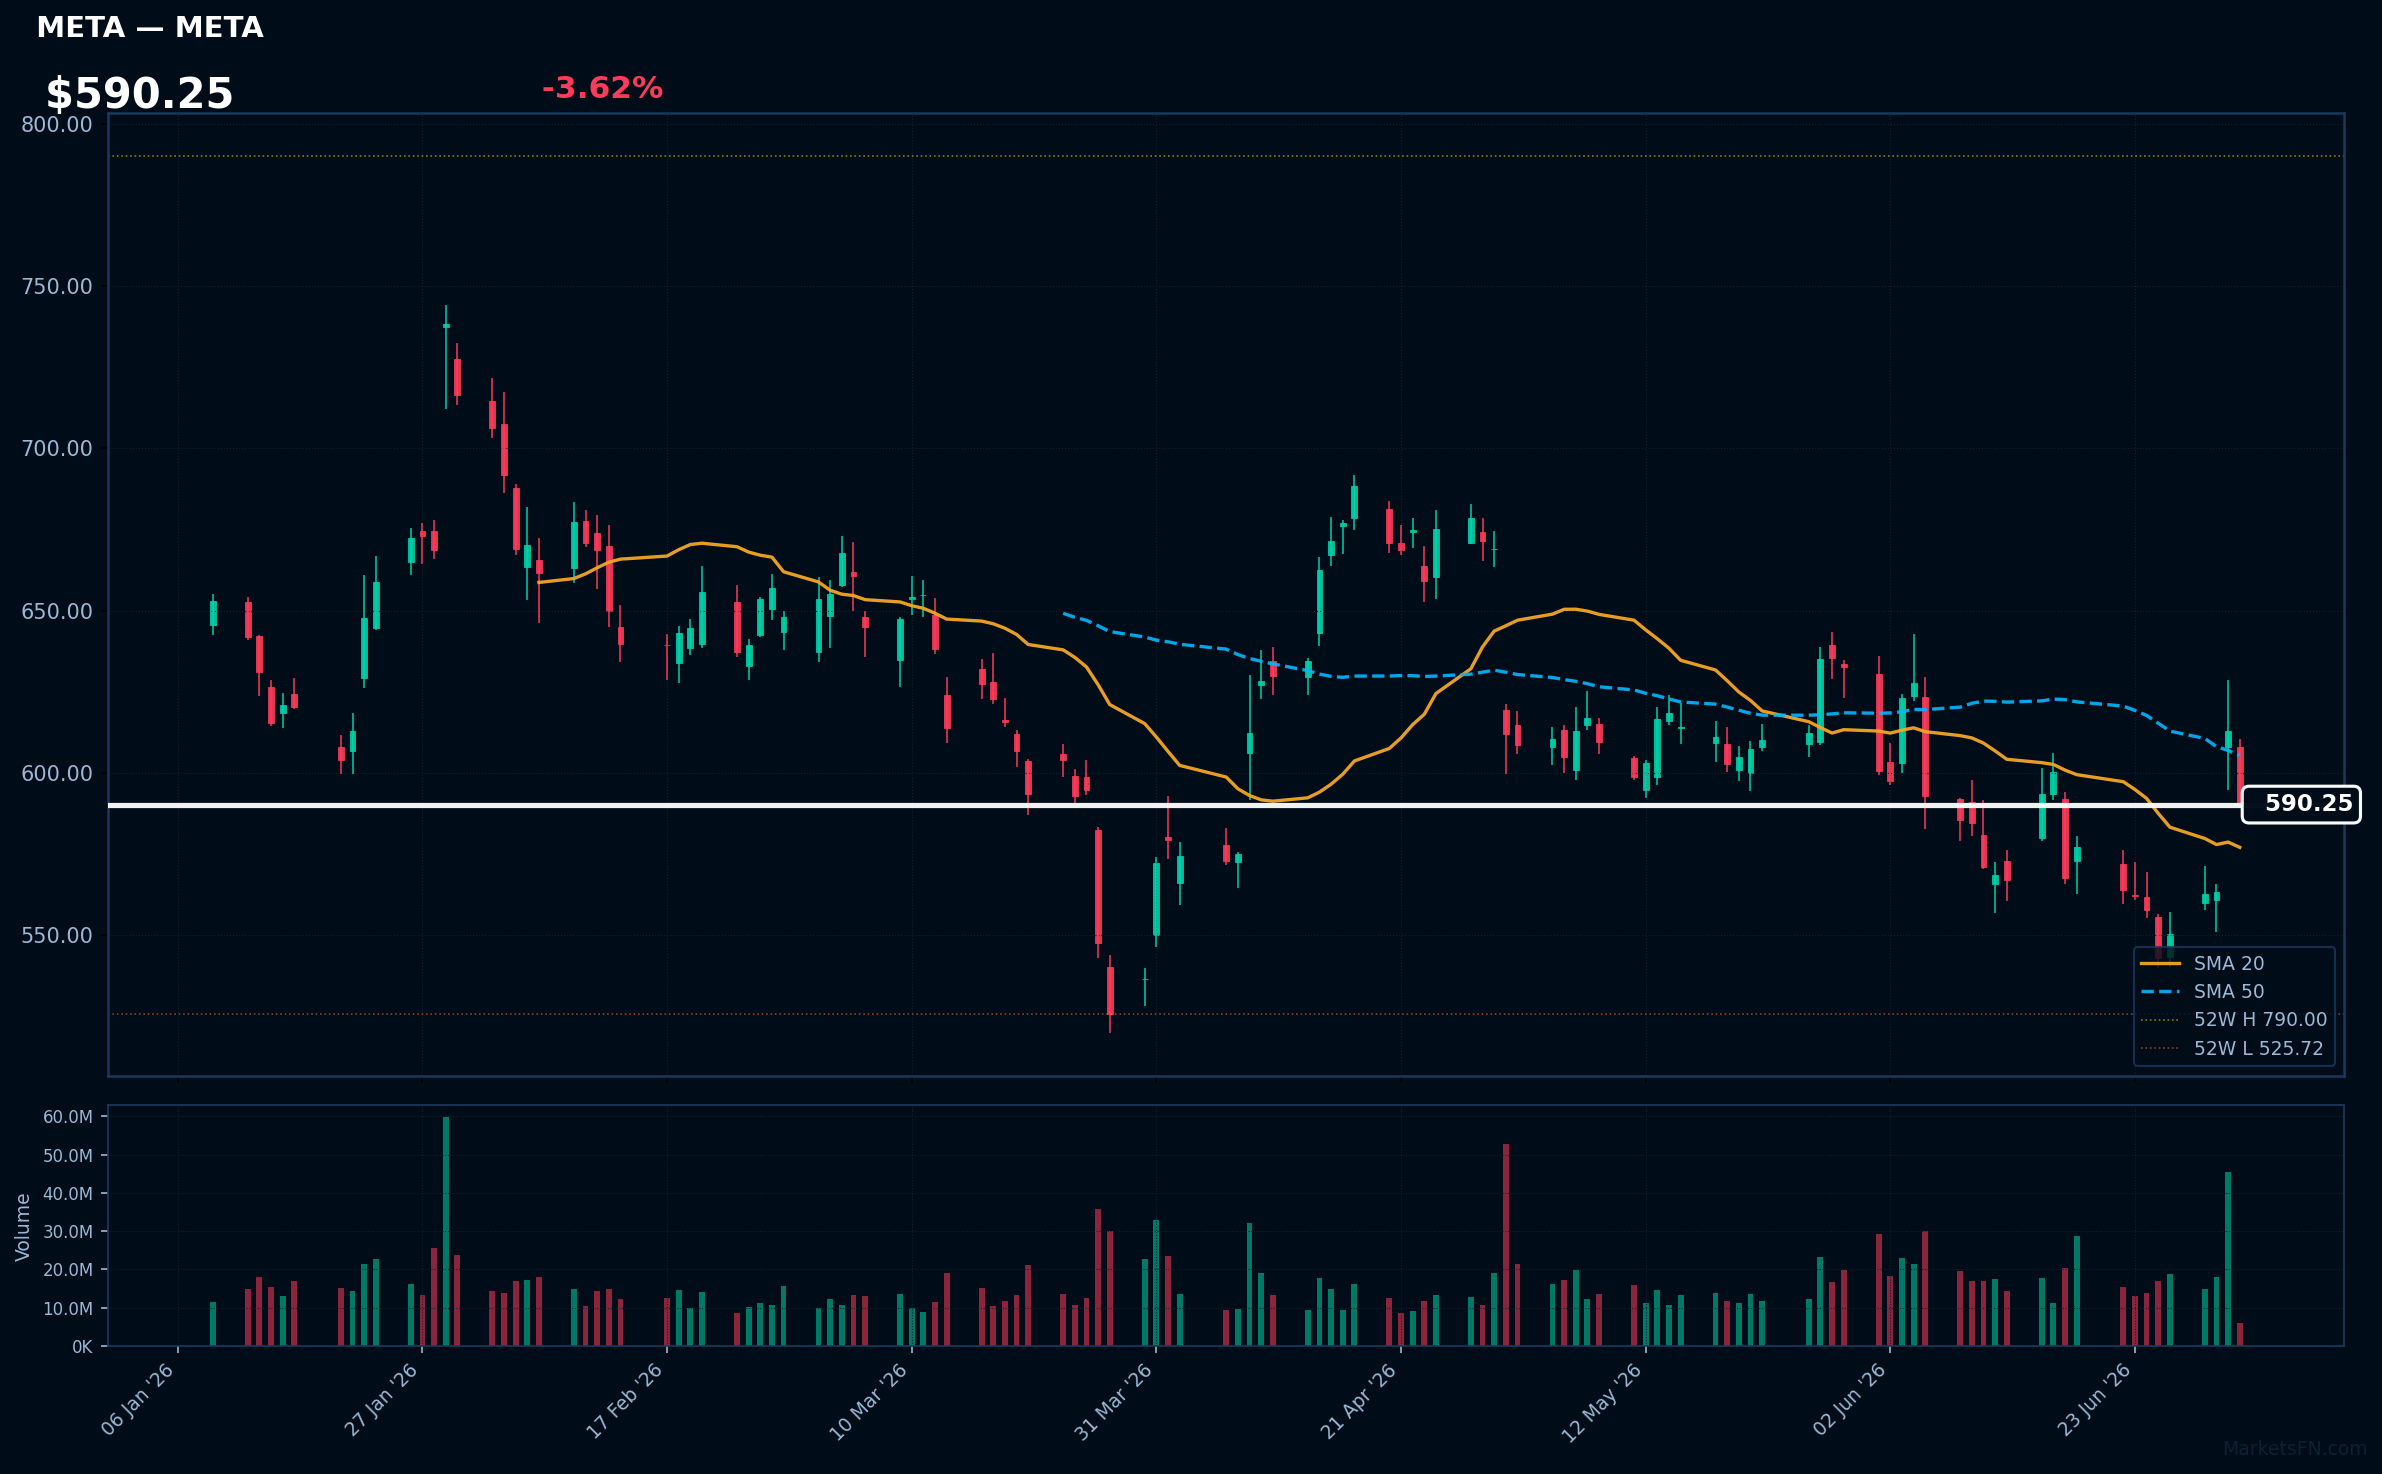
META | Meta Platforms Inc | Communication Services | Price: $590.72 | Day: -3.62% | 1W: +8.73% | 1M: -1.23% | RSI: 51.5 | vs MA200: -8.6% | Trend: Above MA20 · Below MA50, MA200
Recent headlines (last 12h)
- Morning Bid: Shares pull back as markets await likely payrolls beat
- Stock analysts may be setting up the market for a summer failure
- Why CoreWeave Stock Just Nosedived
- Meta Jumps 9.3% on Plans for AI Cloud Infrastructure Business
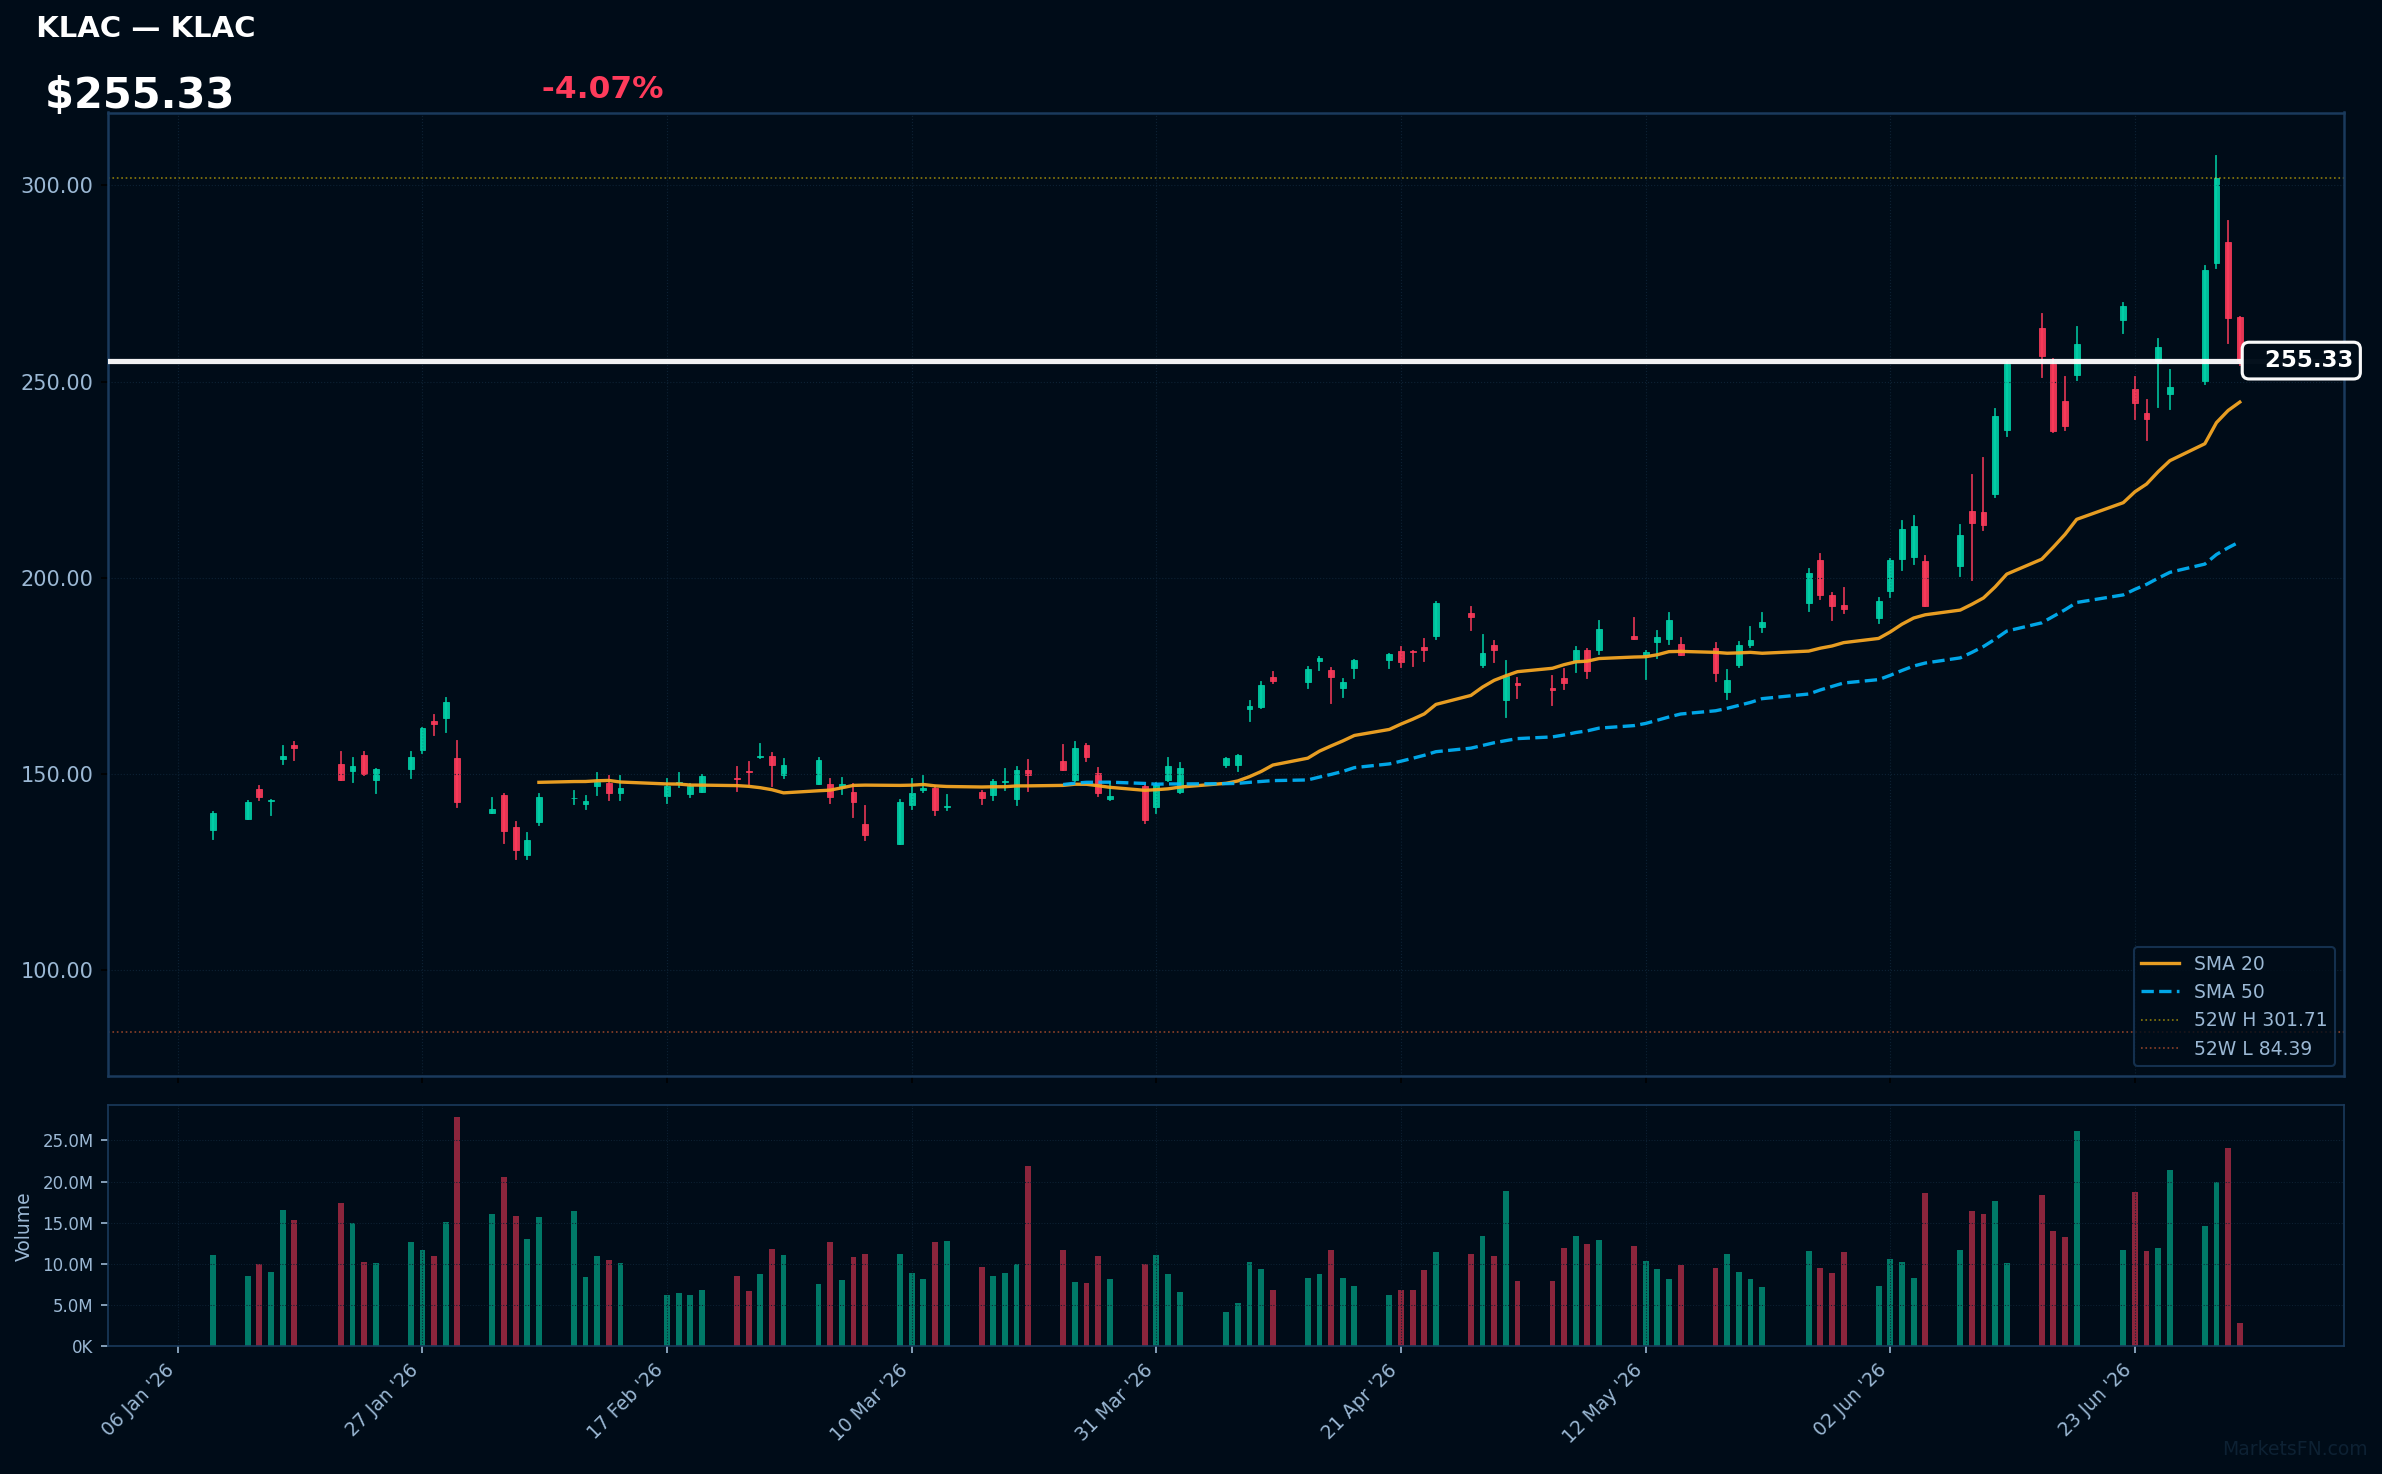
KLAC | KLA Corp | Technology | Price: $255.35 | Day: -4.07% | 1W: -1.34% | 1M: +24.84% | RSI: 54.8 | vs MA200: +67.9% | Trend: Above MA20, MA50, MA200
Market Commentary
The Nasdaq 100 exhibited strong breadth today, with 77 of its 101 constituents advancing, translating to a robust 76.2% advance rate. This positive session tone is underscored by an average daily change of +0.76%, indicating a healthy appetite for risk among investors. The significant number of advancing stocks suggests a broad-based rally, which is a bullish signal for market sentiment moving forward.
In terms of sector dynamics, technology stocks are at the forefront of today's movement, with notable gainers including MSTR, PLTR, and AAPL. However, the presence of major technology names like TSLA and META among the top losers indicates a potential rotation within the sector. This shift could suggest that investors are reallocating capital from high-flying tech stocks to those with more stable growth prospects, particularly in healthcare and utilities, as evidenced by the top gainers.
Traders should keep a close eye on key risk levels, particularly the performance of stocks above their 200-day moving average, which stands at only 12 (11.9%). A sustained decline in this metric could signal underlying weakness. Additionally, monitoring the performance of the top losers may provide insights into sector vulnerabilities, especially if they continue to underperform in the coming sessions.
Methodology
Daily ranking uses the latest session close versus the prior close. RSI (14-day EWM), MA20, MA50, and MA200 are computed from 12 months of daily OHLCV data sourced from Yahoo Finance. Charts show the last 120 trading sessions with SMA 20/50, 52-week H/L markers, and volume. Recent news (last 12 h) is sourced from FinViz. Updated every trading day.
Disclaimer
The content on MarketsFN.com is provided for educational and informational purposes only. It does not constitute financial advice, investment recommendations, or trading guidance. All investments involve risks, and past performance does not guarantee future results. You are solely responsible for your investment decisions and should conduct independent research and consult a qualified financial advisor before acting. MarketsFN.com and its authors are not liable for any losses or damages arising from your use of this information.
Related Articles
- S&P 500 Bull & Bear Radar — July 02, 2026 — S&P 500 Bull & Bear Radar — July 02, 2026 A daily technical sweep of 495 S&P 500 constituents ranked by session…
- Nasdaq 100 52-Week Highs & Lows Radar: Linde Plc (LIN), Copart, (CPRT) and more — Nasdaq 100 stocks nearest to their 52-week high and low. Bloomberg-style charts, RSI/MA analysis and Grok commentary.
- S&P 500 52-Week Highs & Lows Radar: GE Aerospace (GE), VICI Properties (VICI) and more — S&P 500 stocks nearest to their 52-week high and low. Bloomberg-style charts, RSI/MA analysis and Grok commentary.
- Nasdaq 100 2026 YTD Highs & Lows Radar: Linde Plc (LIN), Constellation Energyoration (CEG) and more — Nasdaq 100 stocks nearest to their 2026 year-to-date high and low. Bloomberg-style charts, RSI/MA analysis and Grok…
- S&P 500 2026 YTD Highs & Lows Radar: Bank Of America (BAC), Walmart (WMT) and more — S&P 500 stocks nearest to their 2026 year-to-date high and low. Bloomberg-style charts, RSI/MA analysis and Grok…